

72f9e8ccab1569c00b62d6df28d3295c.ppt
- Количество слайдов: 45
 Storm Morphological and Rainfall Characteristics of TRMM Precipitation Features Stephen W.") (photo credit NASA) Storm Morphological and Rainfall Characteristics of TRMM Precipitation Features Stephen W. Nesbitt, Robert Cifelli, and Steven A. Rutledge Radar Meteorology Group - Department of Atmospheric Science - Colorado State University
(photo credit NASA) Storm Morphological and Rainfall Characteristics of TRMM Precipitation Features Stephen W. Nesbitt, Robert Cifelli, and Steven A. Rutledge Radar Meteorology Group - Department of Atmospheric Science - Colorado State University
 Dan Cecil (UAH)") Acknowledgements • • Ed Zipser and Chuntao Liu (U of U) Dan Cecil (UAH) Erich Stocker and John Kwiatkowski (NASA GSFC TSDIS) Paul Hein for computer support Margi Cech for administrative Support Rest of the Radarmet Group Funding from NASA Precipitation Measurement Science Team (R. Kakar)
Acknowledgements • • Ed Zipser and Chuntao Liu (U of U) Dan Cecil (UAH) Erich Stocker and John Kwiatkowski (NASA GSFC TSDIS) Paul Hein for computer support Margi Cech for administrative Support Rest of the Radarmet Group Funding from NASA Precipitation Measurement Science Team (R. Kakar)
 Why study the morphology of precipitating systems? • • To improve cumulus parameterizations in GCMs? • “Scale separation” in traditional CGM convective parameterizations make it difficult to compare model and observations (Grabowski 2004) So, why push onward? • • Global CRMs still years off However, quasi-3 D moist convective parameterizations or “superparameterizations” are being developed, tested (Arakawa 2004) Mesoscale dynamics key in representing important thermodynamical, momentum transport effects involved in the linkage between deep convection and processes like the MJO (Grabowski 2003, 2004) The observational community needs to help the modeling community evaluate these rapidly developing approaches, especially in the Tropics
 How to objectively determine feature size? NRL Monterey
 Questions to be addressed with this study • Many previous studies have examined the horizontal structure of storms: • • • IR cloud clusters regionally (e. g. , Williams and Houze 1987, Mapes and Houze 1993) and globally (e. g. , Machado and Rossow 1998) Radar echoes regionally using ground based radar (Lopez 1977, Rickenbach and Rutledge 1998) and the TRMM PR (Nesbitt et al. 2000) With TRMM, we can examine these parameters Tropics-wide What is the parameter space of the precipitating features’ echo horizontal dimension? How do features of various scales contribute to rainfall in a given region? What is the relationship between vertical and horizontal structure of these systems?
 Factors influencing rainfall systems’ horizontal structure • • • External - Dynamical effects • Large scale, mesoscale vertical motions, and their spatial extent Internal - Microphysical effects • Particle sizes, fallspeeds Mixed External - Internal effects (feedbacks) • • Microphysical impacts on drafts, cold pool Effects of convective system on large scale momentum budget Yuter and Houze (1995)
") TRMM Instruments • PR Swath • VIRS Swath • • TRMM Microwave Imager (TMI) 759 km swath 9 channels, 10 - 85 GHz, dual polarization, elliptically-scanning Low frequency channel brightness temperatures directly proportional to liquid water path High frequency channel brightness temperatures proportional to precipitation-sized ice particle optical depth • • TMI Swath • http: //trmm. gsfc. nasa. gov Precipitation Radar (PR) 215 km swath Ka Band - 14 GHz - 2. 2 cm subject to significant attenuation in moderate+ rain 17 d. BZ minimum detectable signal 4 x 0. 25 -1. 5 km resolution Non-Doppler, Non-polarimetric Calibrated to within ± 1 d. BZ Visible and Infrared Scanner (VIRS) 720 km swath Measures radiances at 5 channels from 0. 6 -12 μm • •
TRMM Instruments • PR Swath • VIRS Swath • • TRMM Microwave Imager (TMI) 759 km swath 9 channels, 10 - 85 GHz, dual polarization, elliptically-scanning Low frequency channel brightness temperatures directly proportional to liquid water path High frequency channel brightness temperatures proportional to precipitation-sized ice particle optical depth • • TMI Swath • http: //trmm. gsfc. nasa. gov Precipitation Radar (PR) 215 km swath Ka Band - 14 GHz - 2. 2 cm subject to significant attenuation in moderate+ rain 17 d. BZ minimum detectable signal 4 x 0. 25 -1. 5 km resolution Non-Doppler, Non-polarimetric Calibrated to within ± 1 d. BZ Visible and Infrared Scanner (VIRS) 720 km swath Measures radiances at 5 channels from 0. 6 -12 μm • •
") Precipitation Feature Database Purpose: LIS “flashes” To reduce the TRMM raw data (4 TB/yr) to a managable dataset (100 GB/yr) that may be easily queried on a desktop workstation + + + What is a precipitation feature? Anything you want it to be! Nesbitt et al. (2000) Definition: > 4 contiguous pixels of PR “near surface” reflectivity > 20 d. BZ from or 85 GHz PCT < 250 K 85 GHz PCT 250 K contour + + +
Precipitation Feature Database Purpose: LIS “flashes” To reduce the TRMM raw data (4 TB/yr) to a managable dataset (100 GB/yr) that may be easily queried on a desktop workstation + + + What is a precipitation feature? Anything you want it to be! Nesbitt et al. (2000) Definition: > 4 contiguous pixels of PR “near surface” reflectivity > 20 d. BZ from or 85 GHz PCT < 250 K 85 GHz PCT 250 K contour + + +
 “Version 6” Precipitation Feature Database • Level 1 Data • • • PR, TMI, VIRS, LIS stored within PR swath TMI, VIRS, LIS stored within 10 km of TMI rain Level 2 Data • Statistical Parameters for each PF according to 3 definitions • • • Nesbitt et al. (2000) PR U TMI rain rate >0 PR and TMI Rain Retrievals VIRS near TMI Rain Area TMI Rain and Hydrometeor Retrievals
 • • The “version 5” database extends from 12/97") Additional Details - PF Database(s) • • The “version 5” database extends from 12/97 -11/00, currently in house The “version 6” database is currently being processed at NASA GSFC TSDIS, should be finished processing by the end of summer 2005 (12/97 - end of mission), currently archived at the University of Utah Nearly 12 million features in 6 years, 18 billion precipitating PR profiles The database contains ~60 characteristics for each PF, i. e. : • • • PR profiles & rainfall retrievals TMI brightness temperatures, rainfall and hydrometeor retrievals LIS lightning flash data collocated with PFs VIRS Brightness Temperatures within PR swath, TMI “raining” area Version 5 database has data nearest previous 6 hr NCEP reanalysis grid point, version 6 will at some point (+ECMWF? )
Additional Details - PF Database(s) • • The “version 5” database extends from 12/97 -11/00, currently in house The “version 6” database is currently being processed at NASA GSFC TSDIS, should be finished processing by the end of summer 2005 (12/97 - end of mission), currently archived at the University of Utah Nearly 12 million features in 6 years, 18 billion precipitating PR profiles The database contains ~60 characteristics for each PF, i. e. : • • • PR profiles & rainfall retrievals TMI brightness temperatures, rainfall and hydrometeor retrievals LIS lightning flash data collocated with PFs VIRS Brightness Temperatures within PR swath, TMI “raining” area Version 5 database has data nearest previous 6 hr NCEP reanalysis grid point, version 6 will at some point (+ECMWF? )
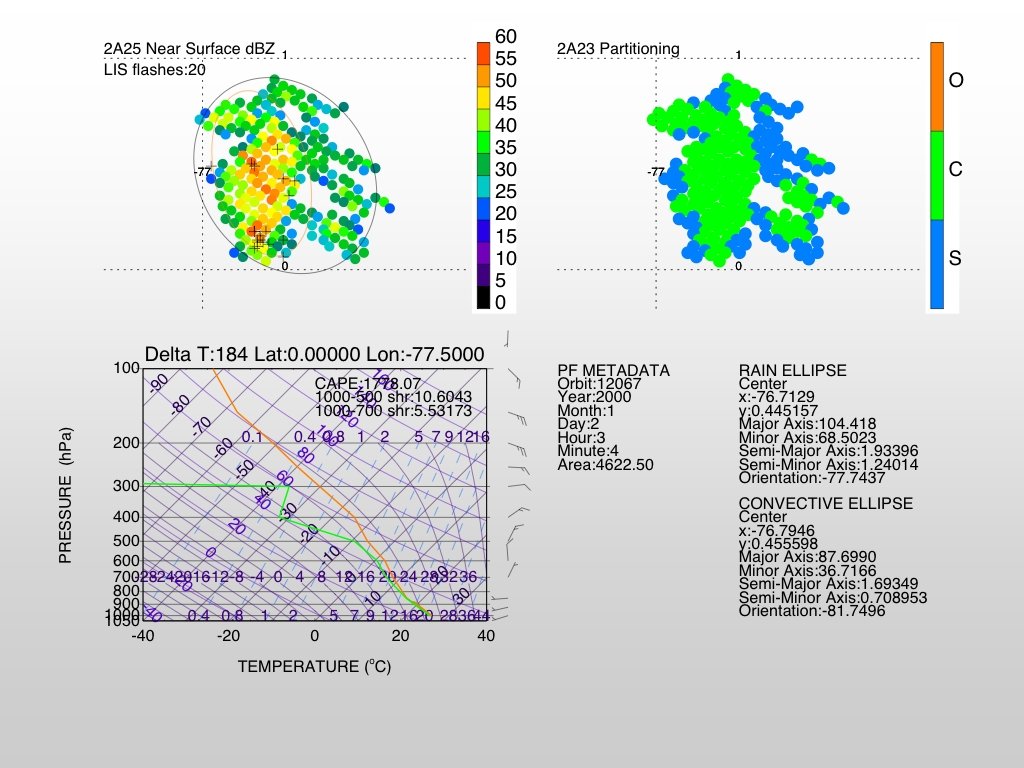
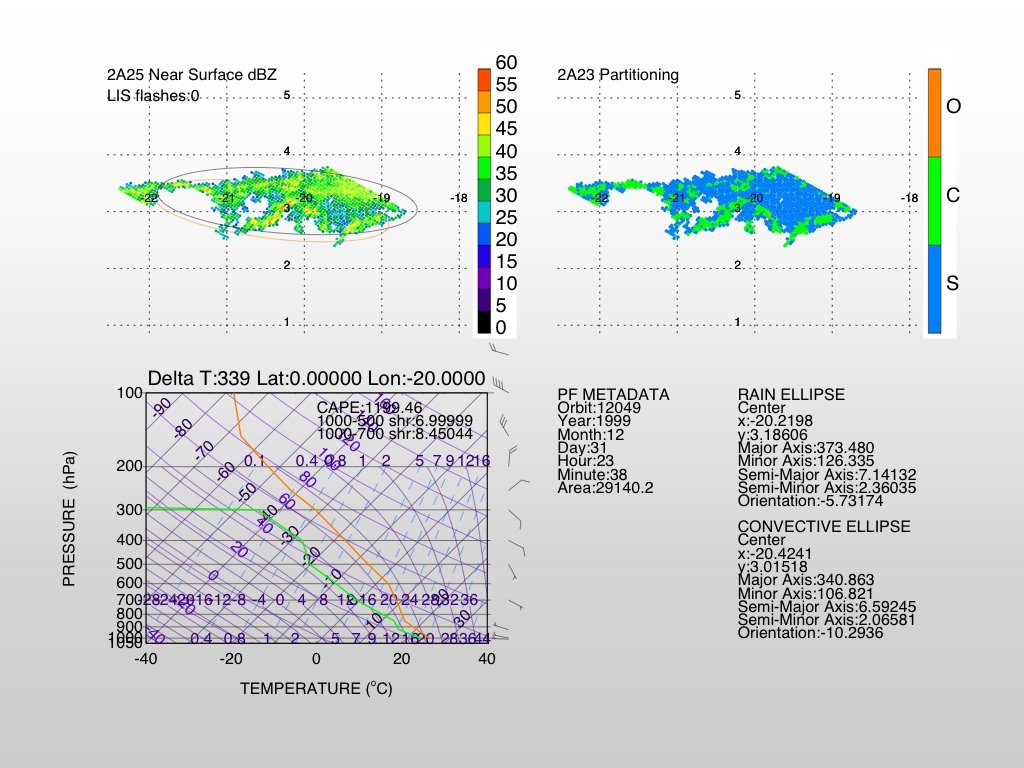
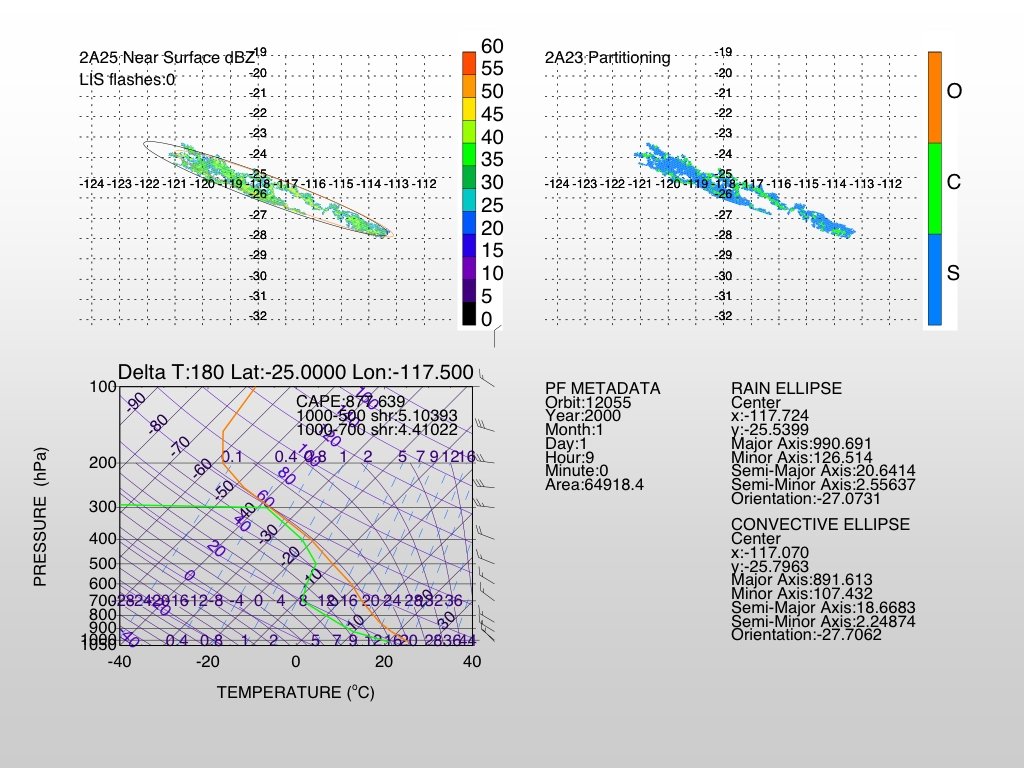
 Feature Size Calculation We record the major and minor axis lengths, can calculate “eccentricity” d. BZ Other Edge of PR swath “rain ellipse” ma Convective axis jor or a • To calculate PF horizontal dimension, we use a least squares ellipse-fitting technique using the location of identified pixels min • Stratiform MADAGASCAR Feature sizes determined from TRMM are certainly a lower limit
 Rain Area vs. Ellipse Fit Area
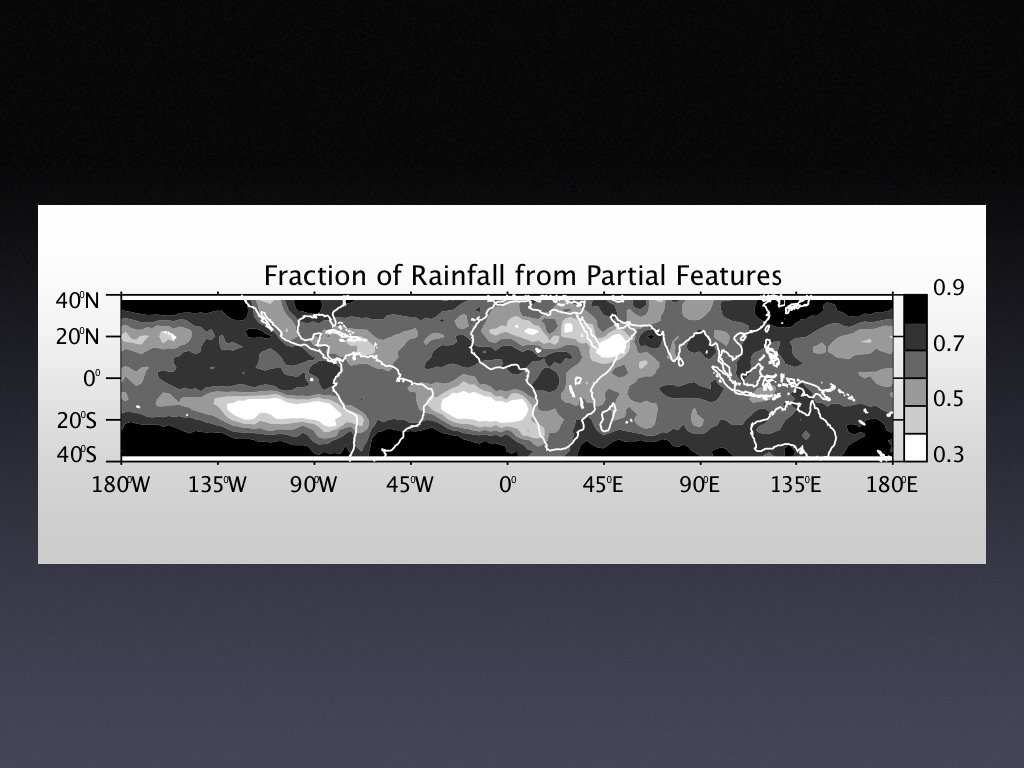
 “Edge Effects”
 Feature area as determined by the PR and TMI
 Normalized Cumulative Size Distributions
 Examples of Ellipse Fits All Features “Whole” Features
 Regional Variability in Feature Size
 Seasonal Variability in Feature Size
 Latitudinal Differences in Feature Size, Maximum Dimension Area Max Dimension
 Max Dimension at Median Rain Volume
 Rain Budget Description The rainfall budget of precipitation features in a given area can be given by: where: total volumetric rain [mm/hr x km 2] conditional rain rate [mm/hr] mean area [km 2] number of features (Nesbitt and Zipser 2003)
 Rain Budgets
 Relationship between VIRS IR tops and PR d. BZ Heights 20 d. BZ land ocean 30 d. BZ 40 d. BZ
 Relationship between VIRS IR tops and PR d. BZ Heights 20 d. BZ land ocean 30 d. BZ 40 d. BZ
 Relationship between VIRS IR tops and PR d. BZ Heights Celsius IR Tb Celsius land ocean 85 GHz PCT
 PR Vertical Structure and Rainfall Z 30 Ocean number — Land number -Ocean rain fraction — Land rain fraction -- Z 20 Z 40
 IR and 85 GHz Ice Scattering and Rainfall Ocean number — Land number -Ocean rain fraction — Land rain fraction -- Min 11. 7 μm Tb Min 85 GHz PCT
 Summary • Despite “edge effects, ” it appears as though the PR can be used to examine relevant PF characteristics as a function of feature size • • • Comparison with a ground radar network as over the USA or IR data may be useful to evaluate effects of narrow PR swath in determining true feature extent The next step is to collaborate with modelers to compare statistics of simulated versus observed PFs in CRMs, superparameterizations Future work will focus on the ability of the NCEP reanalysis (and other data) to identify the environmental characteristics related to convective regimes - implications for GPM
 Questions?
 Feature Type Classification Features have been broken down by horizontal and vertical extent (acronym defined in H, V order) major axis > 100 km 17 d. BZ echo top > -40°C level 17 d. BZ echo top < -40°C level 32. 4 km < major axis < 100 km major axis < 32. 4 km LD (large size, deep) MCS? MD (medium size, deep) SD (small size, deep) LS (large size, shallow) MS (medium size, shallow) SS (small size, shallow)
 Feature Populations Percent of total rainfall stratiform Percent of total stratiform rainfall Type Number of features LD 113660 54. 2% 44. 6% 57. 9% LS 125974 13. 2% 60. 0% 19. 0% MD 143936 9. 6% 16. 3% 3. 8% MS 1002486 11. 4% 39. 1% 10. 6% SD 54760 1. 3% 10. 3% SS 3484901 10. 4% 33. 6% 8. 3%
 Fractional Rain Contribution by Feature Type
 by Feature Type") Unconditional Rain Rates (mm/hr) by Feature Type
Unconditional Rain Rates (mm/hr) by Feature Type
 Fraction of Rain Stratiform by Feature Type
 Mean NCEP Equivalent Potential Temperature by Feature Type
 Mean NCEP Wind Speed by Feature Type
 Mean NCEP Relative Humidity by Feature Type
 Mean NCEP Pressure Vertical Velocity by Feature Type
 • sensing tool to look at the regional and seasonal variation of precipitation modes throughout the Tropics; physical Where do exist betweenhere? and we go from TRMM consistencies the NCEP reanalysis TRMM’s advantage is that it can sample everywhere, but its resolution and sampling can introduce some caveats Still need to gather and examine detailed field campaign data to look at storm intensity and dynamics – microphysics – lightning relationships However, TRMM data provides new insights on the regional variability of rain regimes • •
 Zonal variability in Stratiform Fraction by Feature Type
 Zonal Variability Conditional Rain Rates