

646d357f707e564d07b50a4f6c78ccf2.ppt
- Количество слайдов: 35
 Pharmacokinetic Modeling of Environmental Chemicals Part 1: Principles Harvey J. Clewell, Ph. D. Director, Center for Human Health Assessment The Hamner Institutes for Health Sciences Research Triangle Park, North Carolina
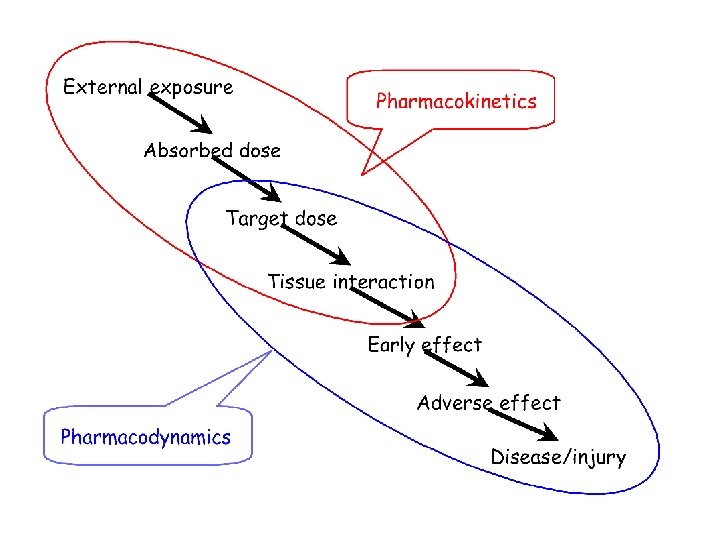
 Pharmacokinetics • Studies of the change in chemical distribution over time in the body • Explores the quantitative relationship between Absorption, Distribution, Metabolism, and Excretion of a given chemical • Classical models – ‘Data-based’, empirical compartments – Describes movement of chemicals with fitted rate constants • Physiologically-based models: – Compartments are based on real tissue volumes – Mechanistically based description of chemical movement using tissue blood flow and simulated in vivo transport processes.
 Pharmacokinetics Blood Conc - mg/L The study of the quantitative relationships between the absorption, distribution, metabolism, and eliminations (A-D-M-E) of chemicals from the body. intravenous (Chemical) k(abs) inhalation C 1 k 21 time - min C 2 V 1 k 12 V 2 k(elim) urine, feces, air, etc.
 A 2 k 21 X X X A 1 KO X k 12 kout X time Collect Data Tissue Concentration Conventional Compartmental PK Modeling X X X X time Select Model Ct = A e –ka·t Fit Model to Data + B e-kb·t
 Example of Simple Kinetic Model: One-compartment model with bolus dose Dose Volume? Purpose: In a simple (1 -compartment) system, determine volume of distribution Terminology: Compartment = a theoretical volume for chemical Steady-state = no net change of concentration Bolus dose = instantaneous input into compartment Method: 1. Dose: Add known amount (A) of chemical 2. Experiment: Measure concentration of chemical (C) in compartment 3. Calculate: A ‘compartmental’ Volume (V)
 Example of Simple Kinetic Model: One-compartment model with bolus dose • Basic assumption: – Well stirred, instant equal distribution within entire compartment • Volume of distribution = A/C – In this classical model, V is an operational volume • V depends on site of measurement • This simple calculation only works IF: – Compound is rapidly and uniformly distributed – The amount of chemical is known – The concentration of the solution is known. What happens if the chemical is able to leave the container?
 Describing the Rates of Chemical Processes - 1 Chemical in the System • Rate equations: – Describe movement of chemical between compartments • The previous example had instantaneous dosing • Now, we need to describe the rate of loss from the compartment • Zero-order process: – rate is constant, does not depend on chemical concentration rate = k x C 0 = k • First-order process: – rate is proportional to concentration of ONE chemical rate = k x C 1
 Describing the Rates of Chemical Processes - 2 Chemical Systems • Second-order process: – rate is proportional to concentration of both chemicals Rate = k x C 1 x C 2 • Saturable processes*: – Rate is dependent on interaction of two chemicals – One reactant, the enzyme, is constant – Described using Michaelis-Menten* equation Rate = (Vmaxx C) / ( C + Km) *Michaelis-Menten kinetics can describe: – Metabolism – Carrier-mediated transport across membranes – Excretion M-M kinetics
 1 -Comp model with bolus dose and 1 st order elimination Dose Conc? Purpose: Examine how concentration changes with time Mass-balance equation (change in C over time): - d. A/dt = -ke x A, or - d. C/dt = -ke x C where ke = elimination rate constant Concentration; - Rearrange and integrate above rate equation C = C 0 x e-ke · t, or ln C = ln C 0 - ke · t Half-life (t 1/2): -Time to reduce concentration by 50% -replace C with C 0/2 and solve for t t 1/2 = (ln 2)/ke = 0. 693/ke
 1 -Comp model with bolus dose and 1 st order elimination Dose Clearance: volume cleared per time unit Conc - if ke = fraction of volume cleared per time unit, ke = CL/V (CL=ke*V) Calculating Clearance using Area Under the Curve (AUC): AUC = average concentration - integral of the concentration - C dt CL = volume cleared over time (L/min) d. A/dt = - ke. A = -ke V C d. A/dt = - CL · C d. A = - CL C dt Dose = CL · AUC CL = Dose / AUC
 1 -Comp model with continuous infusion and 1 st order elimination Calculating Clearance at Steady State: • At steady state, there is no net change in concentration: d. C/dt = k 0/V – ke · C = 0 Steady State • Rearrange above equation: k 0/V = ke · Css • Since CL = ke · V , CL = k 0/Css
 2 -Comp model with bolus dose and 1 st order elimination Calculating Rate of Change in Chemical: k 12 1 2 ke k 21 – Central Compartment (C 1): d. C 1/dt = k 21· C 2 - k 12· C 1 - ke· C 1 – Peripheral (Deep) Compartment (C 2): d. C 2/dt = k 12· C 1 - k 21· C 2
 Linear and Non-linear Kinetics • Linear: – All elimination and distribution kinetics are 1 st order • Double dose double concentration 100 10 1 • Non-linear: – At least one process is NOT 1 st order • No direct proportionality between dose and compartment concentration
 PBPK Modeling • Pharmacokinetic modeling is a valuable tool for evaluating tissue dose under various exposure conditions in different animal species. • To develop a full understanding of the biological responses caused by exposure to toxic chemicals, it is necessary to understand the processes that determine tissue dose and the interactions of chemical with tissues. • Physiological modeling approaches are used to uncover the biological determinants of chemical disposition
 Physiologically Based Pharmacokinetics Ci Qp Cx Qc Qc Lung Ca Cvl Liver QL Cvf Fat Qf Cvr Cvs Rapidly perfused (brain, kidney, etc. ) Slowly perfused (muscle, bone, etc. ) Qr Qs
 PBPK Models Building a PBPK Model: 1. Define model compartments – Represent tissues 2. Write differential equation for each compartment 3. Assign parameter values to compartments – Compartments have defined volumes, blood flows 4. Solve equations for concentration – Numerical integration software (e. g. Berkeley Madonna, ACSL) Simple model for inhalation
") Parameterizing the Model: Experimental Determination – Partition Coefficients: • in vitro: vial equilibration (CTissue/Cair) dialysis (CTissue/Cbuffer) ultrafiltration (CTissue/Cbuffer) • in vivo: steady state (CTissue/CBlood) – Metabolism: • in vitro: tissue homogenate cell suspension tissue slice cell gas uptake • in vivo: direct measurement of metabolites
Parameterizing the Model: Experimental Determination – Partition Coefficients: • in vitro: vial equilibration (CTissue/Cair) dialysis (CTissue/Cbuffer) ultrafiltration (CTissue/Cbuffer) • in vivo: steady state (CTissue/CBlood) – Metabolism: • in vitro: tissue homogenate cell suspension tissue slice cell gas uptake • in vivo: direct measurement of metabolites
 Modeling Lung Body Fat Metabolic Constants Tissue Solubility Tissue Volumes") Physiologically Based Pharmacokinetic (PBPK) Modeling Lung Body Fat Metabolic Constants Tissue Solubility Tissue Volumes Blood and Air Flows Experimental System Liver Model Equations Define Realistic Model Collect Needed Data Refine Model Structure You can be wrong! Tissue Concentration Air X X X X Time Make Predictions
Physiologically Based Pharmacokinetic (PBPK) Modeling Lung Body Fat Metabolic Constants Tissue Solubility Tissue Volumes Blood and Air Flows Experimental System Liver Model Equations Define Realistic Model Collect Needed Data Refine Model Structure You can be wrong! Tissue Concentration Air X X X X Time Make Predictions
 Approach for Developing a PBPK Model Problem Identification Mechanisms of Toxicity Literature Evaluation Biochemical Constants Physiological Constants Model Formulation Simulation Refine Model Compare to Kinetic Data Validate Model Design/Conduct Critical Experiments Extrapolation to Humans
 Models in Perspective “…no model can be said to be ‘correct’. The role of any model is to provide a framework for viewing known facts and to suggest experiments. ” -- Suresh Moolgavkar “All models are wrong and some are useful. ” -- George Box
 PBPK Model Compartment Types - Storage compartment QT QT CVT CA Same as 1 -compartment model with continuous infusion • Rate in = QT · CA where QT = tissue blood flow, CA = arterial blood conc • Rate out = QT · CVT = QT · CT/PT where CVT = conc in tissue blood, CT = conc in tissue, PT = partition coefficient • Assume Well-stirred compartment, so that, CVT = CT/PT
 PBPK Model Compartment Types - Storage compartment QT QT CVT CA Same as 1 -compartment model with continuous infusion • Calculating Change in Amount: – Change in amount = rate in – rate out d. A/dt = QT x (CA – CT/PT) d. C/dt = QT x (CA – CT/PT) /V
 Description for a Single Tissue Compartment Terms Qt = tissue blood flow Qt. Cart V t; A t; P t Qt. Cvt Tissue Cvt = venous blood concentration Pt = tissue blood partition coefficient Vt = volume of tissue At = amount of chemical in tissue d. At = Vt d. Ct = Qt. Cart - Qt. Cvt dt dt Cvt = Ct/Pt mass-balance equation: (venous equilibration assumption)
 Then used in toxicology. . . Is any of this really new? Qalv Cinh Qc Cven Cvt Qalv Alveolar Space Calv (Cart/Pb) Qc Lung Blood Cart Fat Tissue Group Qt Cart Qm Cvm Muscle Tissue Group Qr Cvr Richly Perfused Tissue Group Cart Liver Ql Cvl ( Metabolizing Tissue Group Vmax Ramsey and Andersen (1984) Km ) Cart Metabolites
 Styrene & Saturable metabolism rate of change of amount in liver = rate of uptake in arterial blood - rate of loss in venous blood - rate of loss by metabolism d. Al = Ql (Ca - Cvl) - Vm Cvl dt Km + Cvl • Equations solved by numerical integration to simulate kinetic behavior. • With venous equilibration, flow limited assumptions.
 Dose Extrapolation – Styrene How does it work? Venous Concentration – mg/lier blood 100 10 Conc = 1200 ppm Conc = 600 ppm 1 0. 01 Conc = 80 ppm 0. 001 0 5 10 15 TIME - hours 20 25
 What do we need to add/change in the models to incorporate another dose route – iv or oral? Qalv Alveolar Space Cinh Qc Qc Lung Blood Cven IV Cart Fat Tissue Group Cvt Calv (Cart/Pb) Qt Cart Richly Perfused Tissue Group Qr Cvr Oral Qm Cvm Muscle Tissue Group Cart Liver Ql Cvl ( Metabolizing Tissue Group Vmax Km ) Cart Metabolites
 Styrene - Dose Route Extrapolation What do we need to add/change in the models to incorporate these dose routes? 10 Styrene Concentration (mg/l) 100 IV 10 1. 0 0. 1 0. 01 0 0. 6 1. 2 1. 8 Hours 2. 4 3. 0 3. 6 Oral 1. 0 0. 1 0. 01 0 0. 4 0. 8 1. 2 1. 6 Hours 2. 0 2. 4 2. 8
 What do we need to add/change in the models to describe another animal species? Qalv Alveolar Space Cinh Qc Sizes Flows Metabolic Constants Qc Lung Blood Cven Cart Fat Tissue Group Cvt Calv (Cart/Pb) Qt Cart Qm Cvm Muscle Tissue Group Qr Cvr Richly Perfused Tissue Group Cart Liver Ql Cvl ( Metabolizing Tissue Group Vmax Km ) Cart Metabolites
 Styrene - Interspecies Extrapolation What do we need to add/change in the models to change animal species? 10 0. 01 376 0. 001 216 51 0. 0001 Styrene Concentration (mg/l) 0. 1 1. 0 80 ppm 0. 1 Blood 0. 01 0. 001 Exhaled Air 0. 0001 0. 00001 0 1. 5 3. 0 4. 5 Hours 6. 0 7. 5 9. 0 0 8 16 24 Hours 32 40 48
 ADVANTAGES OF SIMULATION MODELING IN PHYSIOLOGY AND ALSO IN PHARMACOKINETICS & RISK ASSESSMENT Codification of facts and beliefs (organize available information) Expose contradictions in existing data/beliefs Explore implications of beliefs about the chemical Expose serious data gaps limiting use of the model Predict response under new/inaccessible conditions Identify essentials of system structure Provide representation of present state of knowledge Suggest and prioritize new experiments
 A ‘Systems’ Approach for Dose Response Uptake Absorption Distribution Metabolism Excretion Other TCDD Ligand Interaction w/ cellular networks RTK Stimulus Ah Receptor Adaptor MAPK Effects DRE Transcription
 An Alternate View of PK and PD processes – Systems and Perturbations Exposure Tissue Dose Biological Interaction Perturbation Inputs Biological Function Impaired Function Adaptation Disease Morbidity & Mortality
 Physiological Pharmacokinetic Modeling Principles References Andersen ME, Clewell HJ, Frederick CB. 1995. Applying simulation modeling to problems in toxicology and risk assessment -- a short perspective. Toxicol Appl Pharmacol 133: 181 -187. Brown, R. P. , Delp, M. D. , Lindstedt, S. L. , Rhomberg, L. R. , and Beliles, R. P. 1997. Physiological parameter values for physiologically based pharmacokinetic models. Toxicol Indust Health 13(4): 407 -484. Clewell, H. J. , and Andersen, M. E. 1985. Risk Assessment Extrapolations and Physiological Modeling. Toxicol Ind Health, 1(4): 111 131. Clewell, H. J. , Andersen, M. E. , Barton, H. A. , 2002. A consistent approach for the application of pharmacokinetic modeling in cancer and noncancer risk assessment. Environ. Health Perspect. 110, 85– 93. Dedrick, R. L. 1973. Animal scale up. J Pharmacokinet Biopharm 1: 435 461. Dedrick, R. L. , and Bischoff, K. B. 1980. Species similarities in pharmacokinetics. Fed Proc 39: 54 59. Gerlowski, L. E. and Jain, R. J. (1983). Physiologically based pharmacokinetic modeling: principles and applications. J. Pharm. Sci. , 72: 1103. Ramsey, J. C. and Andersen, M. E. (1984). A physiologically based description of the inhalation pharmacokinetics of styrene in rats and humans. Toxicol. Appl. Pharmacol. 73, 159. Reddy, M. B. (2005). PBPK modeling approaches for special applications: Dermal exposure models. In: Physiologically Based Pharmacokinetic Modeling: Science and Applications, eds. M. B. Reddy, R. S. H. Yang, H. J. Clewell, III, and M. E. Andersen. John Wiley & Sons, Hoboken, New Jersey, pp. 375 -387. Yates, F. E. (1978). Good manners in good modeling: mathematical models and computer simulation of physiological systems. Amer. J. Physiol. , 234, R 159 -R 160. 1978.