5d3d196c373fe7be9daa21a85d7ff68a.ppt
- Количество слайдов: 35
Performance Update Eric Boyd Director of Performance Architecture and Technologies Internet 2

Network support of Science • Science is a global community • Networks links scientists • Collaborative research occurs across network boundaries • For the scientist, the value of the network is the achieved network performance • Scientists should not have to focus on the network; good end-to-end performance should be a given

Large Hadron Collider • International Physics facility located in CERN Switzerland • Major US involvement • 2 major US data repositories (Peta. Bytes/year) • 17 US Institutions provide data analysis and storage • 68 Universities and National Laboratories with scientists looking at the data • Dedicated transatlantic networks connect US to CERN • Advanced network services required over existing campus, connector/regional, and national networks
Achieving Good End-to-End Performance • Internet 2 consists of: • Campuses • Regional networks • Internet 2 backbone network • Our members care about connecting with: • Other members • Government labs & networks • International partners • The Internet 2 community cares about making all of this work
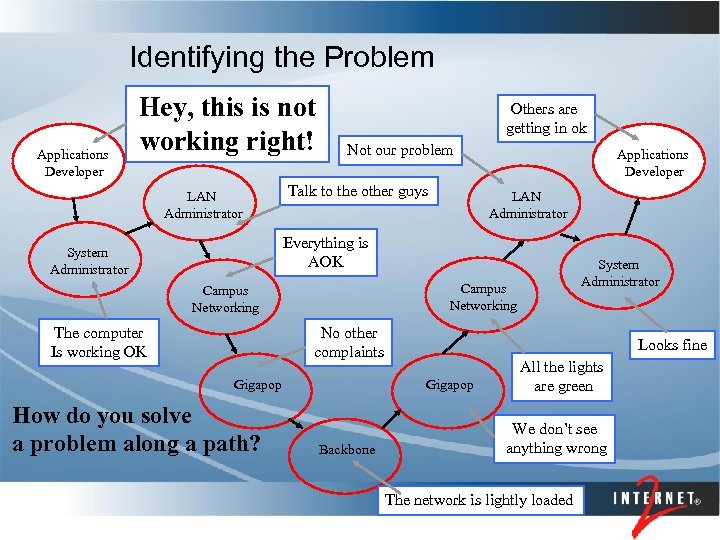
Identifying the Problem Applications Developer Hey, this is not working right! LAN Administrator Others are getting in ok Not our problem Talk to the other guys Applications Developer LAN Administrator Everything is AOK System Administrator Campus Networking The computer Is working OK No other complaints Gigapop How do you solve a problem along a path? System Administrator Looks fine Gigapop Backbone All the lights are green We don’t see anything wrong The network is lightly loaded
Status Quo • Performance is excellent across backbone networks • Performance is a problem end-to-end • Problems are concentrated towards the edge and in network transitions • We need to: • Diagnose: Understand limits of performance • Address: Work with members and application communities to address those performance issues
Vision: Performance Information is … • Available • People can find it (Discovery) • “Community of trust” allows access across administrative domain boundaries (AA) • Ubiquitous • Widely deployed (Paths of interest covered) • Reliable (Consistently configured correctly) • Valuable • Actionable (Analysis suggests course of action) • Automatable (Applications act on data)

e-VLBI Network
e. VLBI Result • Use of integrated network monitoring helped to enable identification of bottleneck (hardware fault) • Automated monitoring allowed view of network throughput variation over time • Highlights route changes, network outages • Automated monitoring also helps to highlight any throughput issues at end points: • E. g. Network Interface Card failures, Untuned TCP Stacks • Integrated monitoring provides overall view of network behavior at a glance
Goal: No more mystery … • Increase network awareness • Set user expectations accurately • Reduce diagnostic costs • Performance problems noticed early • Performance problems addressed efficiently • Network engineers can see & act outside their turf • Transform application design • Incorporate network intuition into application behavior
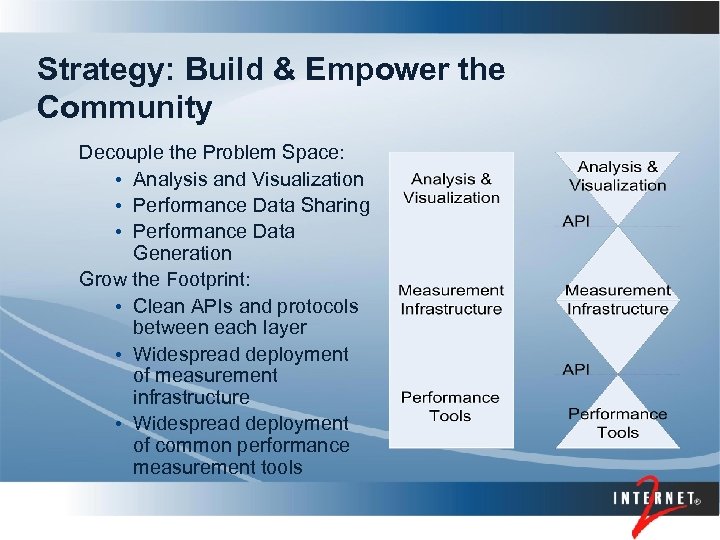
Strategy: Build & Empower the Community Decouple the Problem Space: • Analysis and Visualization • Performance Data Sharing • Performance Data Generation Grow the Footprint: • Clean APIs and protocols between each layer • Widespread deployment of measurement infrastructure • Widespread deployment of common performance measurement tools
Tactics: Leverage position • Internet 2 is leveraged to help provide diagnostic information for “backbone” portion of problem • Create *some* diagnostic tools • Make Abilene data as public as is reasonable • Work on efforts to more widely make performance data available (perf. SONAR) • Contribute to ‘base’ perf. SONAR development • Integrate ‘our’ diagnostic tools as ‘good’ example of perf. SONAR services
From the scientist’s perspective On behalf of the scientist, network engineer or application can easily/automatically: • Discover additional monitoring resources • Authenticate locally • Authorized to use remote network resources to a limited extent • Acquire performance monitoring data from remote sites via standard protocol • Innovate where needed • Customize the analysis and visualization
Internet 2 End-to-End Performance Initiative (E 2 Epi) • Includes: • Internet 2 staff • Internet 2 members • Federal partners • International partners • Building: • Performance monitoring tools • Performance middleware frameworks • Performance improvement tools
Support for E 2 Epi • Funded out of network revenues • Partnerships • Leveraging GÉANT 2, ESnet, and RNP resources through consortium leadership • Grants • NSF Apps - Targeted Assistance and Instrumentation for Internet 2 Applications • NSF SGER - Leveraging Internet 2 Facilities for the Network Research Community • NSF SGER 2 - Network Measurement for International Connections • NSF BTG - Bridging the Gap: End-to-End Networking for Landmark Applications • NLM Pilot - User Experience with the High Performance Internet Infrastructure: Critical Incidents of Success and Failure • NLM NDT - Enhancing the Web 100 -based Network Diagnostic Tool
Performance Tools • Diagnosis • Throughput (BWCTL) • One-Way Delay (OWAMP) • Top 10 Problems in First Mile (NDT) • Solutions • Alternate congestion control (VFER) • Partition the session (Phoebus)
Network Performance Toolkit (NPToolkit) • Knoppix (v 5. 0) based Live-CD • Automatically starts 4 E 2 E performance tools with usable default configurations • BWCTL • NDT • NPAD • OWAMP • Easy customization scripts allows admin tailor system to site needs
Network Diagnostic Tool (NDT) • New Simple Firewall Test added • Google Summer of Code project • Detects blocked ephemeral ports on server and client • New IPv 6 address support • General code cleanup • Virginia Tech contribution • Client’s location can be plotted on map
OWAMP: One-Way Active Measurement Protocol • What is it? • Measures one-way latency: 1 -way ping • Control connection used to broker test request based upon policy restrictions and available resources. (Bandwidth/disk limits) • Specification • http: //www. rfc-editor. org/rfc 4656. txt
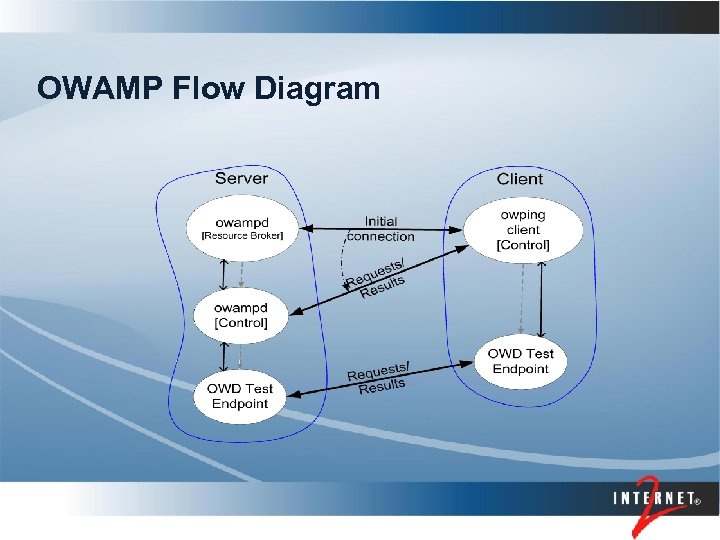
OWAMP Flow Diagram
What’s New? (1) • Protocol status: RFC 4656 • IANA allocated port: 861 • Authentication/Authorization changes • Uses HMAC-SHA 1 for message validation • Uses PBKDF 2 for AES session key creation • keys are now session specific and dynamically generated from passphrases.
What’s New? (2) • Powstream is now a full supported application with documentation • As always - more bug fixes and ports • Details in the distribution
Availability • 3. 0 a release available • Source tarball • Supported release out in the next month after more extensive testing on Abilene measurement hosts • Supported releases will also be provided as RPM’s with many thanks to GA-TECH
Bulk Transport: Killer App • Q: What do we need fat pipes for? • A: Bulk Transport • Flavors: • Straightforward huge file transfer • Interactive high throughput • Instrument data transfer • Poor Performance (~3 Mb/s performance where we should have ~60 -100 Mb/s) • #1 Reason for poor performance: Transport Protocols
VFER – Bulk Transport Tool • Command-line remote copy tool • SCP-style interface • Easy to use on today’s advanced networks • Download, make, install • Portable (no kernel mods) • Out-of-the-box performance • Tolerate minor non-congestive packet loss • Both static file transfer and interactive applications • Runs over UDP • TCP-friendly
VFER – Current Status • Alpha release v 0. 98 (http: //vfer. internet 2. edu) • Working, not polished, delay-based congestion control • SSH-based security
Network Performance Measurement Workshops • Example Course Materials: • http: //e 2 epi. internet 2. edu/npw/presentations. html Goals: • Grow installed base of BWCTL/Iperf, OWAMP, and NDT at Giga. Po. P and regional campuses. • http: //e 2 epi. internet 2. edu/pipes/pmp-dir. html • Begin integration into IT support processes. • Create an installed base for perf. SONAR deployment. • Teach Internet 2 community to use performance tools.
Bridging the Gap • Multi-discipline team addressing 2 major issues • Reset user expectations • 10 Mbytes per second is ‘acceptable’ • Problem resolution takes too long • Better tools and self-guided documentation to improve troubleshooting • Documentation that can be used by both novice and expert
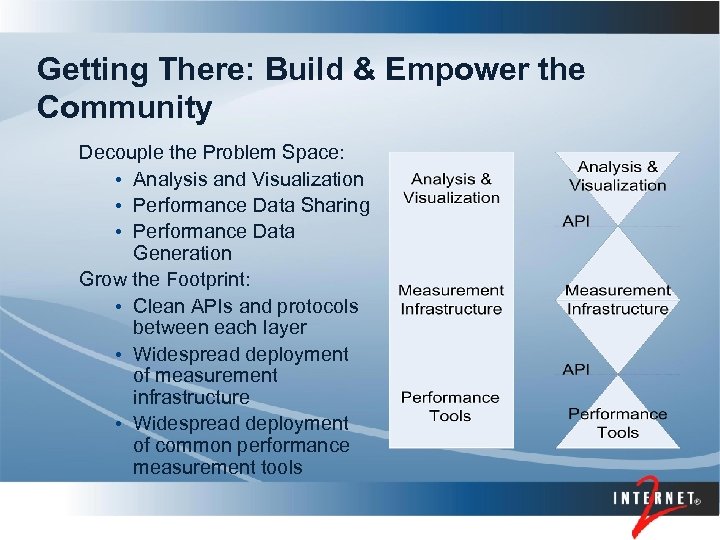
Getting There: Build & Empower the Community Decouple the Problem Space: • Analysis and Visualization • Performance Data Sharing • Performance Data Generation Grow the Footprint: • Clean APIs and protocols between each layer • Widespread deployment of measurement infrastructure • Widespread deployment of common performance measurement tools
What is perf. SONAR? • Performance Middleware • perf. SONAR is an international consortium in which Internet 2 is a founder and leading participant • perf. SONAR is a set of protocol standards for interoperability between measurement and monitoring systems • perf. SONAR is a set of open source web services that can be mixed-and-matched and extended to create a performance monitoring framework
perf. SONAR Design Goals • • Standards-based Modular Decentralized Locally controlled Open Source Extensible Applicable to multiple generations of network monitoring systems • Grows “beyond our control” • Customized for individual science disciplines
perf. SONAR Integrates • Network measurement tools • Network measurement archives • Discovery • Authentication and authorization • Data manipulation • Resource protection • Topology
perf. SONAR Credits • perf. SONAR is a joint effort: • ESnet • GÉANT 2 JRA 1 • Internet 2 • RNP • ESnet includes: • ESnet/LBL staff • Fermilab • Internet 2 includes: • University of Delaware • Georgia Tech • SLAC • Internet 2 staff • GÉANT 2 JRA 1 includes: • Arnes • Belnet • Carnet • Cesnet • CYNet • DANTE • DFN • FCCN • GRNet • GARR • ISTF • PSNC • Nordunet (Uninett) • Renater • Red. IRIS • Surfnet • SWITCH
perf. SONAR Adoption • R&E Networks • Internet 2 • ESnet • GÉANT 2 • European NRENs • RNP • Application Communities • LHC • GLORIAD Distributed Virtual NOC • Roll-out to other application communities in 2007 • Distributed Development • Individual projects (10 before first release) write components that integrate into the overall framework • Individual communities (5 before first release) write their own analysis and visualization software

More Information • Eric Boyd • eboyd@internet 2. edu • 734 -352 -7032 • http: //e 2 epi. internet 2. edu/ • http: //www. perfsonar. net/
5d3d196c373fe7be9daa21a85d7ff68a.ppt