50a1a9dd5b9a229ac27438faeb75cd45.ppt
- Количество слайдов: 44
 Performance Tuning Java Code in Tomcat Ethan Henry egh@klg. com KL Group http: //www. klgroup. com
 What’s Tomcat • Tomcat is the reference implementation of the Java Servlet and Java. Server Pages standards developed under the umbrella of the Apache Software Foundation. • On the chance that you don’t already know, go to: http: //jakarta. apache. org
 Java Servlets • From a Web perspective, Java Servlets are a mechanism for extending web servers, similar to CGI, using Java • From a Java perspective, the Java Servlets specification provides a mechanism for handling & responding to HTTP requests in Java code • http: //java. sun. com/products/servlet
 Java. Server Pages • Java. Server Pages are built on top of servlets and provide a mechanism for creating dynamic web pages using Java and HTML/XML • http: //java. sun. com/products/jsp
 Container-Managed Components • Both Servlets and JSPs (along with EJBs) represent container-managed components (CMCs) • Unlike regular Java. Beans, these components are being actively managed by an outside entity - the container • Containers provide functionality and restrict what the component is allowed to do – container decodes HTTP – components have limited multithreaded behaviour
 Performance Elements • There are number of elements in a web application that can effect performance: – – Network Performance Local Storage Performance Server (Tomcat) Performance Java Performance • Java performance is what we’ll focus on here
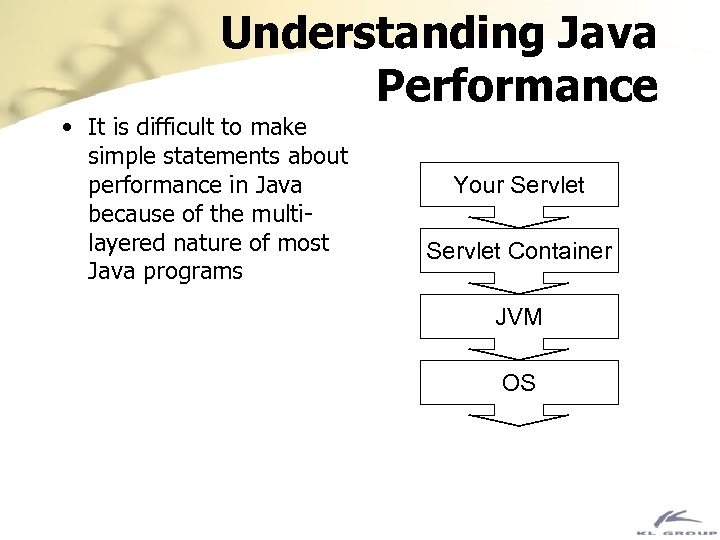 Understanding Java Performance • It is difficult to make simple statements about performance in Java because of the multilayered nature of most Java programs Your Servlet Container JVM OS
 Java Bytecode • Java source is compiled to bytecode, which is then interpreted or compiled into native code by the Java Virtual Machine (JVM) • There are times when looking at the bytecode can be useful in trying to understand the performance implications of using a particular language construct
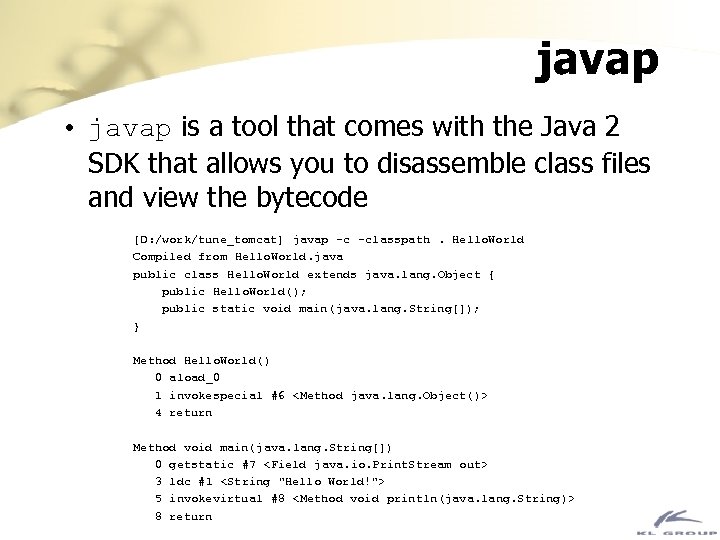 javap • javap is a tool that comes with the Java 2 SDK that allows you to disassemble class files and view the bytecode [D: /work/tune_tomcat] javap -c -classpath. Hello. World Compiled from Hello. World. java public class Hello. World extends java. lang. Object { public Hello. World(); public static void main( java. lang. String[]); } Method Hello. World() 0 aload_0 1 invokespecial #6
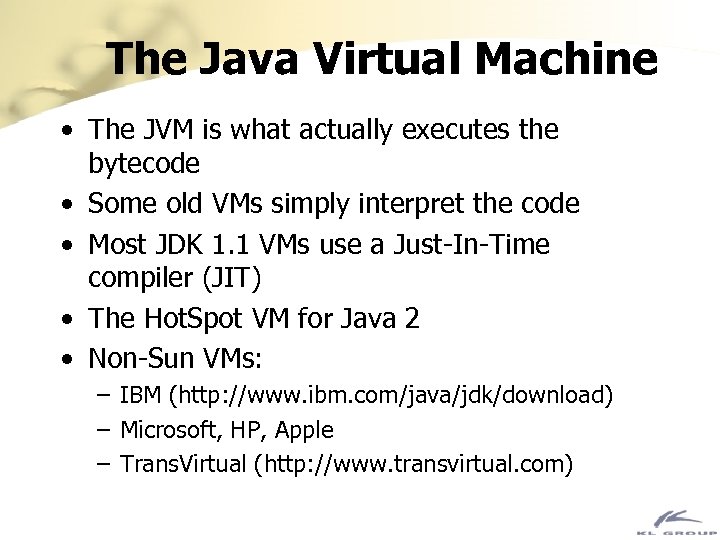 The Java Virtual Machine • The JVM is what actually executes the bytecode • Some old VMs simply interpret the code • Most JDK 1. 1 VMs use a Just-In-Time compiler (JIT) • The Hot. Spot VM for Java 2 • Non-Sun VMs: – IBM (http: //www. ibm. com/java/jdk/download) – Microsoft, HP, Apple – Trans. Virtual (http: //www. transvirtual. com)
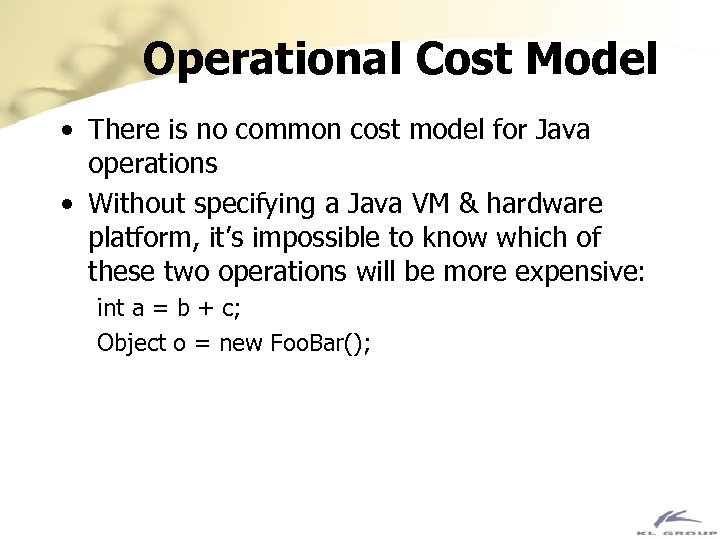 Operational Cost Model • There is no common cost model for Java operations • Without specifying a Java VM & hardware platform, it’s impossible to know which of these two operations will be more expensive: int a = b + c; Object o = new Foo. Bar();
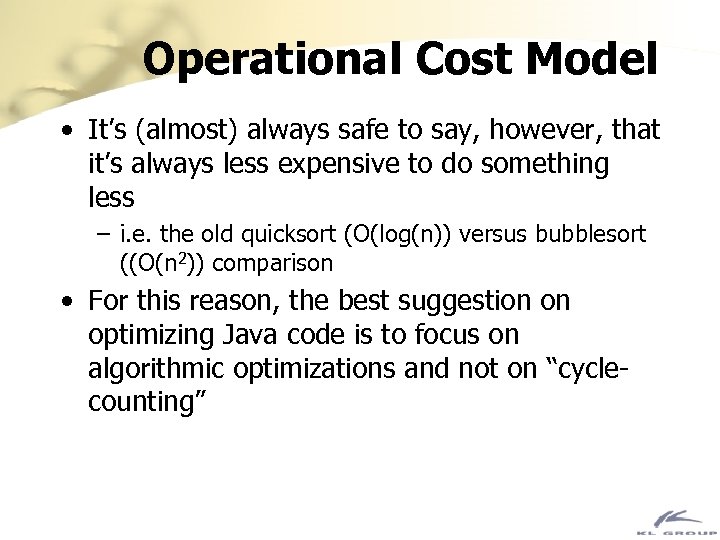 Operational Cost Model • It’s (almost) always safe to say, however, that it’s always less expensive to do something less – i. e. the old quicksort (O(log(n)) versus bubblesort ((O(n 2)) comparison • For this reason, the best suggestion on optimizing Java code is to focus on algorithmic optimizations and not on “cyclecounting”
 General Optimization Tips • The tips are presented roughly in order of the impact they can have on the performance of your program • Depending on your circumstances, there may be some things you can’t change • You should try consider changing other things before performing “major surgery” on your code – e. g. buy a faster machine if you can, determine if I/O bandwidth is the limiting factor, try a different JVM or OS
 Major • • Tune your VM Change your VM Cache Repartition
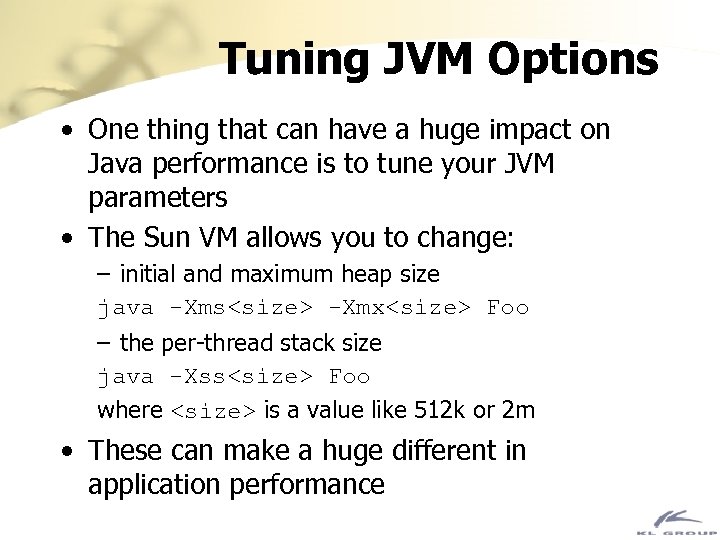 Tuning JVM Options • One thing that can have a huge impact on Java performance is to tune your JVM parameters • The Sun VM allows you to change: – initial and maximum heap size java -Xms
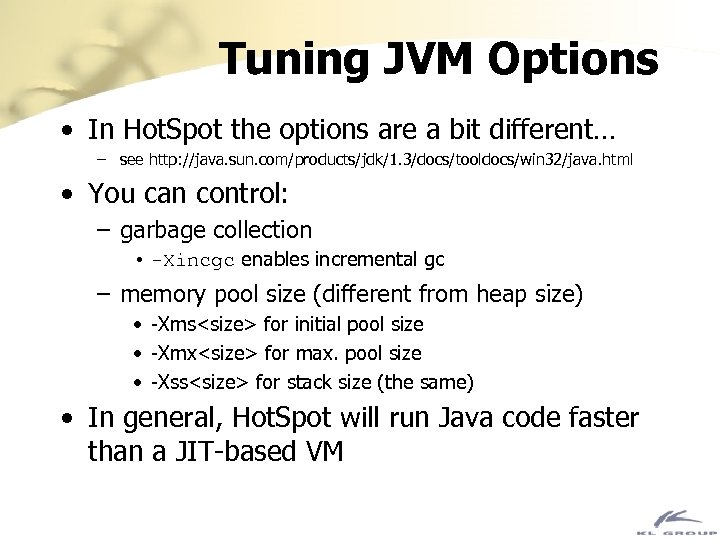 Tuning JVM Options • In Hot. Spot the options are a bit different… – see http: //java. sun. com/products/jdk/1. 3/docs/tooldocs/win 32/java. html • You can control: – garbage collection • -Xincgc enables incremental gc – memory pool size (different from heap size) • -Xms
 Different JVMs • It may not always be possible to switch VMs, but if it is, it’s worth investigating · · · • · · Sun’s JDK 1. 1/1. 2 classic Sun’s JDK 1. 2 with Hot. Spot Sun’s JDK 1. 3 with Server Hot. Spot IBM’s JDK 1. 1. 8 (http: //www. ibm. com/java/jdk/) Apple’s MRJ (http: //www. apple. com/java/) Microsoft SDK for Java (http: //www. microsoft. com/java/)
 Native Compilers · In the context of server-side Java code, native compilers do not often seem like an obvious choice, but they are a possibility · Tower Technology’s Tower. J (http: //www. towerj. com/) · Natural. Bridge Bullet. Train (http: //www. naturalbridge. com/) · Instantiations JOVE (http: //www. instantiations. com/)
 Evaluating Server-Side VMs • One popular way of comparing various VMs is the Volano benchmark – http: //www. volano. com/benchmarks. html • But note that you should still test your application, as some VMs are very good with specific types of operations
 Caching • Caching is effectively trading memory for increased performance • The performance of local resources is almost always better than the performance of remote resources • The only limit to the effectiveness of caching is the amount of physical memory available – caching to secondary storage is usually not useful – make sure that the cache isn’t too big, otherwise it will push other objects out to virtual memory
 Caching • Caching can also help reduce network traffic – having servlets cache database results for use by multiple user sessions • Cache things like: – session information • even if it’s being stored in a database for other reasons like persistence or failover – database queries – RMI method results • Finally, check to see where you make redundant calculations
 Pooling • Related to caching is pooling, where instead of data, objects are cached to be reused by the application • The servlet container may already be doing this - if a servlet implements Single. Thread. Model then the container will create multiple instances of the servlet to handle incoming requests • Pooling is most commonly used with very expensive objects, like database connections – JDBC 2. 0 supports ‘connection pooling’
 Repartioning • The physical distribution of computing resources may effect performance • Again local resources are preferred • For example, a servlet that spends most of it’s time fetching data from a database should be located on the same machine as the database • If that’s not possible, consider replicating or mirroring the db onto the machine running the servlet and querying it • If you can’t repartition, reduce network traffic by avoiding fine-grained APIs
 Minor • • Use String. Buffer Collection classes Synchronization Reduce Object Creation
 Use String. Buffer • Using the String. Buffer class instead of the string concatenation operator (‘+’) is probably the most commonly offered performance tip • Sometimes it can be a major factor if your program manipulates a lot of strings – i. e. servlets that generate HTML • In most programs in general, it’s not a major factor
 Collections • Use collection classes appropriately • Don’t use Vector • Use a concrete implementation of: – Map – List – Set instead • If you need to store large number of double or int values, use an array instead of a collection and the Integer or Float classes
 Collections • In the Sun classic VM, Vectors can be up to 30 x slower than plain arrays and 3 x slower than Array. Lists • In Hot. Spot it’s much closer, Vectors being only 2 x slower
 Synchronization • Avoid synchronized methods except where necessary
 Reducing Object Creation • Creating objects is an expensive operation – more so in pre-Hot. Spot VMs • Try to reduce the creation of short-lived, temporary objects • Use primitives instead of classes like Integer, Double, etc. • Look for unused objects in your code and remove them • Use lazy instantiation so objects are only created when needed – reduces startup time
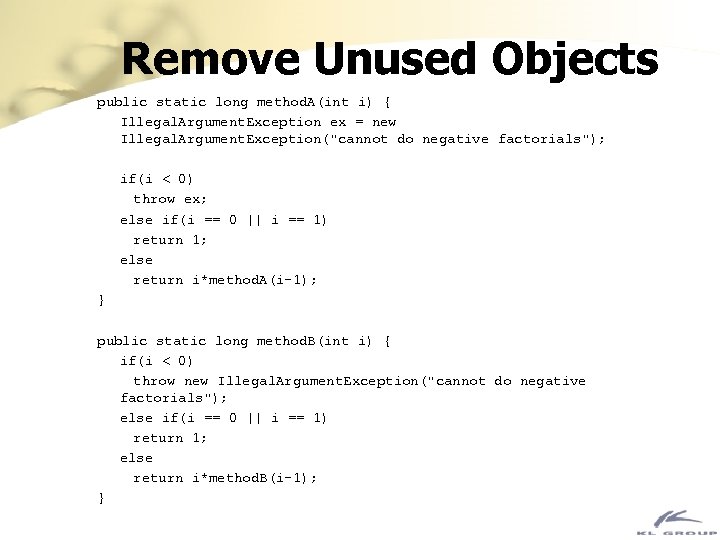 Remove Unused Objects public static long method. A(int i) { Illegal. Argument. Exception ex = new Illegal. Argument. Exception("cannot do negative factorials"); if(i < 0) throw ex; else if(i == 0 || i == 1) return 1; else return i*method. A(i-1); } public static long method. B(int i) { if(i < 0) throw new Illegal. Argument. Exception("cannot do negative factorials"); else if(i == 0 || i == 1) return 1; else return i*method. B(i-1); }
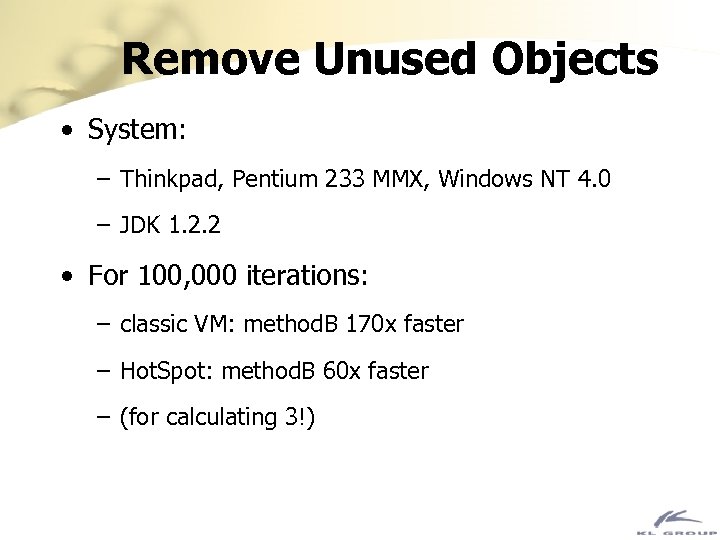 Remove Unused Objects • System: – Thinkpad, Pentium 233 MMX, Windows NT 4. 0 – JDK 1. 2. 2 • For 100, 000 iterations: – classic VM: method. B 170 x faster – Hot. Spot: method. B 60 x faster – (for calculating 3!)
 Memory Usage • Proper memory usage is the key to stable code for long uptimes • Garbage collection doesn’t solve all memory management problems • Java programs don’t have memory leaks like in C++ but are prone to loiterers • Loiterers are objects that are still being referenced but no longer used
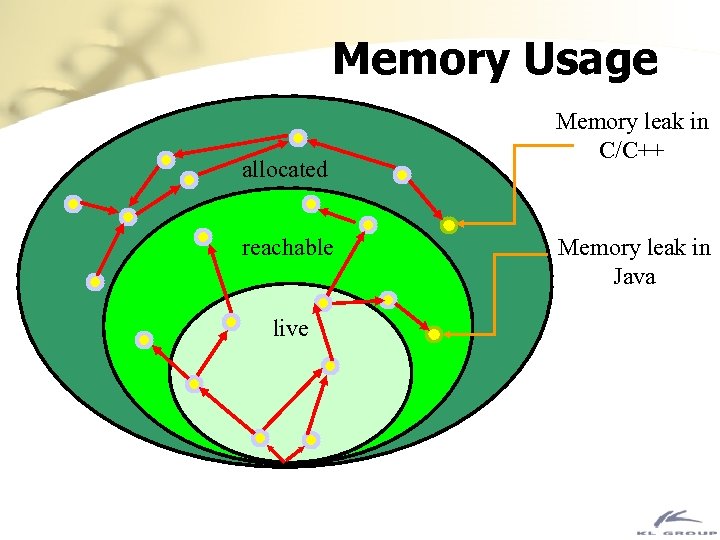 Memory Usage allocated reachable live Memory leak in C/C++ Memory leak in Java
 Measuring Performance • How can use determine whether changes you’ve made to improve performance have had any effect? • There are two types of performance measurement: – Load Testing – Profiling
 Load Testing • Load testing is a “black box” way of measuring performance, especially for servlets • Load testing simulates the load of multiple users accessing the servlet/JSP simultaneously • Gives a reasonable picture of the user’s actual experience • Doesn’t show where the problem is occurring
 Load Testing • There’s a free tool available (from Apache) called Apache JMeter that does load testing – http: //java. apache. org • There are plenty of commercial load testing tools: – Velo. Meter (http: //www. velometer. com) – Silk. Performer (http: //www. segue. com) – Load. Runner (http: //www. merc-int. com)
 Profiling • Profiling is a “white box” way of seeing what your code is doing • Profiling measures individual methods or lines of code and tells you how much time is spent in each • This allows you to quickly find the pieces of code that you need to change • It doesn’t always correlate with the overall user experience
 JVMPI • To allow developer to get detailed profiling data from the VM, most Java 2 compatible VMs implement the JVM Profiling Interface (JVMPI) – see http: //java. sun. com/products/jdk/1. 3/docs/guide/jvmpi • JVMPI provides calls into a native dll/shared library whenever certain events happen – method enter & exit – object alloc & free – many others
 JVMPI • There’s an example of creating your own JVMPI-based profiling engine at http: //www. ddj. com/articles/1999/9909 k/9909 k. htm • If you don’t want to write a lot of JVMPI code, the Sun VM supports creating profiling data in a text file – Use java -classic -Xrunhprof for the classic VM – Use java -Xprof for the Hot. Spot VM
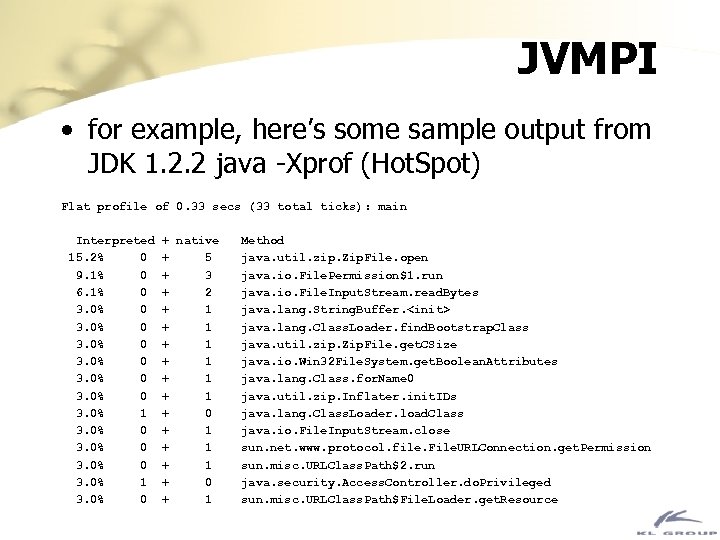 JVMPI • for example, here’s some sample output from JDK 1. 2. 2 java -Xprof (Hot. Spot) Flat profile of 0. 33 secs (33 total ticks): main Interpreted 15. 2% 0 9. 1% 0 6. 1% 0 3. 0% 0 3. 0% 1 3. 0% 0 + native + 5 + 3 + 2 + 1 + 1 + 1 + 0 + 1 Method java. util. zip. Zip. File. open java. io. File. Permission$1. run java. io. File. Input. Stream. read. Bytes java. lang. String. Buffer.
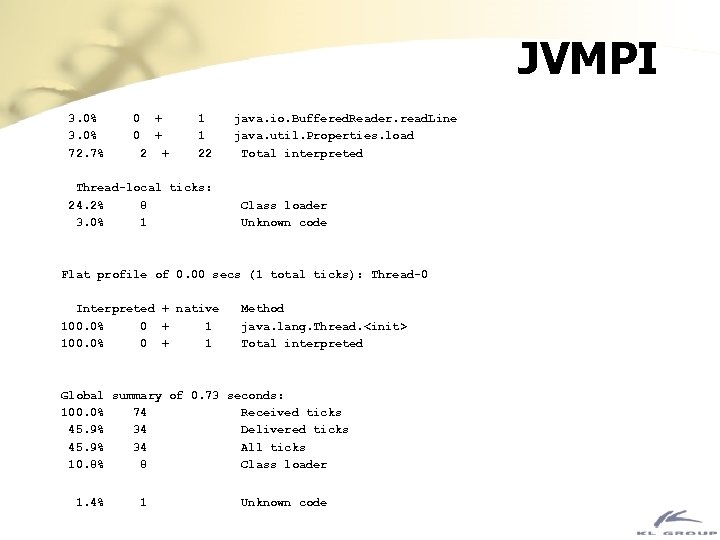 JVMPI 3. 0% 72. 7% 0 0 + + 2 + 1 1 22 Thread-local ticks: 24. 2% 8 3. 0% 1 java. io. Buffered. Reader. read. Line java. util. Properties. load Total interpreted Class loader Unknown code Flat profile of 0. 00 secs (1 total ticks): Thread-0 Interpreted + native 100. 0% 0 + 1 Method java. lang. Thread.
 References • Larman and Guthrie, Java 2 Performance and idiom Guide, Prentice Hall PTR, 2000 • Haggar, Peter, Practical Java. Addison. Wesley, 2000 • Henry and Lycklama, How Do You Plug Java Memory Leaks? in Dr. Dobb’s Journal, February 2000. Online at: http: //www. ddj. com/articles/2000/0002 l/0002 l. htm
 Questions?
 Fin • Check out JProbe at: http: //www. klgroup. com/jprobe • Contact me at: egh@klgroup. com


