e26f63d016bea0ab95b81db6740053b9.ppt
- Количество слайдов: 60
 Performance Technology for Complex Parallel Systems Sameer Shende University of Oregon
 Acknowledgements r r r r r Prof. Allen D. Malony (PI, U. Oregon) Bernd Mohr (NIC, Germany) Robert Ansell Bell (U. Oregon) Kathleen Lindlan (U. Oregon) Julian Cummings (Caltech) Kai Li (U. Oregon) Li Li (U. Oregon) Steve Parker (U. Utah) Dav de St. Germain (U. Utah) Alan Morris (U. Utah)
 General Problems How do we create robust and ubiquitous performance technology for the analysis and tuning of parallel and distributed software and systems in the presence of (evolving) complexity challenges? How do we apply performance technology effectively for the variety and diversity of performance problems that arise in the context of complex parallel and distributed computer systems.
 Computation Model for Performance Technology r How to address dual performance technology goals? ¦ ¦ ¦ r Robust capabilities + widely available methodologies Contend with problems of system diversity Flexible tool composition/configuration/integration Approaches ¦ Restrict computation types / performance problems Ø limited ¦ performance technology coverage Base technology on abstract computation model Ø general architecture and software execution features Ø map features/methods to existing complex system types Ø develop capabilities that can adapt and be optimized
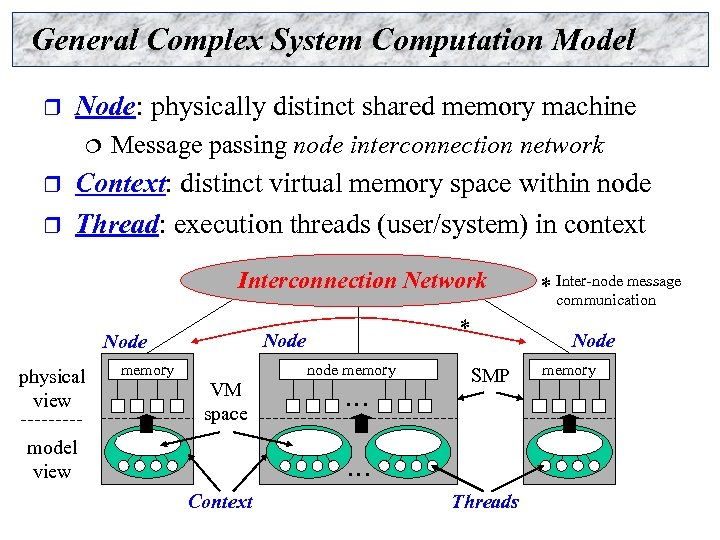 General Complex System Computation Model r Node: physically distinct shared memory machine ¦ r r Message passing node interconnection network Context: distinct virtual memory space within node Thread: execution threads (user/system) in context Interconnection Network physical view memory * Node VM space model view node memory … Node SMP … Context * Inter-node message communication Threads memory
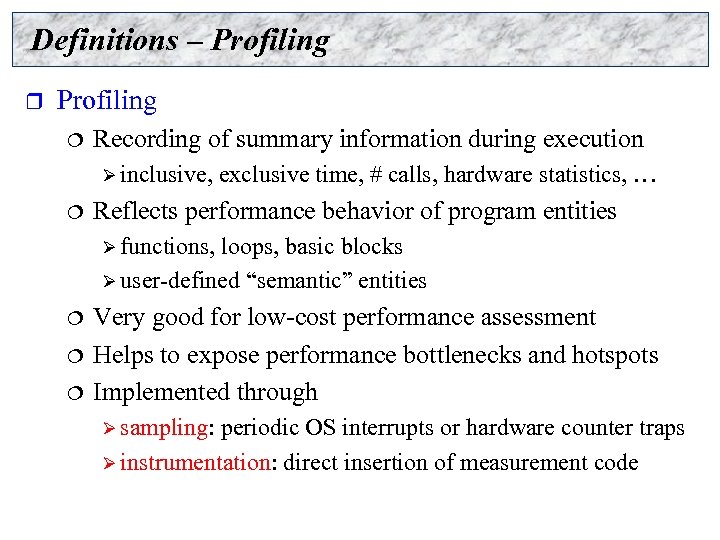 Definitions – Profiling r Profiling ¦ Recording of summary information during execution Ø inclusive, ¦ exclusive time, # calls, hardware statistics, … Reflects performance behavior of program entities Ø functions, loops, basic blocks Ø user-defined “semantic” entities ¦ ¦ ¦ Very good for low-cost performance assessment Helps to expose performance bottlenecks and hotspots Implemented through Ø sampling: periodic OS interrupts or hardware counter traps Ø instrumentation: direct insertion of measurement code
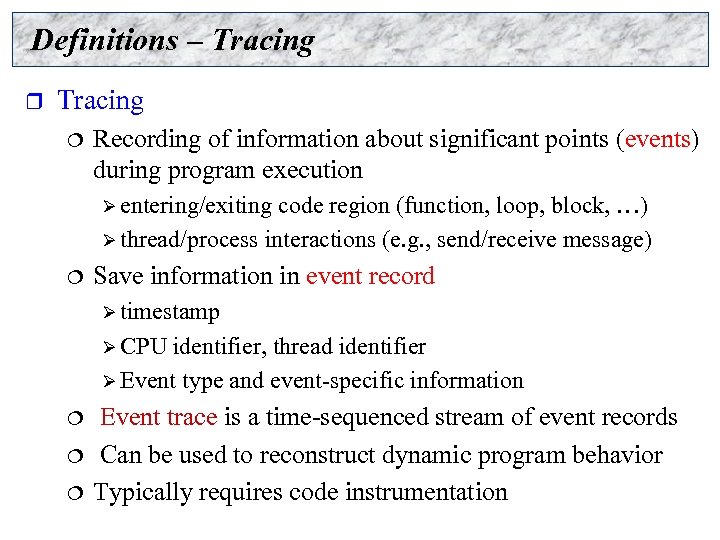 Definitions – Tracing r Tracing ¦ Recording of information about significant points (events) during program execution Ø entering/exiting code region (function, loop, block, …) Ø thread/process interactions (e. g. , send/receive message) ¦ Save information in event record Ø timestamp Ø CPU identifier, thread identifier Ø Event type and event-specific information ¦ ¦ ¦ Event trace is a time-sequenced stream of event records Can be used to reconstruct dynamic program behavior Typically requires code instrumentation
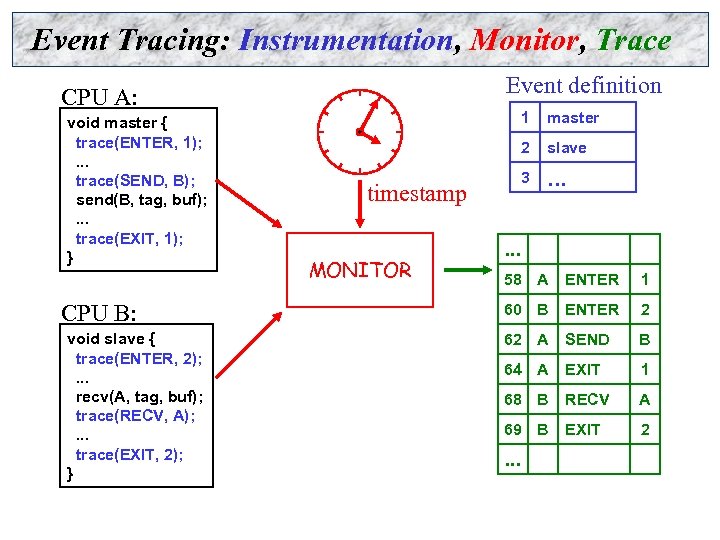 Event Tracing: Instrumentation, Monitor, Trace Event definition CPU A: void master { trace(ENTER, 1); . . . trace(SEND, B); send(B, tag, buf); . . . trace(EXIT, 1); } CPU B: void slave { trace(ENTER, 2); . . . recv(A, tag, buf); trace(RECV, A); . . . trace(EXIT, 2); } 1 2 timestamp MONITOR master slave 3 . . . 58 A ENTER 1 60 B ENTER 2 62 A SEND B 64 A EXIT 1 68 B RECV A 69 B EXIT 2 . . .
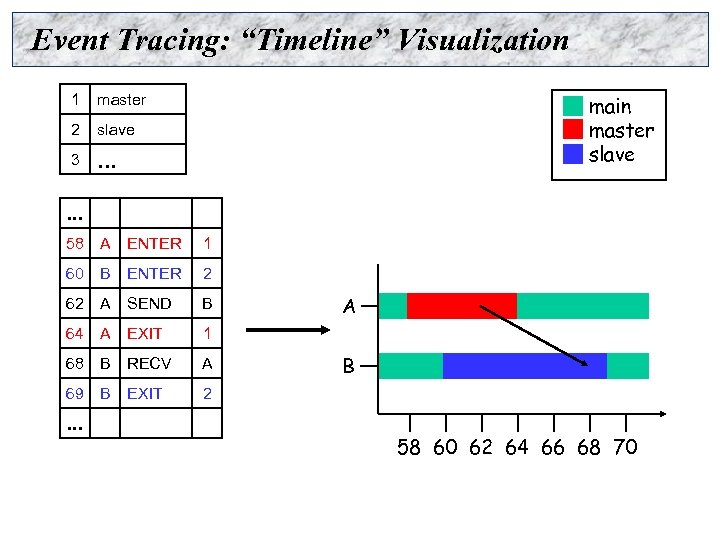 Event Tracing: “Timeline” Visualization 1 master 2 slave 3 . . . main master slave . . . 58 A ENTER 1 60 B ENTER 2 62 A SEND B 64 A EXIT 1 68 B RECV A 69 B EXIT 2 . . . A B 58 60 62 64 66 68 70
 TAU Performance System Framework r r r Tuning and Analysis Utilities Performance system framework for scalable parallel and distributed high-performance computing Targets a general complex system computation model ¦ ¦ ¦ r nodes / contexts / threads Multi-level: system / software / parallelism Measurement and analysis abstraction Integrated toolkit for performance instrumentation, measurement, analysis, and visualization ¦ ¦ Portable performance profiling/tracing facility Open software approach
 TAU Performance System Architecture
 Levels of Code Transformation r r As program information flows through stages of compilation/linking/execution, different information is accessible at different stages Each level poses different constraints and opportunities for extracting information ¦ At what level should performance instrumentation be done?
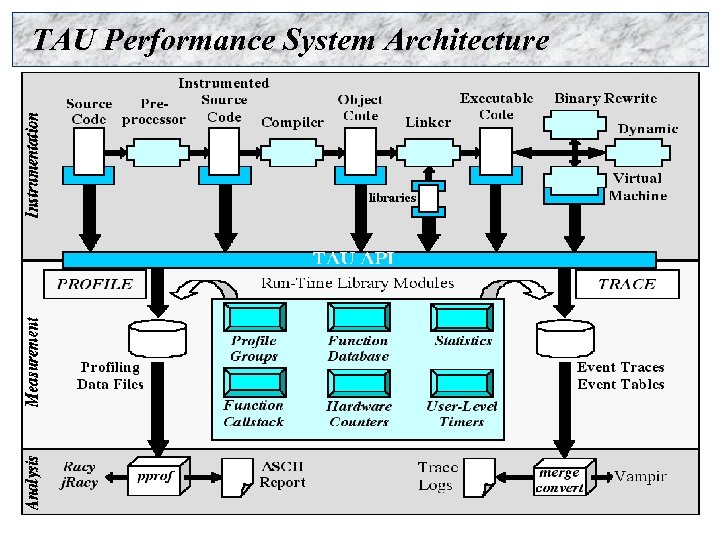
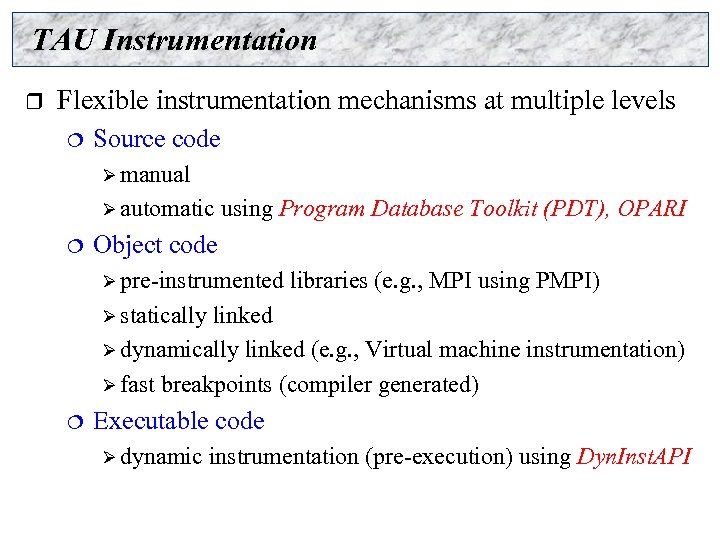 TAU Instrumentation r Flexible instrumentation mechanisms at multiple levels ¦ Source code Ø manual Ø automatic ¦ using Program Database Toolkit (PDT), OPARI Object code Ø pre-instrumented libraries (e. g. , MPI using PMPI) Ø statically linked Ø dynamically linked (e. g. , Virtual machine instrumentation) Ø fast breakpoints (compiler generated) ¦ Executable code Ø dynamic instrumentation (pre-execution) using Dyn. Inst. API
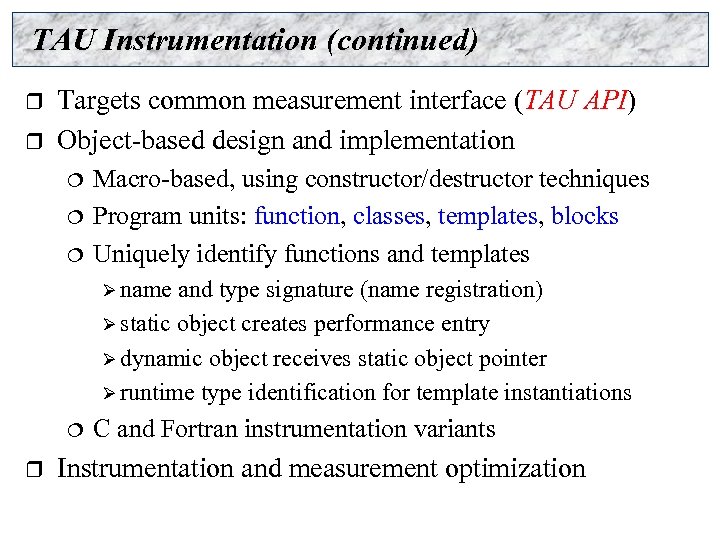 TAU Instrumentation (continued) r r Targets common measurement interface (TAU API) Object-based design and implementation ¦ ¦ ¦ Macro-based, using constructor/destructor techniques Program units: function, classes, templates, blocks Uniquely identify functions and templates Ø name and type signature (name registration) Ø static object creates performance entry Ø dynamic object receives static object pointer Ø runtime type identification for template instantiations ¦ r C and Fortran instrumentation variants Instrumentation and measurement optimization
 Multi-Level Instrumentation r r r Uses multiple instrumentation interfaces Shares information: cooperation between interfaces Taps information at multiple levels Provides selective instrumentation at each level Targets a common performance model Presents a unified view of execution
 Program Database Toolkit (PDT) r r r Program code analysis framework for developing sourcebased tools High-level interface to source code information Integrated toolkit for source code parsing, database creation, and database query ¦ ¦ ¦ r r commercial grade front end parsers portable IL analyzer, database format, and access API open software approach for tool development Target and integrate multiple source languages Use in TAU to build automated performance instrumentation tools
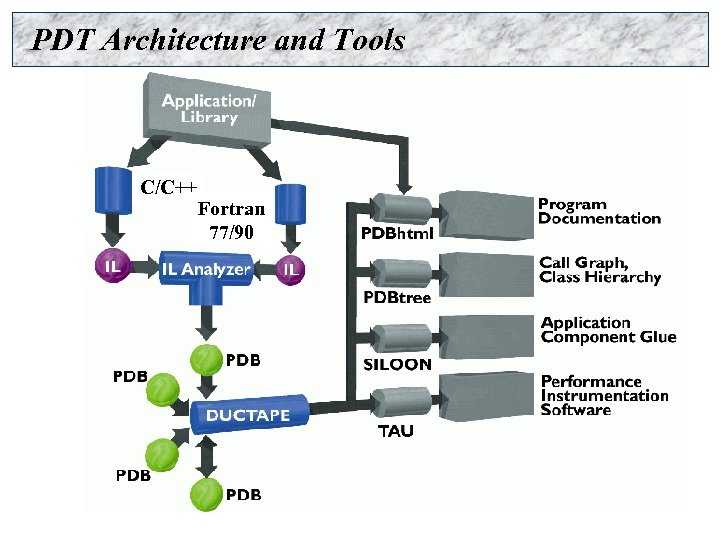 PDT Architecture and Tools C/C++ Fortran 77/90
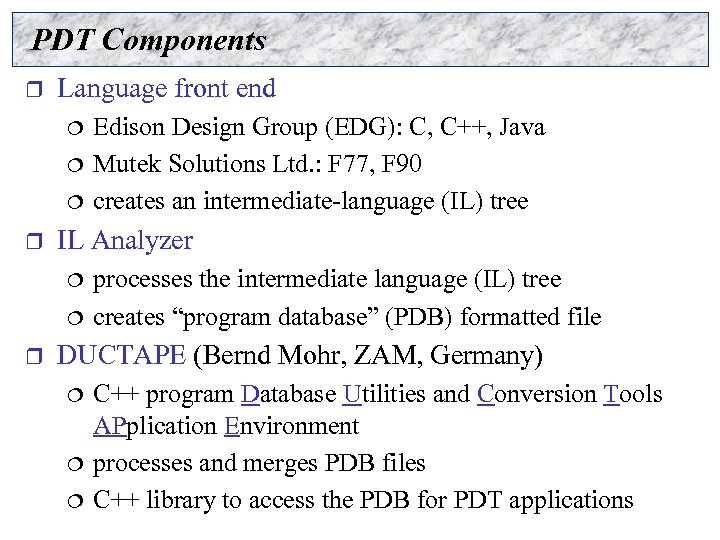 PDT Components r Language front end ¦ ¦ ¦ r IL Analyzer ¦ ¦ r Edison Design Group (EDG): C, C++, Java Mutek Solutions Ltd. : F 77, F 90 creates an intermediate-language (IL) tree processes the intermediate language (IL) tree creates “program database” (PDB) formatted file DUCTAPE (Bernd Mohr, ZAM, Germany) ¦ ¦ ¦ C++ program Database Utilities and Conversion Tools APplication Environment processes and merges PDB files C++ library to access the PDB for PDT applications
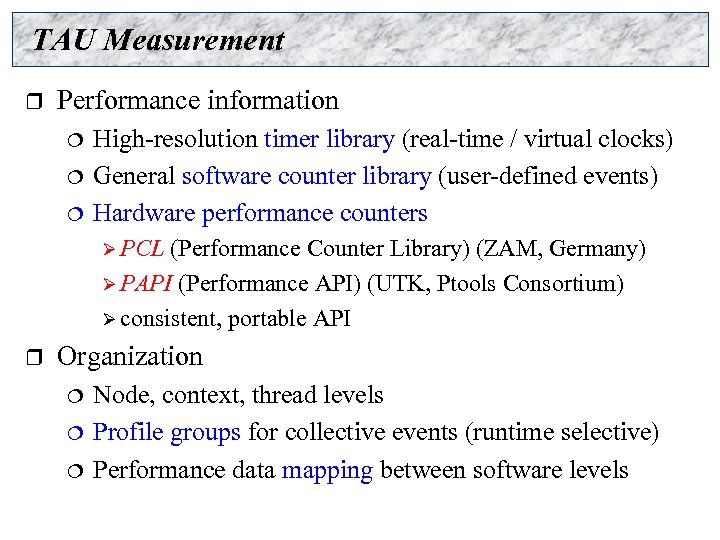 TAU Measurement r Performance information ¦ ¦ ¦ High-resolution timer library (real-time / virtual clocks) General software counter library (user-defined events) Hardware performance counters Ø PCL (Performance Counter Library) (ZAM, Germany) Ø PAPI (Performance API) (UTK, Ptools Consortium) Ø consistent, portable API r Organization ¦ ¦ ¦ Node, context, thread levels Profile groups for collective events (runtime selective) Performance data mapping between software levels
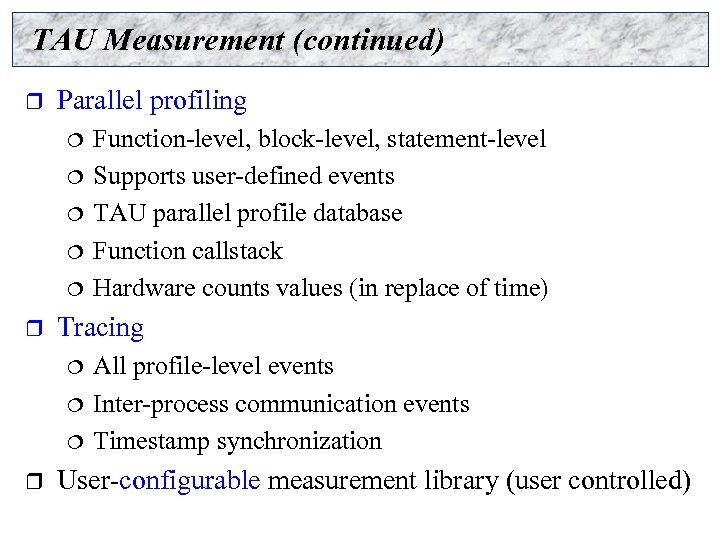 TAU Measurement (continued) r Parallel profiling ¦ ¦ ¦ r Tracing ¦ ¦ ¦ r Function-level, block-level, statement-level Supports user-defined events TAU parallel profile database Function callstack Hardware counts values (in replace of time) All profile-level events Inter-process communication events Timestamp synchronization User-configurable measurement library (user controlled)
![TAU Measurement System Configuration r configure [OPTIONS] {-c++=<CC>, -cc=<cc>} Specify C++ and C compilers TAU Measurement System Configuration r configure [OPTIONS] {-c++=<CC>, -cc=<cc>} Specify C++ and C compilers](https://present5.com/presentation/e26f63d016bea0ab95b81db6740053b9/image-21.jpg) TAU Measurement System Configuration r configure [OPTIONS] {-c++=
TAU Measurement System Configuration r configure [OPTIONS] {-c++=
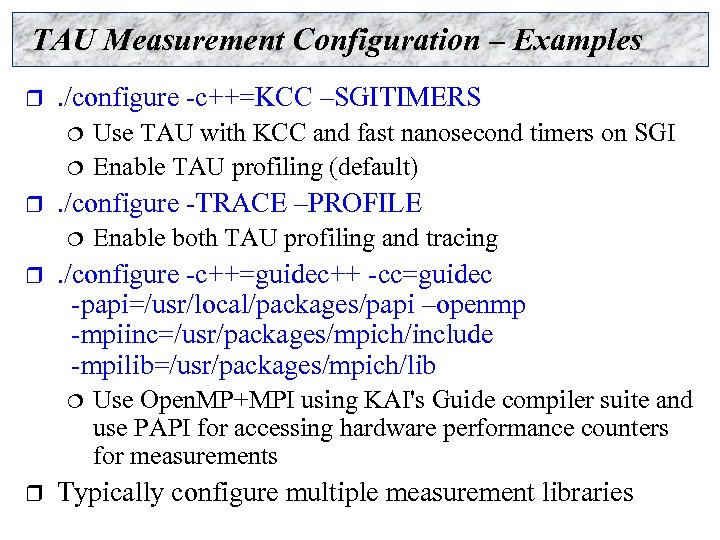 TAU Measurement Configuration – Examples r . /configure -c++=KCC –SGITIMERS ¦ ¦ r . /configure -TRACE –PROFILE ¦ r Enable both TAU profiling and tracing . /configure -c++=guidec++ -cc=guidec -papi=/usr/local/packages/papi –openmp -mpiinc=/usr/packages/mpich/include -mpilib=/usr/packages/mpich/lib ¦ r Use TAU with KCC and fast nanosecond timers on SGI Enable TAU profiling (default) Use Open. MP+MPI using KAI's Guide compiler suite and use PAPI for accessing hardware performance counters for measurements Typically configure multiple measurement libraries
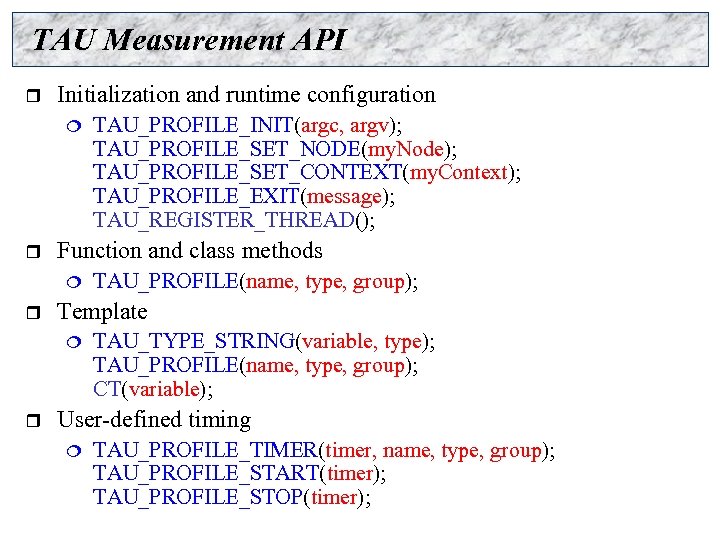 TAU Measurement API r Initialization and runtime configuration ¦ r Function and class methods ¦ r TAU_PROFILE(name, type, group); Template ¦ r TAU_PROFILE_INIT(argc, argv); TAU_PROFILE_SET_NODE(my. Node); TAU_PROFILE_SET_CONTEXT(my. Context); TAU_PROFILE_EXIT(message); TAU_REGISTER_THREAD(); TAU_TYPE_STRING(variable, type); TAU_PROFILE(name, type, group); CT(variable); User-defined timing ¦ TAU_PROFILE_TIMER(timer, name, type, group); TAU_PROFILE_START(timer); TAU_PROFILE_STOP(timer);
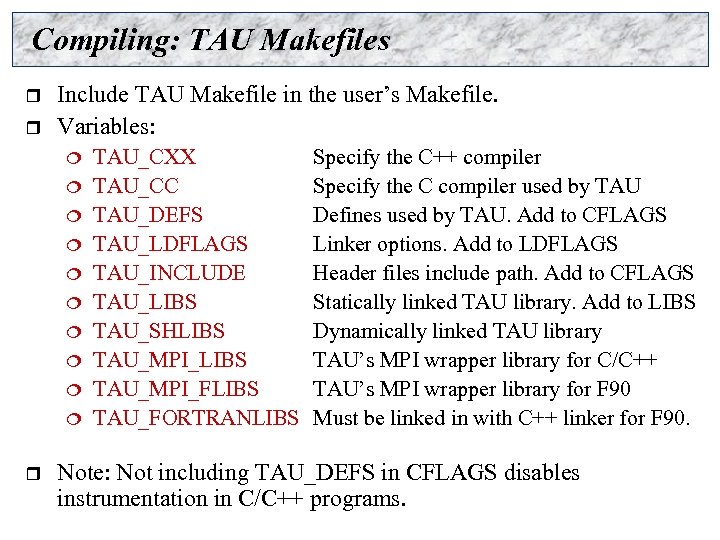 Compiling: TAU Makefiles r r Include TAU Makefile in the user’s Makefile. Variables: ¦ ¦ ¦ ¦ ¦ r TAU_CXX TAU_CC TAU_DEFS TAU_LDFLAGS TAU_INCLUDE TAU_LIBS TAU_SHLIBS TAU_MPI_FLIBS TAU_FORTRANLIBS Specify the C++ compiler Specify the C compiler used by TAU Defines used by TAU. Add to CFLAGS Linker options. Add to LDFLAGS Header files include path. Add to CFLAGS Statically linked TAU library. Add to LIBS Dynamically linked TAU library TAU’s MPI wrapper library for C/C++ TAU’s MPI wrapper library for F 90 Must be linked in with C++ linker for F 90. Note: Not including TAU_DEFS in CFLAGS disables instrumentation in C/C++ programs.
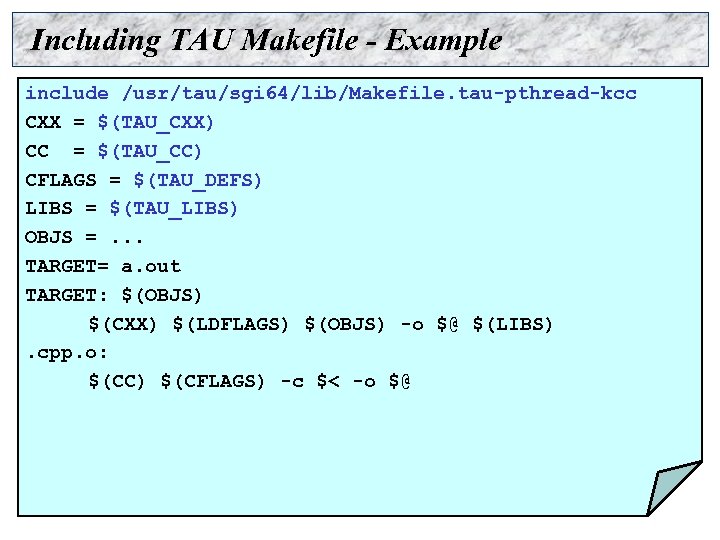 Including TAU Makefile - Example include /usr/tau/sgi 64/lib/Makefile. tau-pthread-kcc CXX = $(TAU_CXX) CC = $(TAU_CC) CFLAGS = $(TAU_DEFS) LIBS = $(TAU_LIBS) OBJS =. . . TARGET= a. out TARGET: $(OBJS) $(CXX) $(LDFLAGS) $(OBJS) -o $@ $(LIBS). cpp. o: $(CC) $(CFLAGS) -c $< -o $@
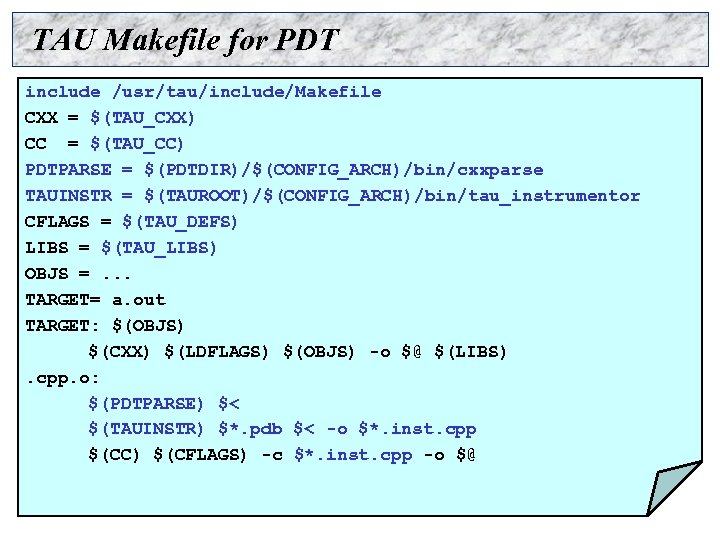 TAU Makefile for PDT include /usr/tau/include/Makefile CXX = $(TAU_CXX) CC = $(TAU_CC) PDTPARSE = $(PDTDIR)/$(CONFIG_ARCH)/bin/cxxparse TAUINSTR = $(TAUROOT)/$(CONFIG_ARCH)/bin/tau_instrumentor CFLAGS = $(TAU_DEFS) LIBS = $(TAU_LIBS) OBJS =. . . TARGET= a. out TARGET: $(OBJS) $(CXX) $(LDFLAGS) $(OBJS) -o $@ $(LIBS). cpp. o: $(PDTPARSE) $< $(TAUINSTR) $*. pdb $< -o $*. inst. cpp $(CC) $(CFLAGS) -c $*. inst. cpp -o $@
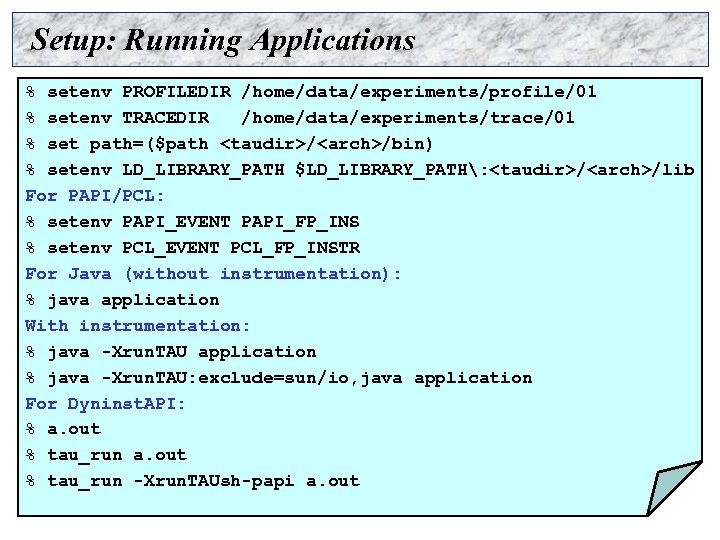 Setup: Running Applications % setenv PROFILEDIR /home/data/experiments/profile/01 % setenv TRACEDIR /home/data/experiments/trace/01 % set path=($path
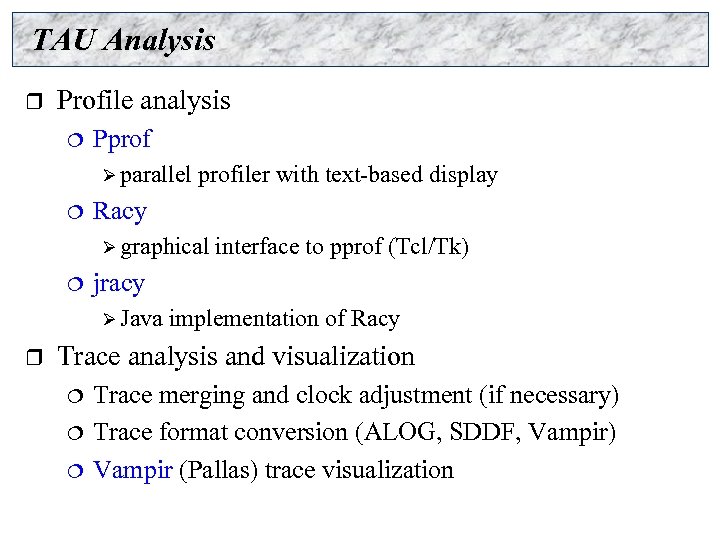 TAU Analysis r Profile analysis ¦ Pprof Ø parallel ¦ profiler with text-based display Racy Ø graphical ¦ jracy Ø Java r interface to pprof (Tcl/Tk) implementation of Racy Trace analysis and visualization ¦ ¦ ¦ Trace merging and clock adjustment (if necessary) Trace format conversion (ALOG, SDDF, Vampir) Vampir (Pallas) trace visualization
![Pprof Command r pprof [-c|-b|-m|-t|-e|-i] [-r] [-s] [-n num] [-f file] [-l] [nodes] ¦ Pprof Command r pprof [-c|-b|-m|-t|-e|-i] [-r] [-s] [-n num] [-f file] [-l] [nodes] ¦](https://present5.com/presentation/e26f63d016bea0ab95b81db6740053b9/image-29.jpg) Pprof Command r pprof [-c|-b|-m|-t|-e|-i] [-r] [-s] [-n num] [-f file] [-l] [nodes] ¦ -c Sort according to number of calls ¦ -b Sort according to number of subroutines called ¦ -m Sort according to msecs (exclusive time total) ¦ -t Sort according to total msecs (inclusive time total) ¦ -e Sort according to exclusive time per call ¦ -i Sort according to inclusive time per call ¦ -v Sort according to standard deviation (exclusive usec) ¦ -r Reverse sorting order ¦ -s Print only summary profile information ¦ -n num. Print only first number of functions ¦ -f file Specify full path and filename without node ids ¦ -l List all functions and exit
Pprof Command r pprof [-c|-b|-m|-t|-e|-i] [-r] [-s] [-n num] [-f file] [-l] [nodes] ¦ -c Sort according to number of calls ¦ -b Sort according to number of subroutines called ¦ -m Sort according to msecs (exclusive time total) ¦ -t Sort according to total msecs (inclusive time total) ¦ -e Sort according to exclusive time per call ¦ -i Sort according to inclusive time per call ¦ -v Sort according to standard deviation (exclusive usec) ¦ -r Reverse sorting order ¦ -s Print only summary profile information ¦ -n num. Print only first number of functions ¦ -f file Specify full path and filename without node ids ¦ -l List all functions and exit
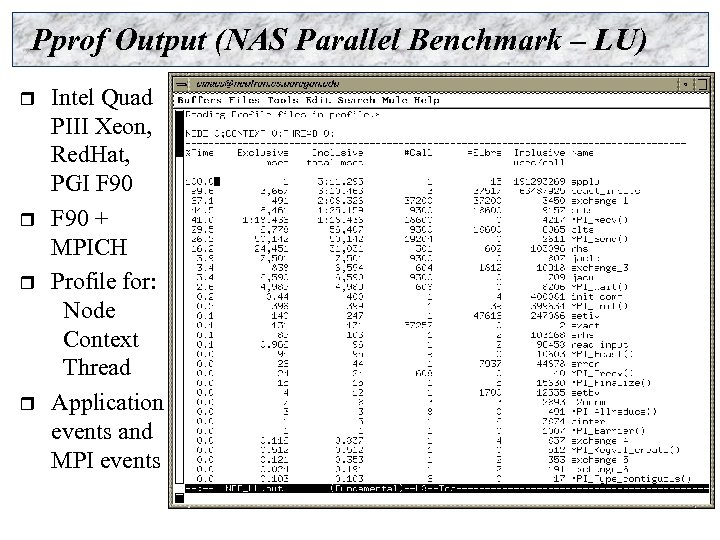 Pprof Output (NAS Parallel Benchmark – LU) r r Intel Quad PIII Xeon, Red. Hat, PGI F 90 + MPICH Profile for: Node Context Thread Application events and MPI events
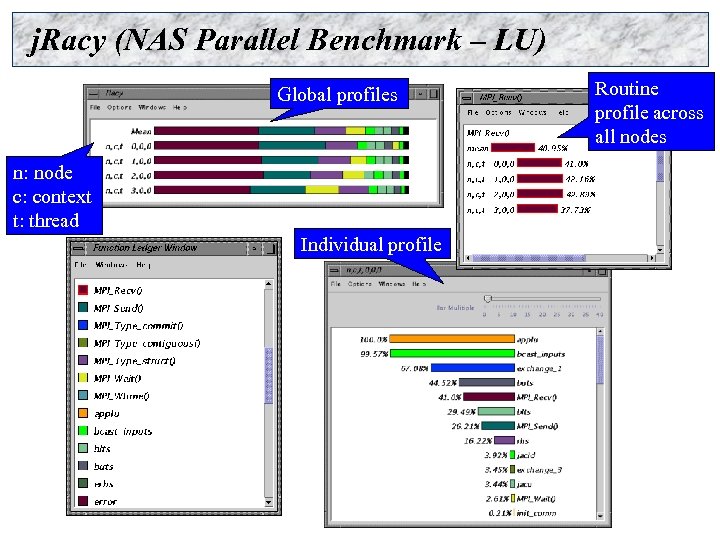 j. Racy (NAS Parallel Benchmark – LU) Global profiles n: node c: context t: thread Individual profile Routine profile across all nodes
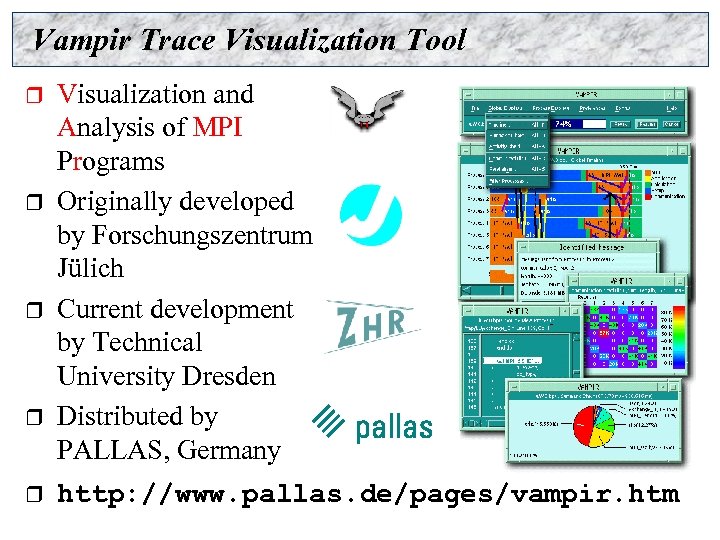 Vampir Trace Visualization Tool r r r Visualization and Analysis of MPI Programs Originally developed by Forschungszentrum Jülich Current development by Technical University Dresden Distributed by PALLAS, Germany http: //www. pallas. de/pages/vampir. htm
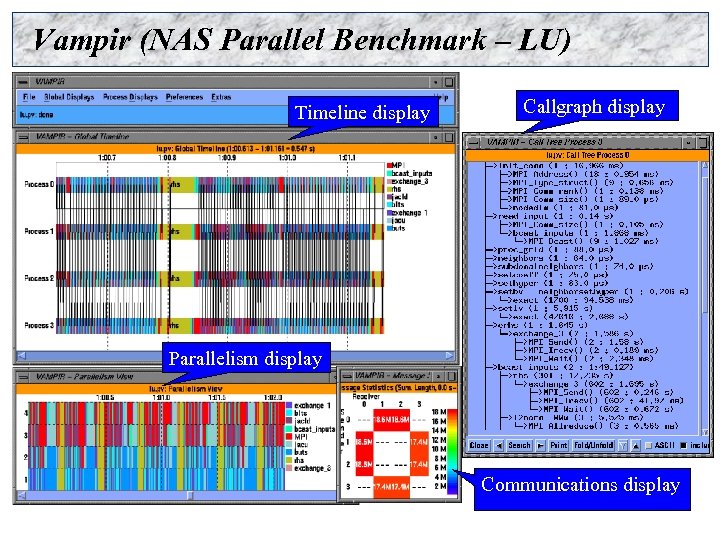 Vampir (NAS Parallel Benchmark – LU) Timeline display Callgraph display Parallelism display Communications display
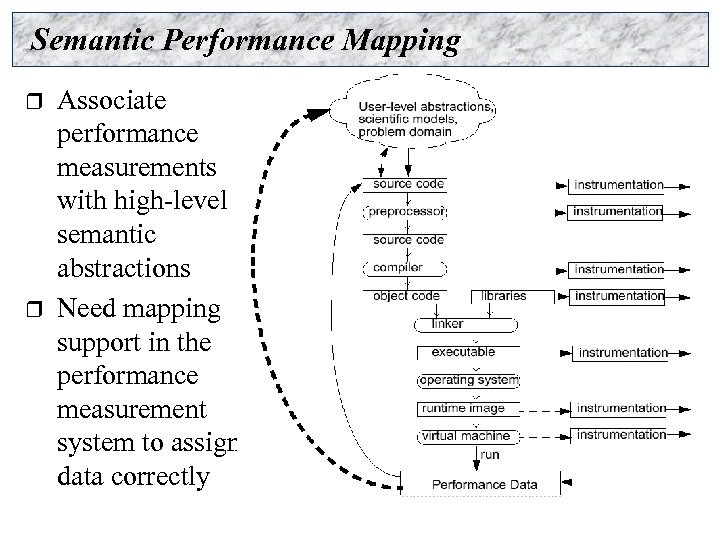 Semantic Performance Mapping r r Associate performance measurements with high-level semantic abstractions Need mapping support in the performance measurement system to assign data correctly
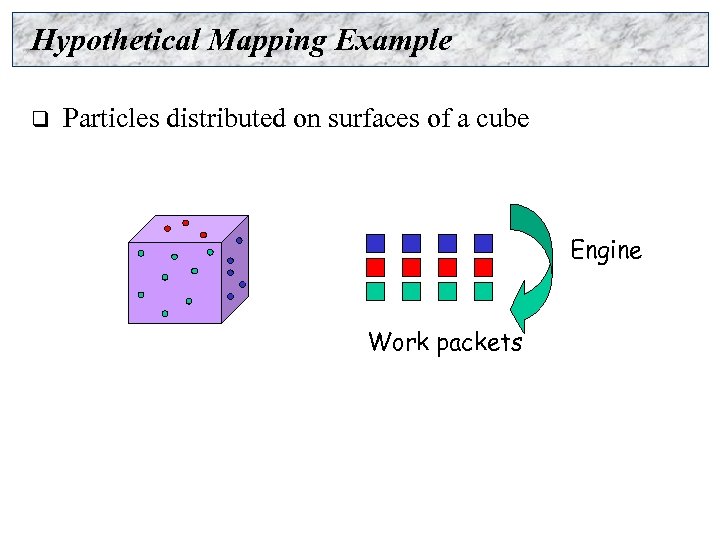 Hypothetical Mapping Example q Particles distributed on surfaces of a cube Engine Work packets
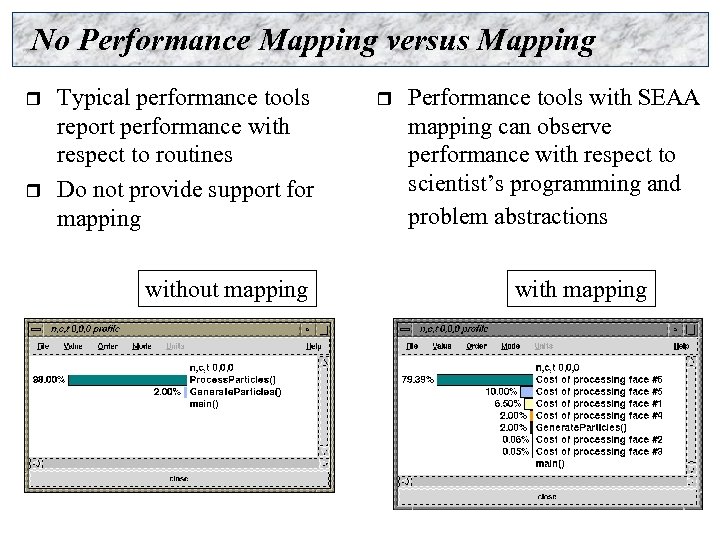 No Performance Mapping versus Mapping r r Typical performance tools report performance with respect to routines Do not provide support for mapping without mapping r Performance tools with SEAA mapping can observe performance with respect to scientist’s programming and problem abstractions with mapping
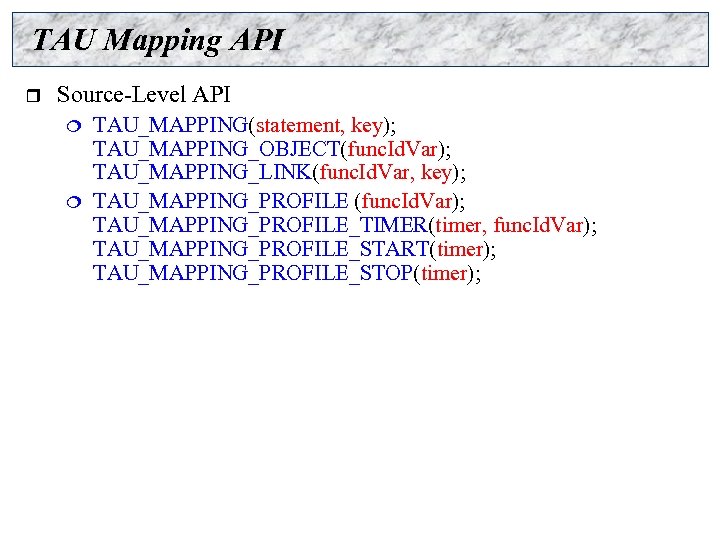 TAU Mapping API r Source-Level API ¦ ¦ TAU_MAPPING(statement, key); TAU_MAPPING_OBJECT(func. Id. Var); TAU_MAPPING_LINK(func. Id. Var, key); TAU_MAPPING_PROFILE (func. Id. Var); TAU_MAPPING_PROFILE_TIMER(timer, func. Id. Var); TAU_MAPPING_PROFILE_START(timer); TAU_MAPPING_PROFILE_STOP(timer);
 Uintah r r r U. of Utah, C-SAFE ASCI Level 1 Center Component-based framework for modeling and simulation of the interactions between hydrocarbon fires and high-energy explosives and propellants [Uintah] Work-packets belong to a higher-level task that a scientist understands ¦ e. g. , “interpolate particles to grid”
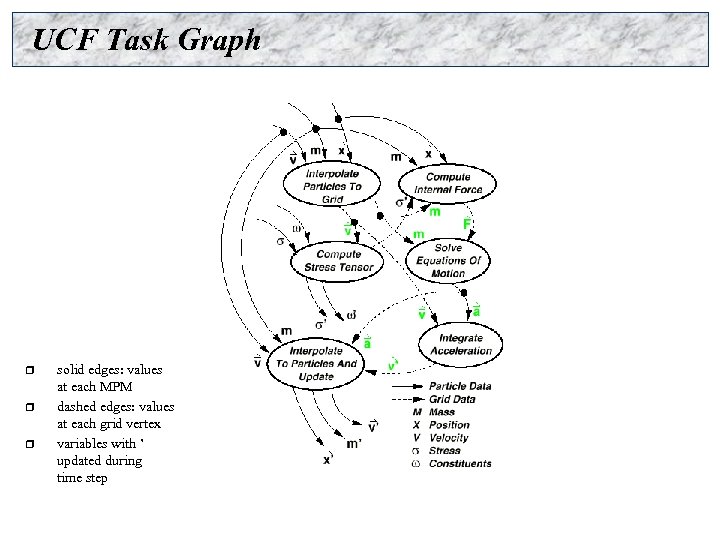 UCF Task Graph r r r solid edges: values at each MPM dashed edges: values at each grid vertex variables with ’ updated during time step
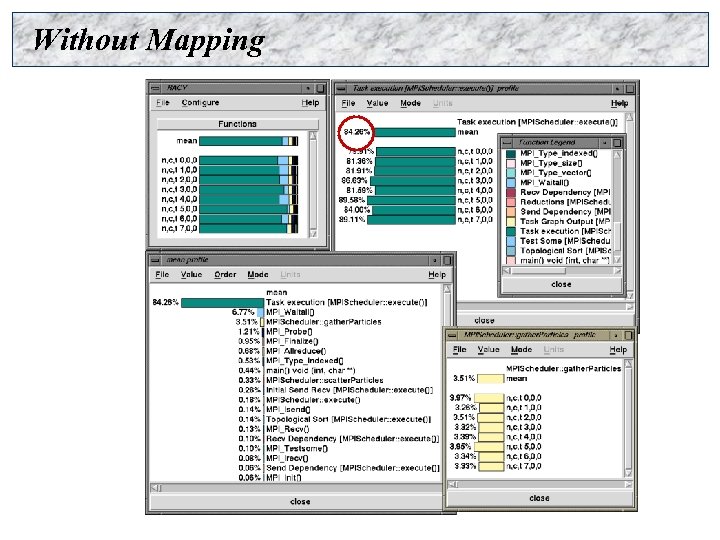 Without Mapping
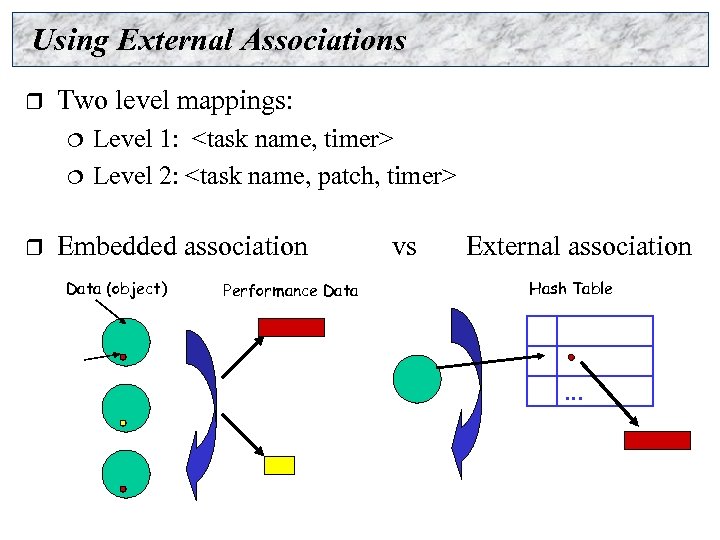 Using External Associations r Two level mappings: ¦ ¦ r Level 1:
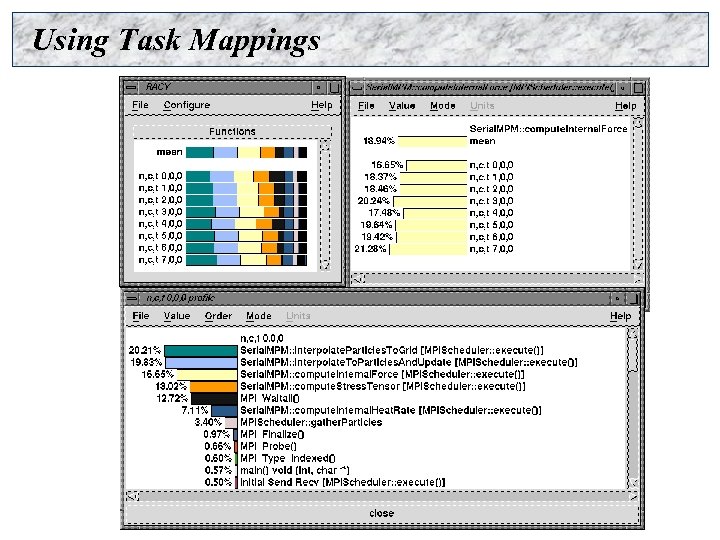 Using Task Mappings
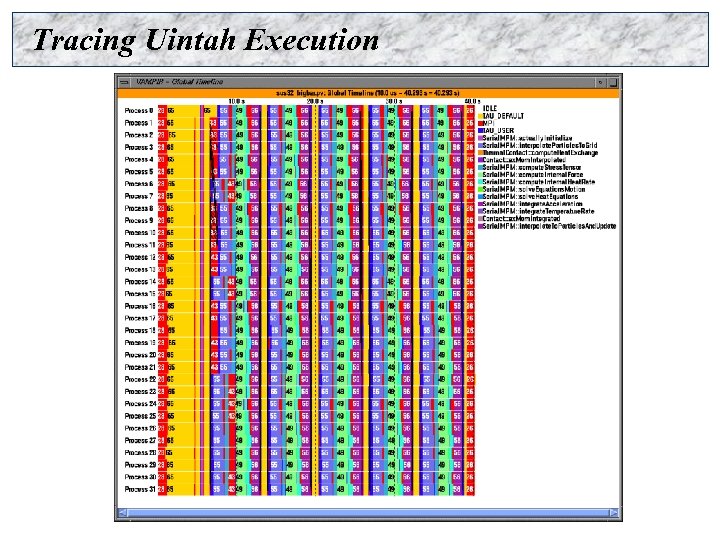 Tracing Uintah Execution
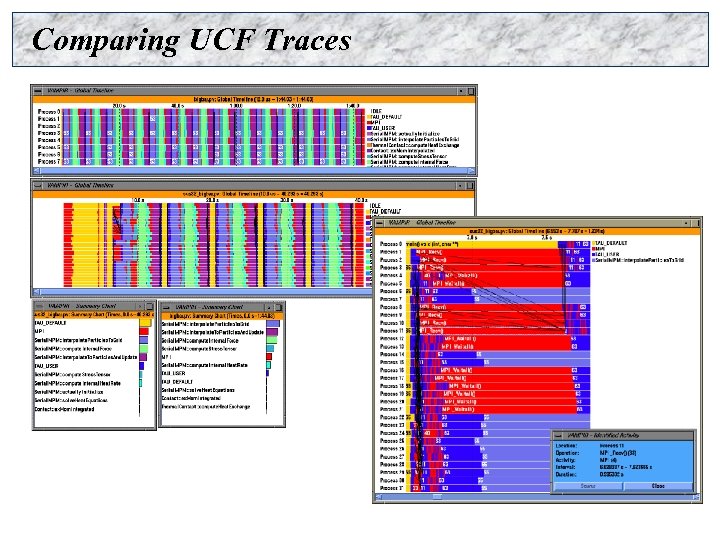 Comparing UCF Traces
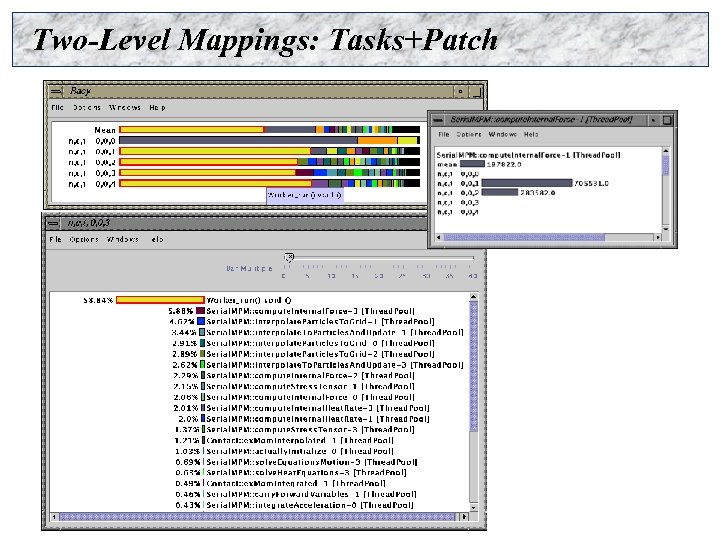 Two-Level Mappings: Tasks+Patch
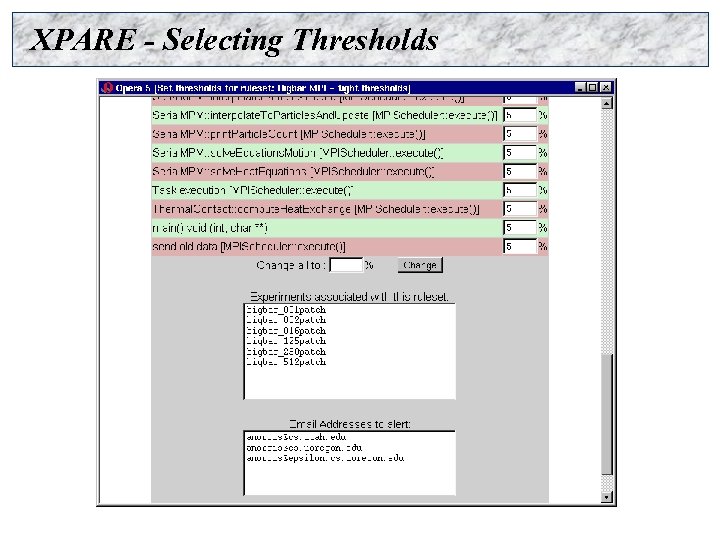
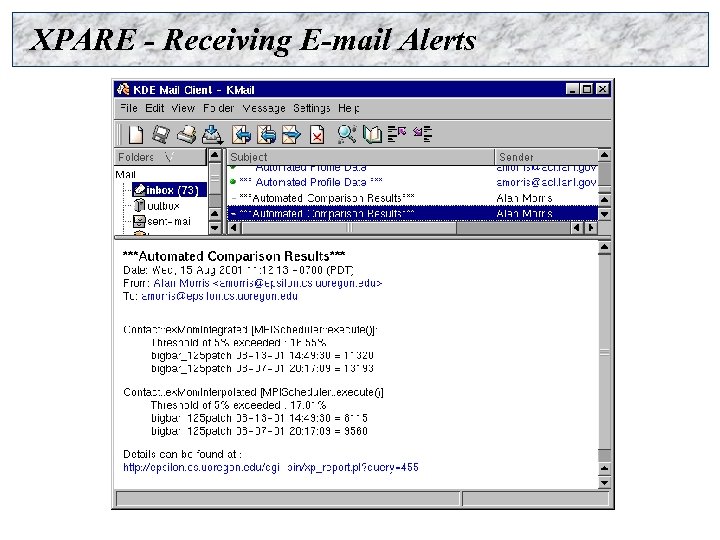
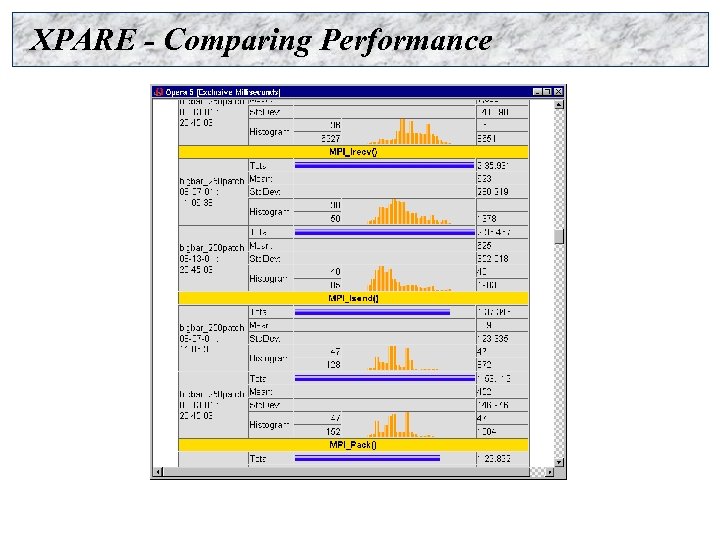
 XPARE (e. XPeriment Alerting and REporting) r r r r Regression testing benchmarks Historical performance data User-specified thresholds Experiment launcher Automatic reporting of performance problems Web-based interface Jointly developed by U. Utah and TAU group
 XPARE - Selecting Thresholds
 XPARE - Receiving E-mail Alerts
 XPARE - Comparing Performance
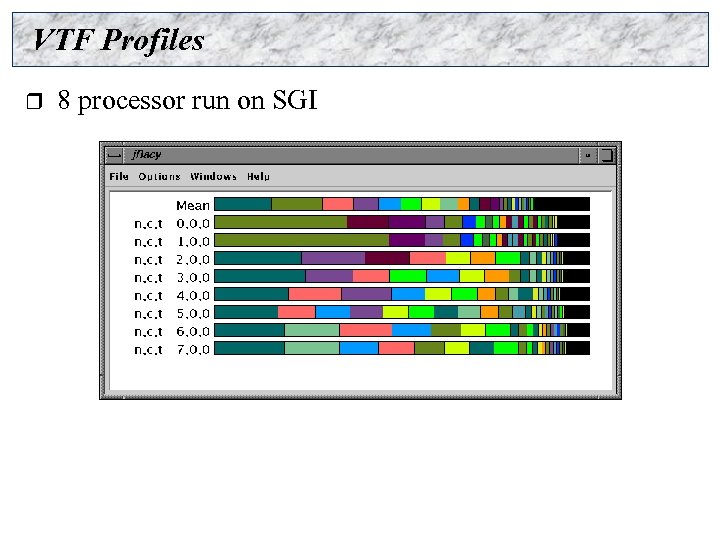
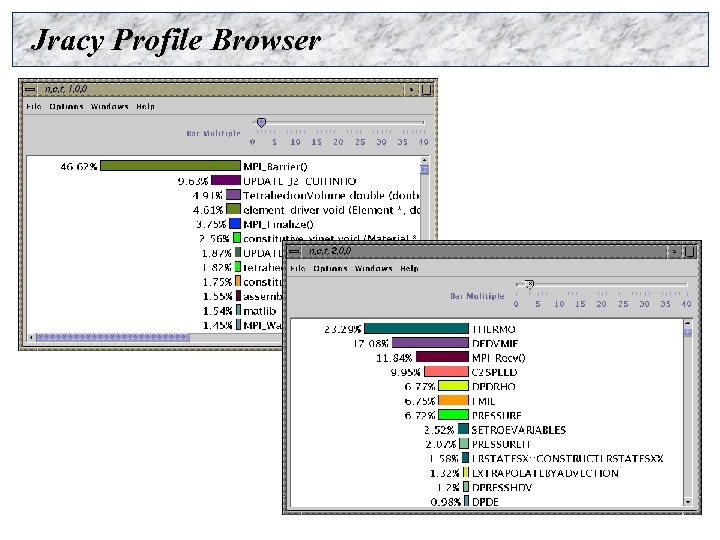
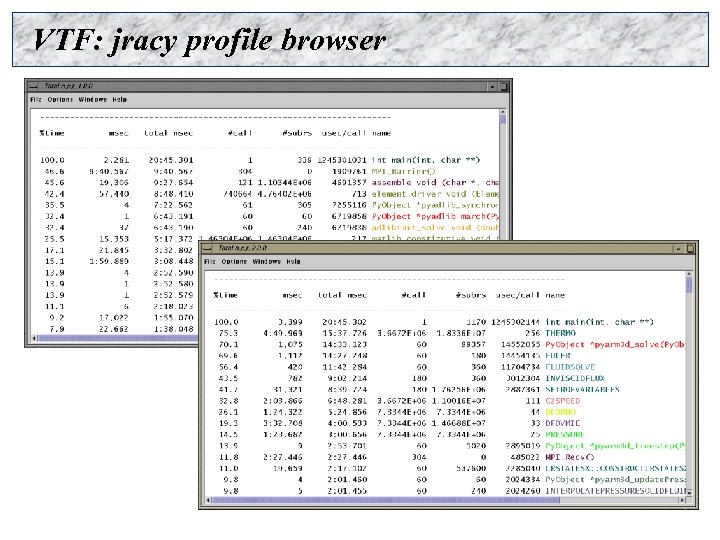
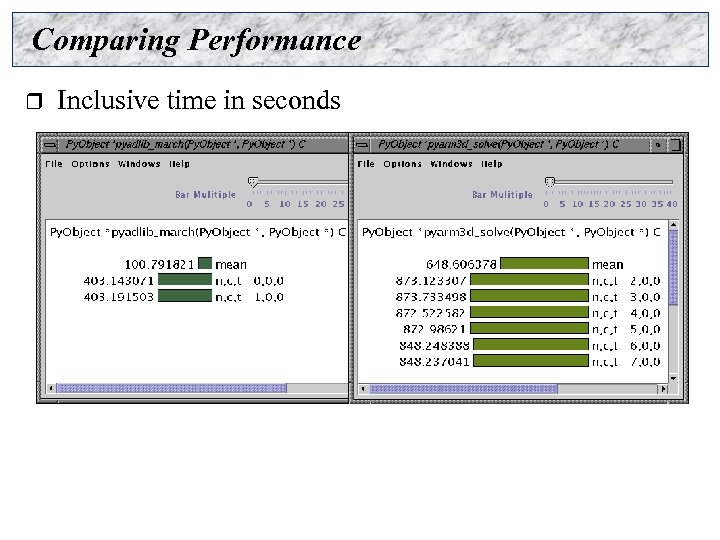
 VTF Instrumentation r r r Joint work with Julian Cummings, CACR, Caltech F 90, C++, Python, MPI Pre-processor (PDT) and MPI library instrumentation Automatic instrumentation Portable (Linux, SGI, IBM)
 VTF Profiles r 8 processor run on SGI
 Jracy Profile Browser
 VTF: jracy profile browser
 Comparing Performance r Inclusive time in seconds
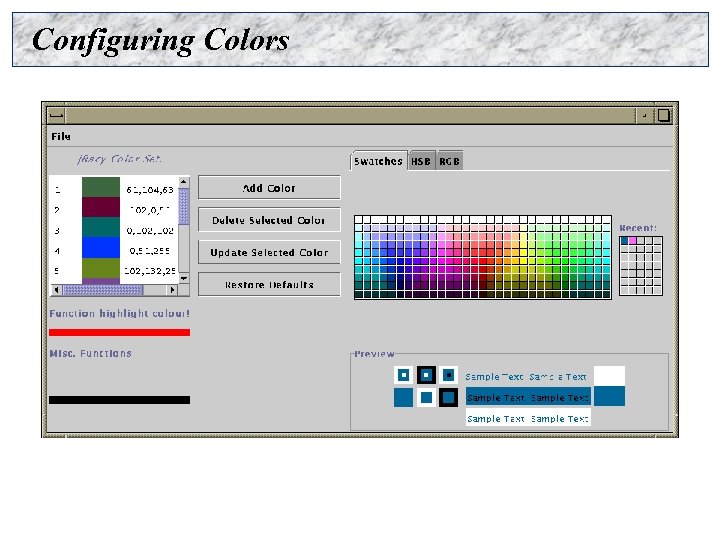 Configuring Colors
 TAU Performance System Status r Computing platforms ¦ r Programming languages ¦ r MPI, PVM, Nexus, Tulip, ACLMPL, MPIJava Thread libraries ¦ r C, C++, Fortran 77/90, HPF, Java, Open. MP Communication libraries ¦ r IBM SP, SGI Origin 2 K/3 K, Intel Teraflop, Cray T 3 E, Compaq SC, HP, Sun, Windows, IA-32, IA-64, Linux, … pthreads, Java, Windows, Tulip, SMARTS, Open. MP Compilers ¦ KAI, PGI, GNU, Fujitsu, Sun, Microsoft, SGI, Cray, IBM, Compaq
 PDT Status r Program Database Toolkit (Version 2. 0, web download) ¦ ¦ ¦ r PDT-constructed tools ¦ ¦ r EDG C++ front end (Version 2. 45. 2) Mutek Fortran 90 front end (Version 2. 4. 1) C++ and Fortran 90 IL Analyzer DUCTAPE library Standard C++ system header files (KCC Version 4. 0 f) TAU instrumentor (C/C++/F 90) Program analysis support for SILOON and CHASM Platforms ¦ SGI, IBM, Compaq, SUN, HP, Linux (IA 32/IA 64), Apple, Windows, Cray T 3 E
 Evolution of the TAU Performance System r r Customization of TAU for specific needs Future parallel computing environments need to be more adaptive to achieve and sustain high performance levels TAU’s existing strength lies in its robust support for performance instrumentation and measurement TAU will evolve to support new performance capabilities ¦ ¦ Online performance data access via application-level API Dynamic performance measurement control Generalize performance mapping Runtime performance analysis and visualization
 Information r r TAU (http: //www. acl. lanl. gov/tau) PDT (http: //www. acl. lanl. gov/pdtoolkit)
 Support Acknowledgement r TAU and PDT support: ¦ Department of Energy (DOE) Ø DOE 2000 ACTS contract Ø DOE MICS contract Ø DOE ASCI Level 3 (LANL, LLNL) Ø U. of Utah DOE ASCI Level 1 subcontract ¦ ¦ DARPA NSF National Young Investigator (NYI) award


