436dc13989c9498cd16b2c65a9d7604b.ppt
- Количество слайдов: 22
 Performance Analysis, Tools and Optimization Philip J. Mucci Kevin S. London University of Tennessee, Knoxville ARL MSRC Users’ Group Meeting September 2, 1998
 PET, UT and You • • • Training Environments Benchmarking Evaluation and Reviews Consulting Development
 Training • Courses on Benchmarking, Performance Optimization, Parallel Tools • Provides good mechanism for technology transfer • Develop needs and direction from the interaction with the user community • Tremendous knowledge base from which to draw
 Environments • Use of the MSRC environments provides – Bug reports to the vendor – System tuning – System administrator support – Analysis of software needs – Performance evaluation – Researchers access to advanced hardware
 Performance Understanding • • • In order to optimize we must understand Why is our code performing a certain way? What can be done about it? How good can we do? Results in confidence, efficiency and better code development • Time spent is an investment in the future
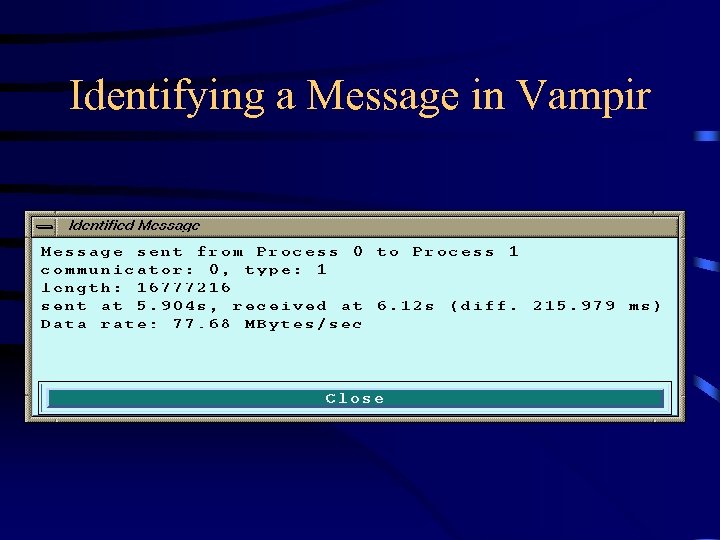
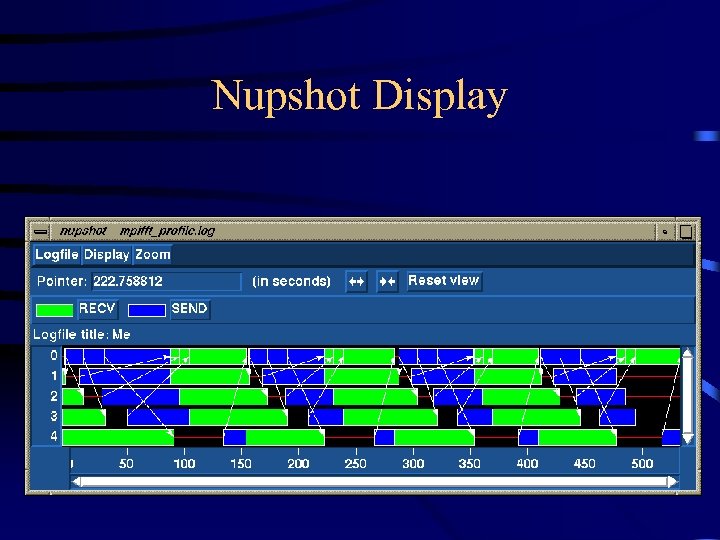
 Tool Evaluation Ptools Consortium • Review of available performance tools, particularly parallel • Regular reports are issued • Tools that we find useful get presented to the developers in training or consultation • Installation, testing and training • Example: VAMPIR for scalability analysis
 Optimization Course • Course focuses on compiler options, available tools and single processor performance • Single biggest bottleneck to many codes, especially cache performance • Why? Link speeds have increased within an order of magnitude of memory bandwidths • Also, MPI and language specific issues
 Benchmarks • Cache. Bench - performance of the memory hierarchy • MPBench - performance of core MPI operations • BLASBench - performance of dense numerical kernels • Intended to provide an orthogonal set of low -level benchmarks with which we can parameterize codes
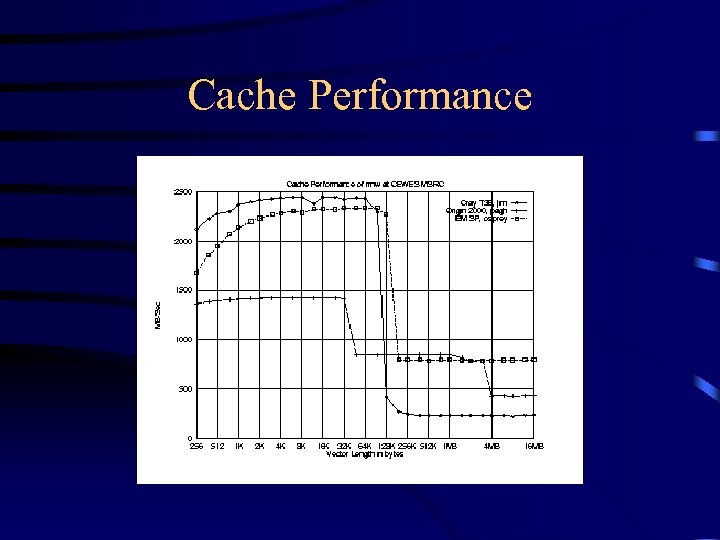 Cache Performance
 Cache Performance • Tuning for caches is difficult without some understanding of computer architecture • No way to really know what’s in the cache during a given point in an application • Factor of 2 -4 performance increase is common • Develop a tool to help identify regions in the source code, a specific reference.
 Cache Simulator • Profiling the code reveals cache problems • Automated instrumentation of offending routines via a GUI or by hand • Link with simulator library • Make architecture configuration file • Addresses are traced and simulated • Miss locations are recorded and reports are generated
 Perf. API • A standardized interface to hardware performance counters • Easily usable by application engineers as well as tool developers • Intended for – Performance tools – Evaluation – Modeling • Watch http: //www. cs. utk. edu/~mucci/pdsa
 High Performance Debugger • Industry wide lack of good debugging support for parallel programs • Total. View is expensive and GUI only • Bandwidth is often not-available off-site • Based on dbx and gdb as backends • Uses p 2 d 2 from NASA as a framework • Standardized, familiar command-line interface
 MPI Connect • Connects separate MPI jobs with PVM • 3 function calls to enroll • Uses include – Metacomputing with Vendor MPI – Dynamic and Fault Tolerant MPI jobs now
 The Future • • BYOC Workshops Regular Training Schedule Web Based Training Consulting Cross-MSRC Information Exchange Technology Transfer Tool development
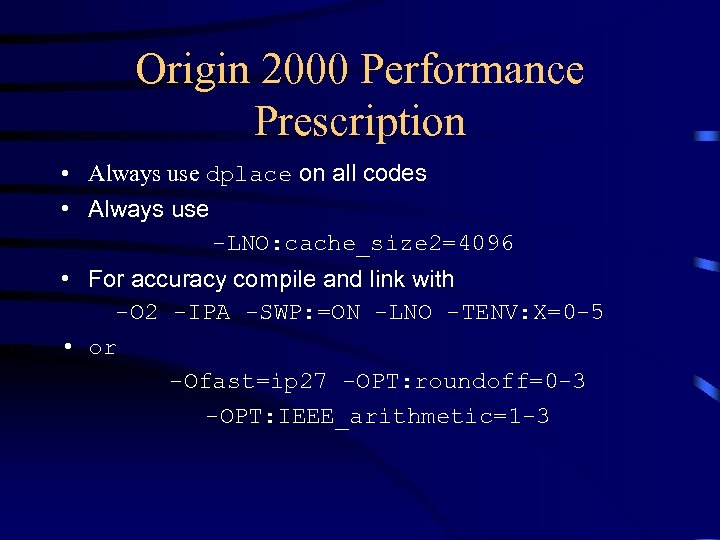 Origin 2000 Performance Prescription • Always use dplace on all codes • Always use -LNO: cache_size 2=4096 • For accuracy compile and link with -O 2 -IPA -SWP: =ON -LNO -TENV: X=0 -5 • or -Ofast=ip 27 -OPT: roundoff=0 -3 -OPT: IEEE_arithmetic=1 -3
 Origin 2000 Performance Prescription • In Fortran, innermost array index should change fastest • Use functions in -lcomplib. sgimath or -lscs -lfastm -lm • Use MPI_Ixxxx primitives • Always execute IRECV early
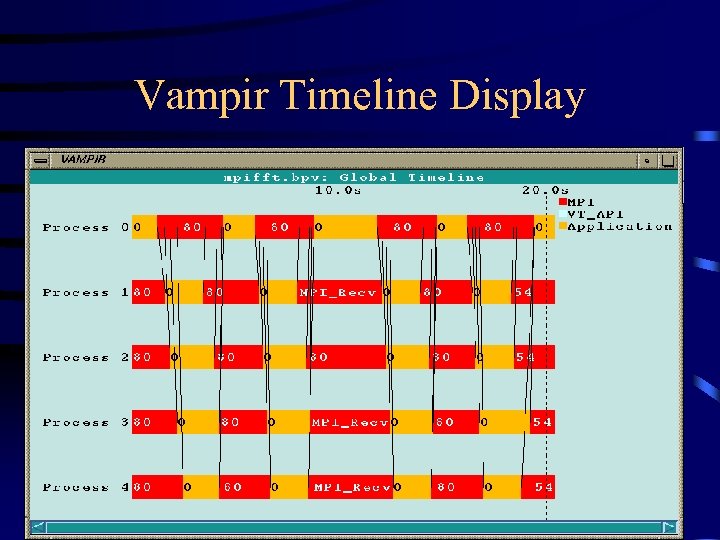 Vampir Timeline Display
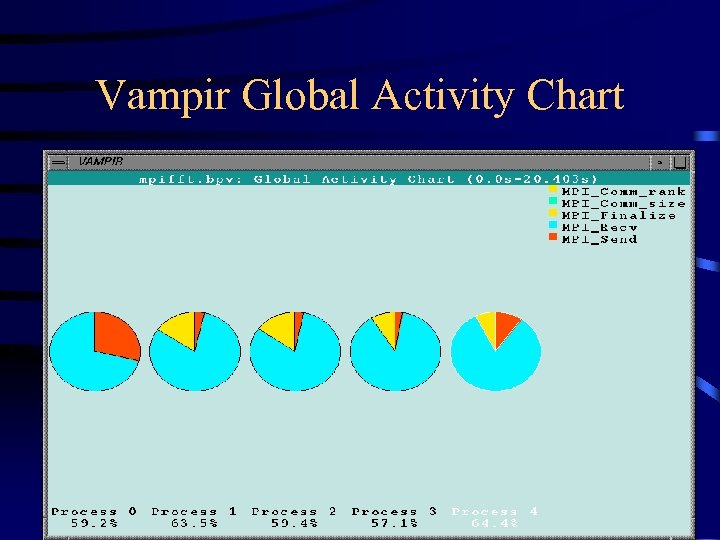 Vampir Global Activity Chart
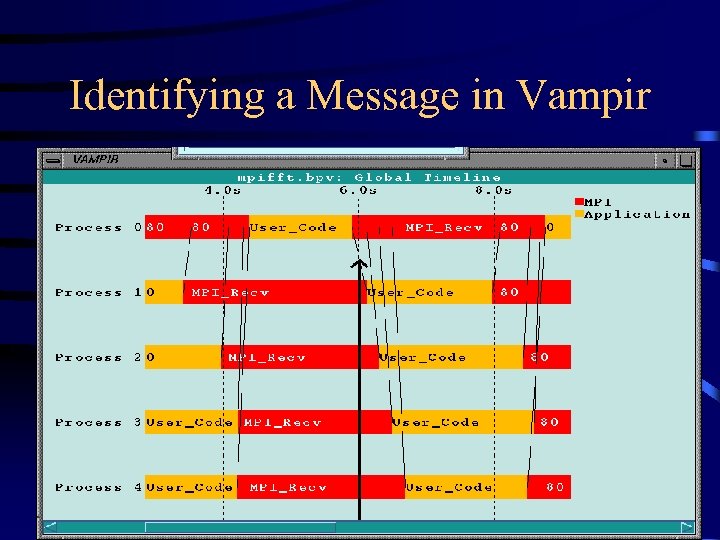 Identifying a Message in Vampir
 Identifying a Message in Vampir
 Nupshot Display


