7edd72f6c29debb6bd637a8924307c2d.ppt
- Количество слайдов: 29
 Perf. Center and Auto. Perf: Tools and Techniques for Modeling and Measurement of the Performance of Distributed Applications Varsha Apte Faculty Member, IIT Bombay 1
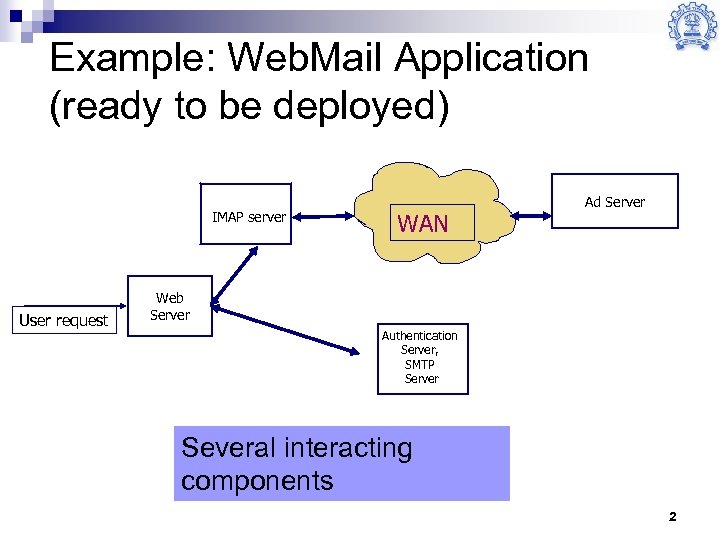 Example: Web. Mail Application (ready to be deployed) IMAP server User request WAN Ad Server Web Server Authentication Server, SMTP Server Several interacting components 2
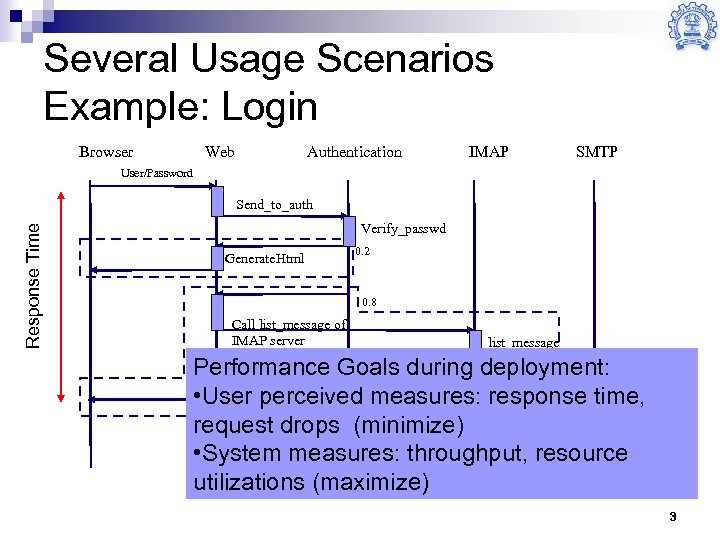 Several Usage Scenarios Example: Login Browser Web Authentication IMAP SMTP User/Password Response Time Send_to_auth Verify_passwd Generate. Html 0. 2 0. 8 Call list_message of IMAP server list_message Performance Goals during deployment: Generate. Html • User perceived measures: response time, request drops (minimize) • System measures: throughput, resource utilizations (maximize) 3
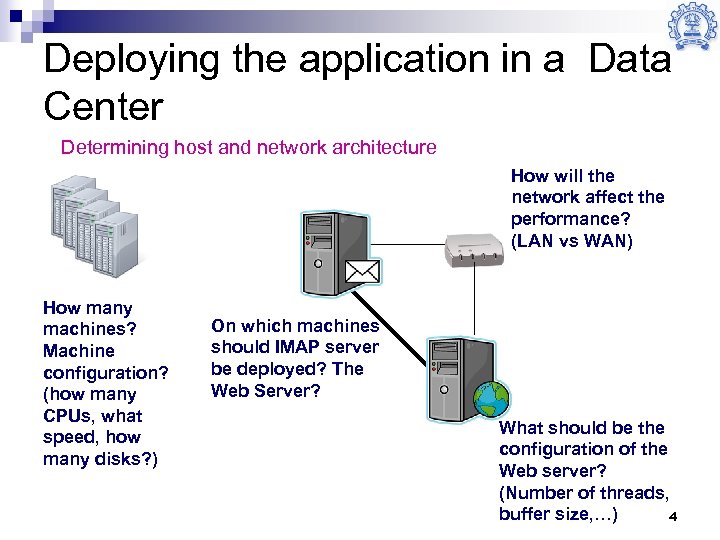 Deploying the application in a Data Center Determining host and network architecture How will the network affect the performance? (LAN vs WAN) How many machines? Machine configuration? (how many CPUs, what speed, how many disks? ) On which machines should IMAP server be deployed? The Web Server? What should be the configuration of the Web server? (Number of threads, buffer size, …) 4
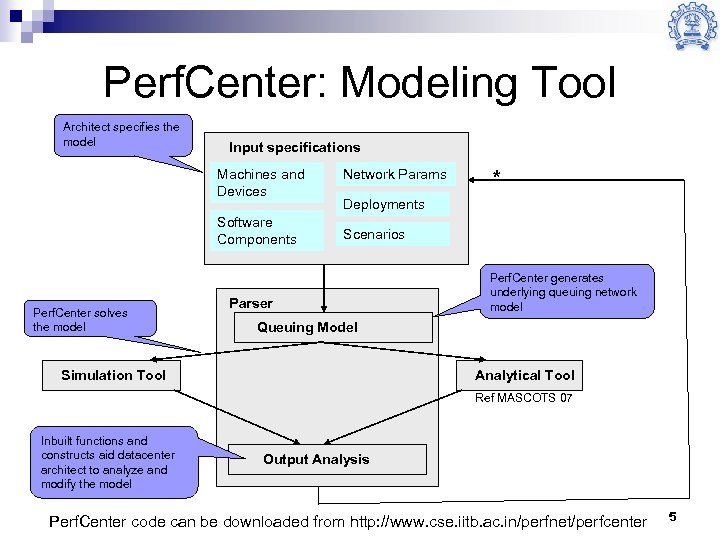 Perf. Center: Modeling Tool Architect specifies the model Input specifications Machines and Devices Software Components Perf. Center solves the model Network Params * Deployments Scenarios Parser Perf. Center generates underlying queuing network model Queuing Model Simulation Tool Analytical Tool Ref MASCOTS 07 Inbuilt functions and constructs aid datacenter architect to analyze and modify the model Output Analysis Perf. Center code can be downloaded from http: //www. cse. iitb. ac. in/perfnet/perfcenter 5
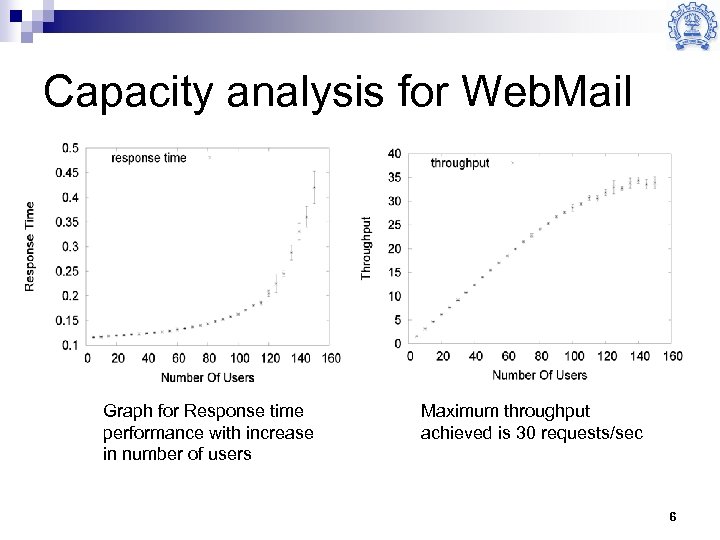 Capacity analysis for Web. Mail Graph for Response time performance with increase in number of users Maximum throughput achieved is 30 requests/sec 6
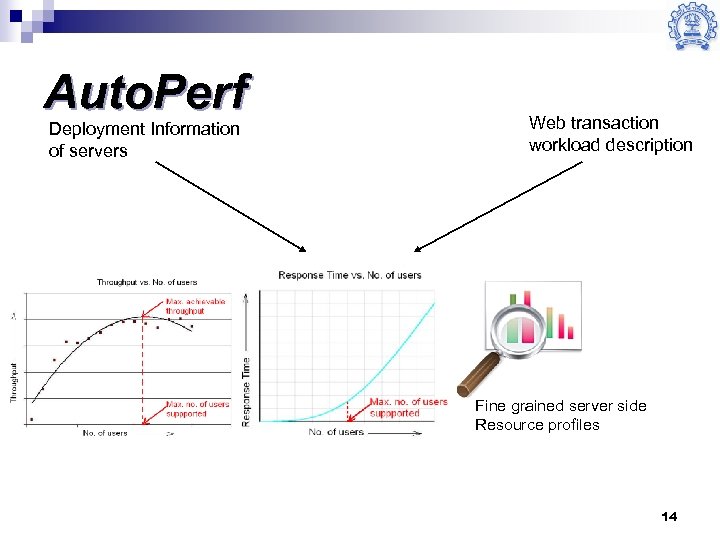
 Autoperf: a capacity measurement and profiling tool Focusing on needs of a performance modeling tool 7
 Input requirement for modeling tools Usage Scenarios n Deployment details n Resource Consumption Details – e. g. “login transaction takes 20 ms CPU on Web server” n ¨ Usually requires measured data 8
 Performance measurement of multi -tier systems Two goals: n Capacity Analysis: ¨ Maximum number of users supported, transaction rate supported, etc n Fine grained profiling for use in performance models 9
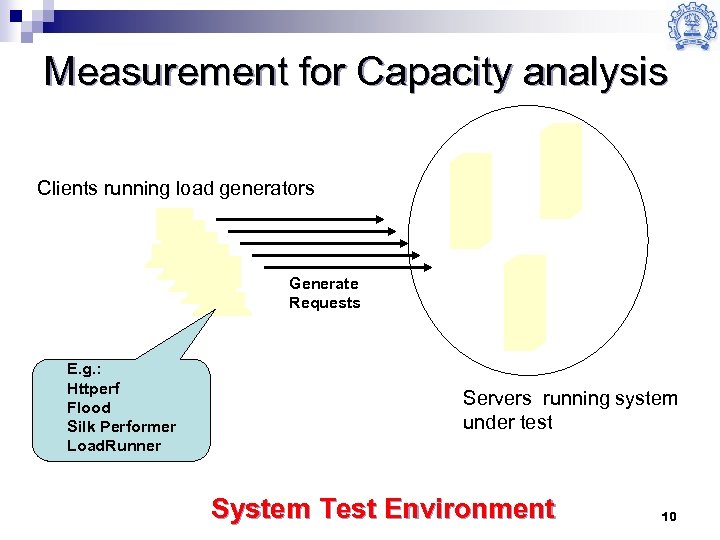 Measurement for Capacity analysis Clients running load generators Generate Requests E. g. : Httperf Flood Silk Performer Load. Runner Servers running system under test System Test Environment 10
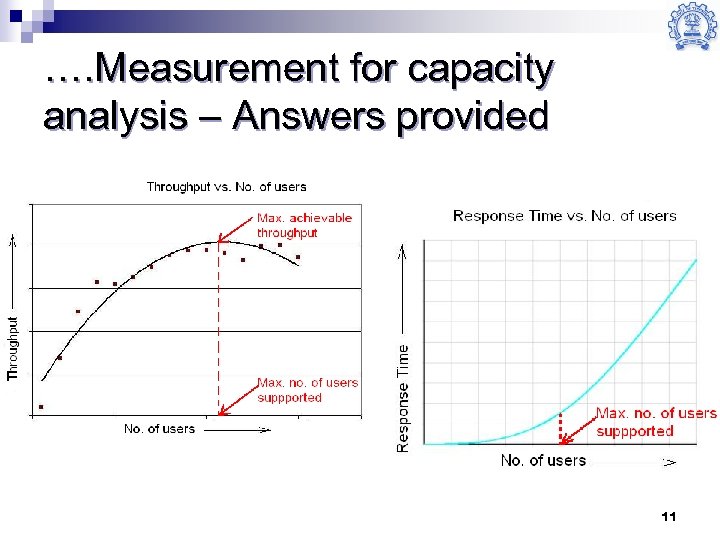 …. Measurement for capacity analysis – Answers provided 11
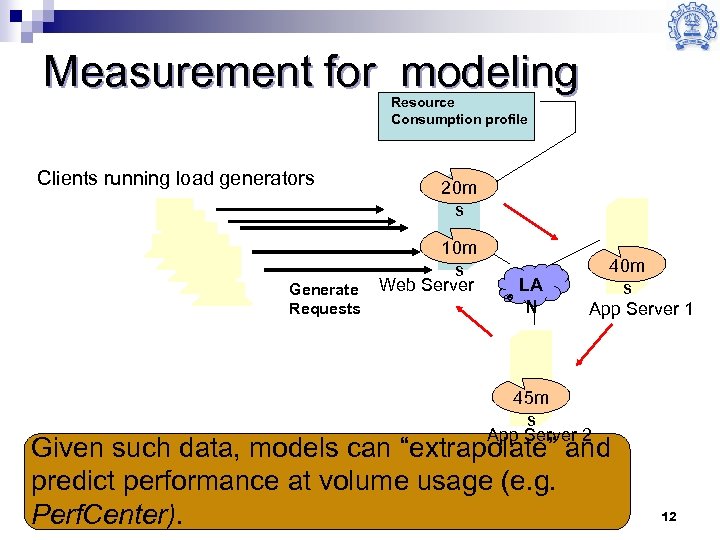 Measurement for modeling Resource Consumption profile Clients running load generators Generate Requests 20 m s 10 m s Web Server LA N 40 m s App Server 1 45 m s App Server 2 Given such data, models can “extrapolate” and predict performance at volume usage (e. g. Perf. Center). 12
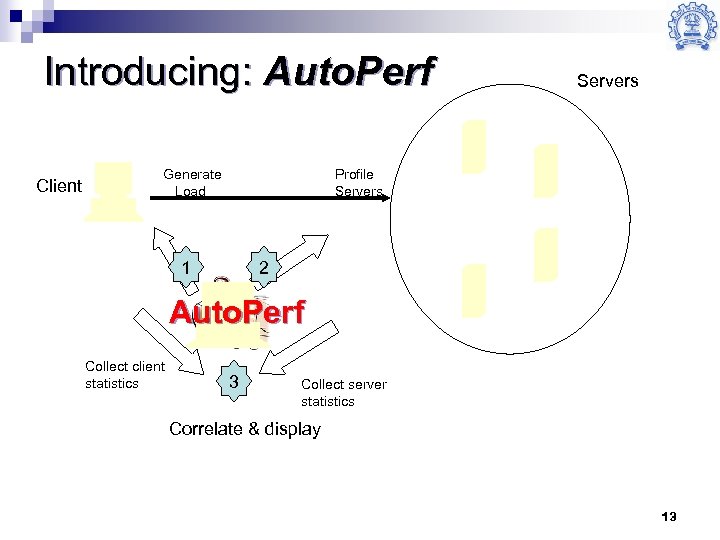 Introducing: Auto. Perf Client Generate Load Servers Profile Servers 1 2 Auto. Perf Collect client statistics 3 Collect server statistics Correlate & display 13
 Auto. Perf Deployment Information of servers Web transaction workload description Fine grained server side Resource profiles 14
 Future enhancements n Perf. Center/Auto. Perf: ¨ Various features which make the tools more user- friendly ¨ Capability to model/measure performance of virtualized data centers n n Many other minor features Skills that need to be learned/liked: ¨ Java programming (both tools are in Java) n Discipline required to maintain/improve large software ¨ Working with quantitative data 15
 What is fun about this project? Working on something that will (should) get used. n New focus on energy and virtualization – both exciting fields n Many, many, algorithmic challenges n ¨ Running simulation/measurement in efficient ways 16
 Work to be done by RA n n n Code maintenance Feature enhancement Write paper(s) for publication, go to conferences, present them Creating web-pages and user groups, answering questions Help in popularizing the tool, demos, etc Pick a challenging problem within this domain as M. Tech. project, write paper (s), go to conferences! 17
 Thank you/Questions Perf. Center code can be downloaded from http: //www. cse. iitb. ac. in/perfnet/perfcenter This research was sponsored by MHRD, Intel Corp, Tata Consultancy Services and IBM faculty award 2007 -2009 18
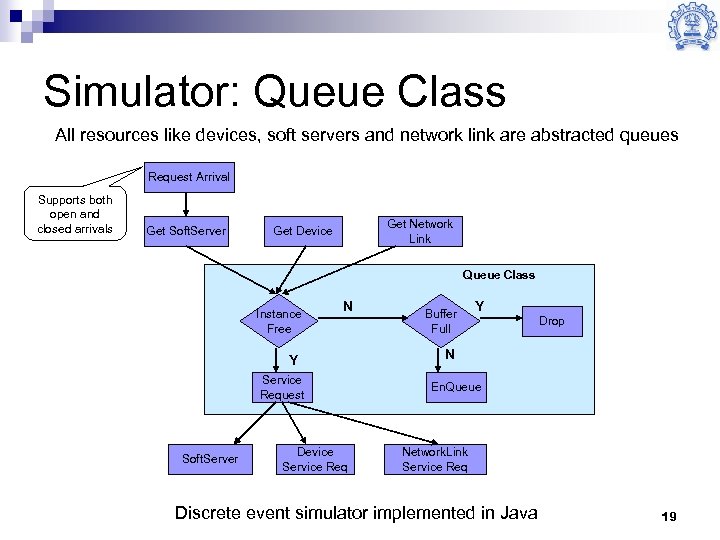 Simulator: Queue Class All resources like devices, soft servers and network link are abstracted queues Request Arrival Supports both open and closed arrivals Get Soft. Server Get Network Link Get Device Queue Class Instance Free N Y Service Request Soft. Server Device Service Req Buffer Full Y Drop N En. Queue Network. Link Service Req Discrete event simulator implemented in Java 19
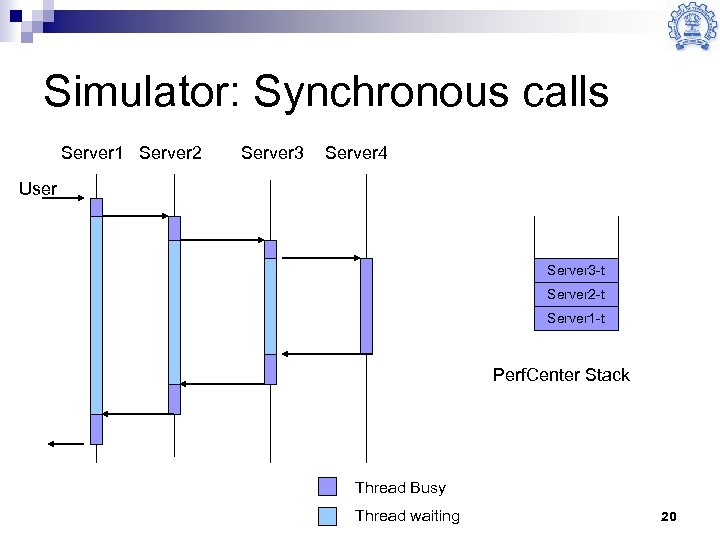 Simulator: Synchronous calls Server 1 Server 2 Server 3 Server 4 User Server 3 -t Server 2 -t Server 1 -t Perf. Center Stack Thread Busy Thread waiting 20
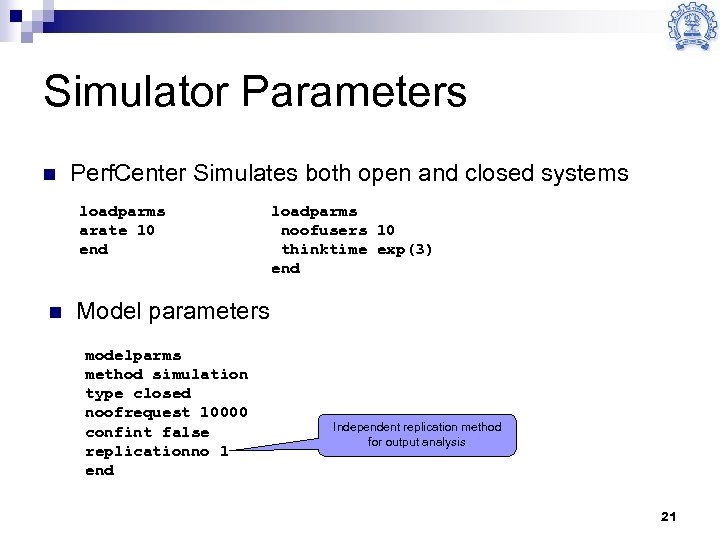 Simulator Parameters n Perf. Center Simulates both open and closed systems loadparms arate 10 end n loadparms noofusers 10 thinktime exp(3) end Model parameters modelparms method simulation type closed noofrequest 10000 confint false replicationno 1 end Independent replication method for output analysis 21
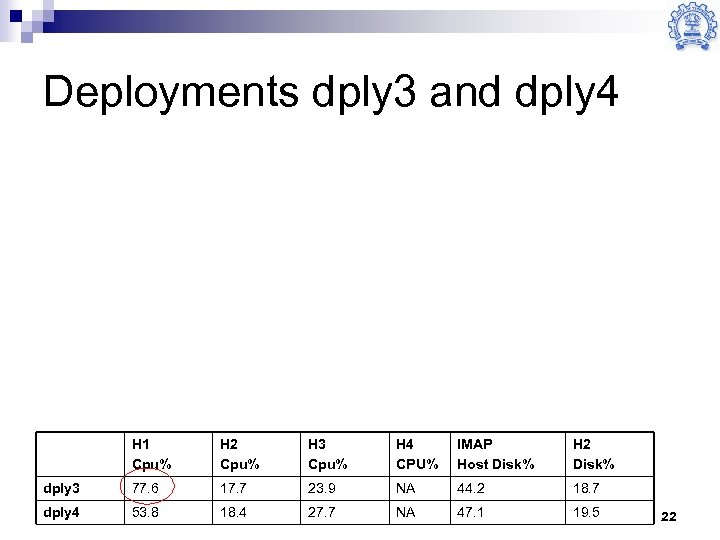 Deployments dply 3 and dply 4 H 1 Cpu% H 2 Cpu% H 3 Cpu% H 4 CPU% IMAP Host Disk% H 2 Disk% dply 3 77. 6 17. 7 23. 9 NA 44. 2 18. 7 dply 4 53. 8 18. 4 27. 7 NA 47. 1 19. 5 22
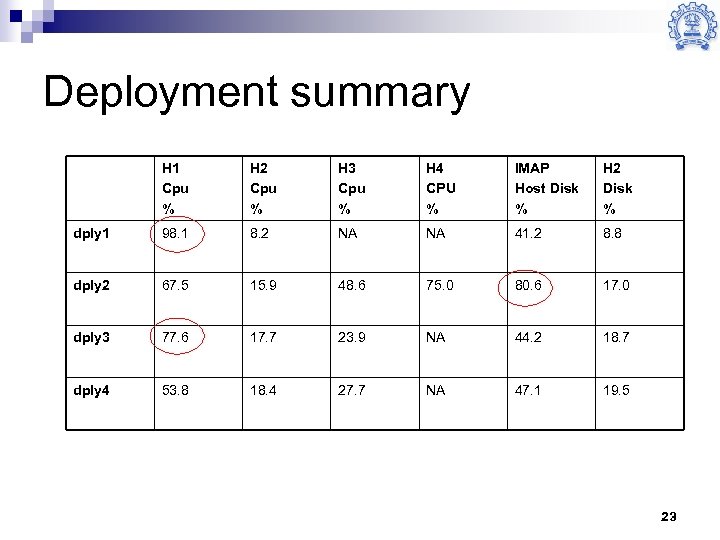 Deployment summary H 1 Cpu % H 2 Cpu % H 3 Cpu % H 4 CPU % IMAP Host Disk % H 2 Disk % dply 1 98. 1 8. 2 NA NA 41. 2 8. 8 dply 2 67. 5 15. 9 48. 6 75. 0 80. 6 17. 0 dply 3 77. 6 17. 7 23. 9 NA 44. 2 18. 7 dply 4 53. 8 18. 4 27. 7 NA 47. 1 19. 5 23
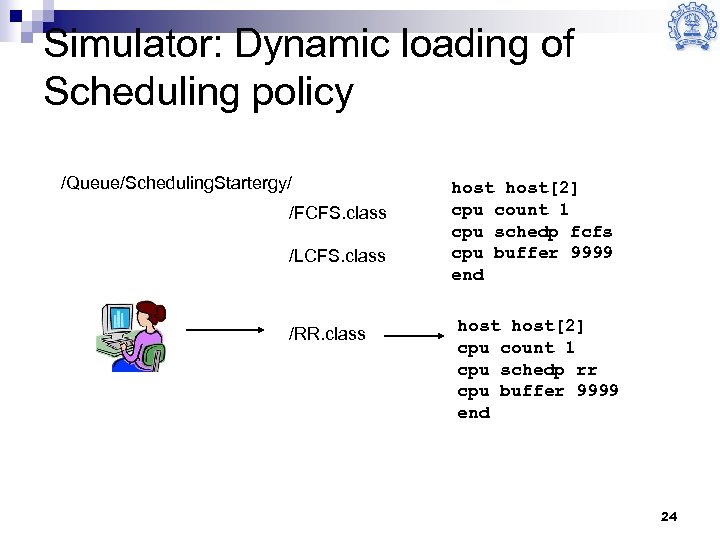 Simulator: Dynamic loading of Scheduling policy /Queue/Scheduling. Startergy/ /FCFS. class /LCFS. class /RR. class host[2] cpu count 1 cpu schedp fcfs cpu buffer 9999 end host[2] cpu count 1 cpu schedp rr cpu buffer 9999 end 24
 Using Perf. Center for “what-if” analysis n Scaling up Email Application n To support requests arriving at rate 2000 req/sec 25
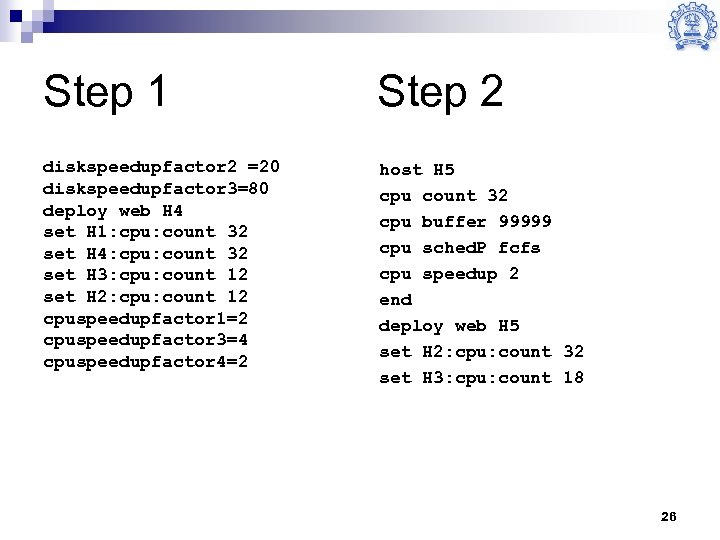 Step 1 Step 2 diskspeedupfactor 2 =20 diskspeedupfactor 3=80 deploy web H 4 set H 1: cpu: count 32 set H 4: cpu: count 32 set H 3: cpu: count 12 set H 2: cpu: count 12 cpuspeedupfactor 1=2 cpuspeedupfactor 3=4 cpuspeedupfactor 4=2 host H 5 cpu count 32 cpu buffer 99999 cpu sched. P fcfs cpu speedup 2 end deploy web H 5 set H 2: cpu: count 32 set H 3: cpu: count 18 26
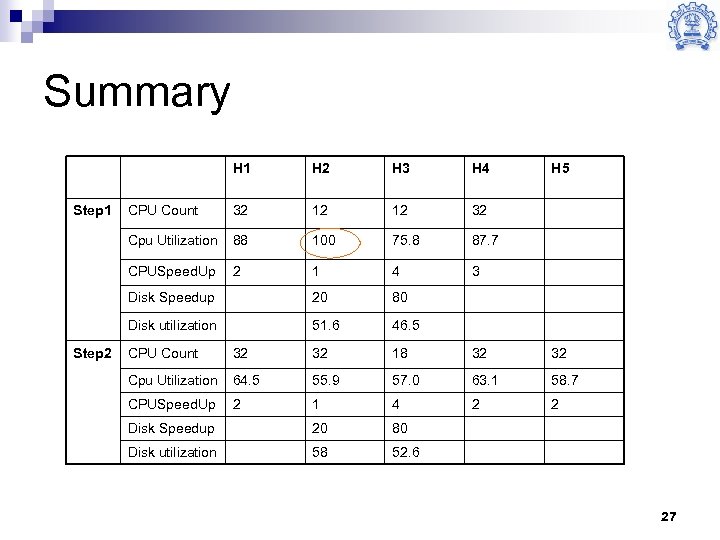 Summary H 1 H 4 CPU Count 32 12 12 32 88 100 75. 8 87. 7 CPUSpeed. Up 2 1 4 3 Disk Speedup 20 80 Disk utilization Step 2 H 3 Cpu Utilization Step 1 H 2 51. 6 H 5 46. 5 CPU Count 32 32 18 32 32 Cpu Utilization 64. 5 55. 9 57. 0 63. 1 58. 7 CPUSpeed. Up 2 1 4 2 2 Disk Speedup 20 80 Disk utilization 58 52. 6 27
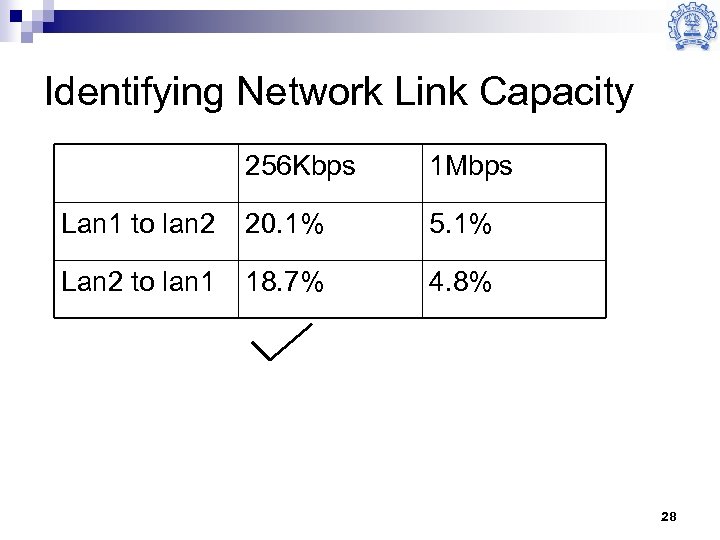 Identifying Network Link Capacity 256 Kbps 1 Mbps Lan 1 to lan 2 20. 1% 5. 1% Lan 2 to lan 1 18. 7% 4. 8% 28
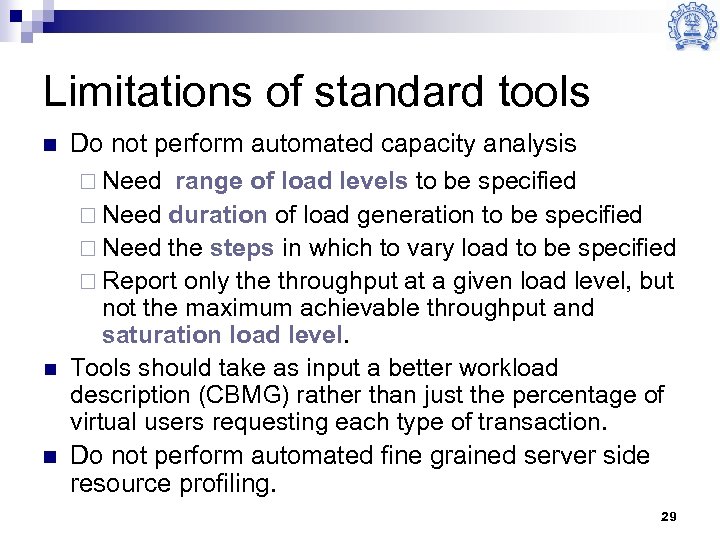 Limitations of standard tools n n n Do not perform automated capacity analysis ¨ Need range of load levels to be specified ¨ Need duration of load generation to be specified ¨ Need the steps in which to vary load to be specified ¨ Report only the throughput at a given load level, but not the maximum achievable throughput and saturation load level. Tools should take as input a better workload description (CBMG) rather than just the percentage of virtual users requesting each type of transaction. Do not perform automated fine grained server side resource profiling. 29


