2223e91e3de152b8b9ed9a67f5fda812.ppt
- Количество слайдов: 71


Pediatric Obesity: Prevention & Management Mary. Kathleen Heneghan MD Endocrinology, Diabetes & Metabolism Advocate Medical Group Lutheran General Children’s Hospital

I have nothing to disclose

Objectives • Define and differentiate between overweight and obese • Briefly discuss co-morbidities of obesity and screening tests available • Discuss recommendations for treatment and prevention of overweight and obesity

Available free at www. endo-society. org Available free at www. dietaryguidelines. gov

Where have we been and where are we headed?

Obesity Trends* Among U. S. Adults BRFSS, 1985 (*BMI ≥ 30, or ~ 30 lbs. overweight for 5’ 4” person) No Data <10% 10%– 14%

Obesity Trends* Among U. S. Adults BRFSS, 1994 (*BMI ≥ 30, or ~ 30 lbs. overweight for 5’ 4” person) No Data <10% 10%– 14% 15%– 19%

Obesity Trends* Among U. S. Adults BRFSS, 2001 (*BMI ≥ 30, or ~ 30 lbs. overweight for 5’ 4” person) No Data <10% 10%– 14% 15%– 19% 20%– 24% ≥ 25%

Obesity Trends* Among U. S. Adults BRFSS, 2008 (*BMI ≥ 30, or ~ 30 lbs. overweight for 5’ 4” person) No Data <10% 10%– 14% 29% ≥ 30% 15%– 19% 20%– 24% 25%–

Obesity Trends* Among U. S. Adults BRFSS, 2010 (*BMI ≥ 30, or ~ 30 lbs. overweight for 5’ 4” person) No Data <10% 10%– 14% 29% ≥ 30% 15%– 19% 20%– 24% 25%–

Prevalence* of Self-Reported Obesity Among U. S. Adults BRFSS, 2011 *Prevalence reflects BRFSS methodological changes in 2011, and these estimates should not be compared to previous years. 15%–<20% 20%–<25% 25%–<30% 30%–<35% ≥ 35%

Prevalence of Self-Reported Obesity Among U. S. Adults BRFSS, 2011 State Alabama Alaska Arizona Arkansas California Colorado Connecticut Delaware District of Columbia Florida Georgia Hawaii Idaho Illinois Indiana Iowa Kansas Kentucky Louisiana Maine Maryland Massachusetts Michigan Minnesota Mississippi Prevalence 32. 0 27. 4 24. 7 30. 9 23. 8 20. 7 24. 5 28. 8 23. 7 26. 6 28. 0 21. 8 27. 0 27. 1 30. 8 29. 0 29. 6 30. 4 33. 4 27. 8 28. 3 22. 7 31. 3 25. 7 34. 9 Confidence Interval (30. 5, 33. 5) (25. 3, 29. 7) (22. 7, 26. 9) (28. 8, 33. 1) (22. 9, 24. 7) (19. 7, 21. 8) (23. 0, 26. 0) (26. 9, 30. 7) (21. 9, 25. 7) (25. 4, 27. 9) (26. 6, 29. 4) (20. 4, 23. 4) (25. 3, 28. 9) (25. 4, 28. 9) (29. 5, 32. 3) (27. 6, 30. 3) (28. 7, 30. 4) (28. 9, 31. 9) (32. 0, 34. 9) (26. 8, 28. 9) (26. 9, 29. 7) (21. 8, 23. 7) (30. 0, 32. 6) (24. 6, 26. 8) (33. 5, 36. 3) State Missouri Montana Nebraska Nevada New Hampshire New Jersey New Mexico New York North Carolina North Dakota Ohio Oklahoma Oregon Pennsylvania Rhode Island South Carolina South Dakota Tennessee Texas Utah Vermont Virginia Washington West Virginia Wisconsin Wyoming Prevalence 30. 3 24. 6 28. 4 24. 5 26. 2 23. 7 26. 3 24. 5 29. 1 27. 8 29. 6 31. 1 26. 7 28. 6 25. 4 30. 8 28. 1 29. 2 30. 4 24. 4 25. 4 29. 2 26. 5 32. 4 27. 7 25. 0 Confidence Interval (28. 6, 32. 0) (23. 3, 26. 0) (27. 6, 29. 2) (22. 5, 26. 6) (24. 7, 27. 7) (22. 7, 24. 8) (25. 1, 27. 6) (23. 2, 25. 9) (27. 7, 30. 6) (26. 3, 29. 4) (28. 3, 31. 0) (29. 7, 32. 5) (25. 2, 28. 3) (27. 3, 29. 8) (23. 9, 27. 0) (29. 6, 32. 1) (26. 3, 30. 1) (26. 8, 31. 7) (29. 1, 31. 8) (23. 4, 25. 5) (24. 1, 26. 8) (27. 5, 30. 9) (25. 3, 27. 7) (30. 9, 34. 0) (25. 8, 29. 7) (23. 5, 26. 6) Source: Behavioral Risk Factor Surveillance System, CDC. Prevalence reflects BRFSS methodological changes in 2011, and these estimates should not be compared to previous years.

Are trends similar for children and adolescents? Are trends similar in the Illinois?

Obesity trends

Overweight and obesity among 2 -19 year olds in the U. S. (Ogden et al, 2006, Ogden et al, 2010) CLOCC press release 2010

In Chicago, Children Aged 3 To 7 Have a Much Higher Prevalence of Obesity Than U. S. Children 2 -5 Years Old Obese rates in early childhood *U. S. data based on children 2 -5 years old **Chicago data based on children 3 -7 years old (Ogden et al, 2010, CLOCC press release, 2010)

Chicago Children Aged 10 to 13 Have a Higher Prevalence of Obesity Than U. S. Children 6 -11 Years Old Obese rates in middle childhood *U. S. data based on children 6 -11 years old **Chicago data based on children 10 -13 years old
 Obesity Rates Exceed U. S.")
In Illinois, Pre-teen and Teen (ages 10 -17 years) Obesity Rates Exceed U. S. Levels Obese rates in adolescence Illinois children have a higher prevalence of obesity (35%) than US children (31%) of the same age Illinois has the 10 th highest percent of obese and overweight children in the U. S. (Trust for America’s Health, 2009)
 is a childhood")
CLOCC • The Consortium to Lower Obesity in Chicago Children (CLOCC) is a childhood obesity prevention program housed within the Center for Obesity Management and Prevention at Children’s Memorial Hospital.

We recognize the problem but need to make the diagnosis

How to define overweight and obesity • Use of the BMI • Calculated by wt (kg)/ ht (m 2) • Increase BMI is related to morbidity and mortality in adults • In females BMI naturally increases with puberty • BMI may be skewed if child goes through puberty outside of normal range

How to define overweight and obesity • Overweight - BMI is 85 th-95 th percentile based on age and sex • Obese - BMI is >95 th percentile based on age and sex • In children <4 yr of age – BMI may not be precise and weight for height charts may be used as a warning sign

Endocrine causes • GH deficiency • Hypopituitarism • Hypothyroidism • Cushing disease • Pseudohypoparathyroidism Endocrine causes associated with increased BMI but stature and height velocity is decreased where as Stature and height velocity are usually increased with exogenous obesity

Looking for endocrine cause • The Endocrine Society recommends against routine lab evaluation for endocrine causes of obesity in obese children/adolescents unless the child’s height velocity is attenuated • 2 uncommon circumstances • Adrenal tumor – exam should have signs of virilization • Growth without growth hormone (idiopathic isolated GH deficiency)

Obesity and hypothyroidism • Hypothyroidism remains an unlikely sole cause of obesity • Recent studies confirm mildly elevated TSH may be seen with obesity • retrospective review of medical records of 191 obese and 125 nonobese children • Six obese patients had Hashimoto disease and TSH values from 0. 73 to 12. 73 m. IU/L • Out of 185 obese subjects, 20 (10. 8%) had TSH levels >4 m. IU/L, with no control subject measurement exceeding this TSH value. • The highest TSH concentration in an obese study subject was 7. 51 m. IU/L. Mild elevation of TSH values in the absence of autoimmune thyroid disease is not uncommon in some obese children and adolescents Dekelbab BH, Abou Ouf HA, Jain I. Prevalence of elevated thyroid -stimulating hormone levels in obese children and adolescents. Endocr Pract. 2010 Mar-Apr; 16(2): 187 -90.

Genetic Testing Refer to Genetics those children whose obesity is related to a syndrome Early onset obesity & MC 4 R Gene testing • Melanocortin receptor 4 • Predisposes people to obesity • Children with weight gain since early infancy and are >97 th centile for weight by age 3 • Positive in about 2 -4% of patients >97 th centile • NO TREATMENT AVAILABLE

Co-Morbidities • Evaluate those with BMI >85 th centile

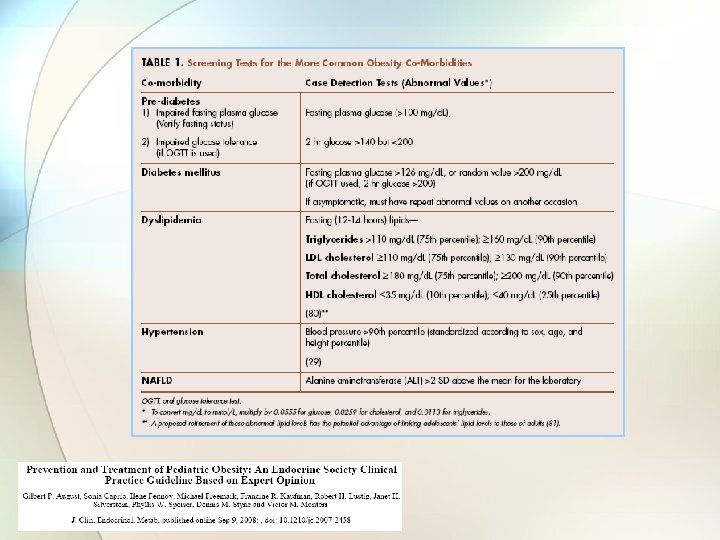
Pre-Diabetes • Impaired fasting plasma glucose • Fasting glucose >100 mg/dl • Impaired glucose tolerance • 2 hour glucose >140 but <200 • New since 2010 – Hgb. A 1 c from 5. 7 – 6. 4%

Diabetes Mellitus • Fasting plasma glucose >126 mg/dl • Random plasma glucose >200 mg/dl • 2 hour glucose >200 mg/dl on OGTT • New since 2010 Hgb. A 1 c >6. 5% ***If asymptomatic must repeat abnormal values***

Dyslipidemia Fasting Lipids 75 th percentile 90 th percentile Triglycerides >110 mg/dl >160 mg/dl > 110 mg/dl >130 mg/dl Total Cholesterol >180 mg/dl >200 mg/dl HDL (10 th percentile) <35 mg/dl (25 th percentile) <40 mg/dl (sugar & starchy foods and diets high in saturated fat) LDL (saturated and trans fats) (exercise & fruits and veggies) Primary treatment is dietary changes – pharmacotherapy is available

Hypertension • Blood pressure > 90 th centile according to sex, age and height percentile • Quick estimate: • Systolic = 90 + (3 x age in years) • Diastolic = 50 + (1. 5 x age in years)
 > 2 SD above the mean")
Nonalcoholic Fatty Liver Disease • Alanine aminotransferase (ALT) > 2 SD above the mean for the laboratory • ALT elevation greater than AST elevation • NAFLD can progress to NASH and cirrhosis

Risk factors for developing obesity • • • Maternal diabetes SGA LGA Parental obesity (maternal >paternal) Maternal weight gain during pregnancy • Breastfeeding duration • Weight of siblings

Medical History • • • Presence of snoring and apnea Polyuria, polydipsia or weight loss Acne, hirsutism, menstrual history Use of psych meds **** Dietary History**** • Type and quantity of beverage intake • Frequency of dining out • Frequency and type of snacks • **** Activity History**** • Duration and frequency of exercise during the day • Estimates of screen time • Availability and safety of parks and gyms

Physical Exam • • • Waist circumference Blood pressure Acanthosis nigricans and skin tags Severe acne and hirsutism Tenderness and range of motion of knee, leg and foot • Peripheral edema

Once the diagnosis is made

Care Providers Perceived Barriers to Treatment Story M, Neumark-Stzainer D, Sherwood N, et al. Management of Child and Adolescent Obesity: Attitudes, Barriers, Skills, and Training Needs Among Health Care Professionals. Pediatrics [serial online]. July 2, 2002; 110(1): 210.

Care Providers Perceived Barriers to Treatment Story M, Neumark-Stzainer D, Sherwood N, et al. Management of Child and Adolescent Obesity: Attitudes, Barriers, Skills, and Training Needs Among Health Care Professionals. Pediatrics [serial online]. July 2, 2002; 110(1): 210.

Recommendations • Intensive lifestyle modification • Dietary • Physical activity • Behavioral • Age Appropriate

Physical Activity • 60 min of daily moderate to vigorous physical activity • Look – Listen - Feel = sweat, breathing hard and heart beating faster • Decreased screen time to 1 -2 hours per day • Can balance screen time with activity by allowing X amt of screen time per X minutes of physical activity

Exercise • A factor contributing to weigh re-gain may be lack of continued exercise program • The odds for weight regain are 2 -fold greater in those patients who are sedentary* • Meta analysis of long term maintenance studies showed a 27. 2% weight loss retention in low exercise group and 53. 8% weight loss retention in high exercise group◊ * ◊

Dietary Guidelines for Americans 2010

Dietary Guidelines for Americans 2010

Factors for successful weight maintenance • Reduced caloric intake • Reduced fat intake • Reduced fast food consumption

Dietary recommendations • Avoid consumption of calorie dense, nutrient poor foods • • • Sweetened beverages Sports drinks Fruit drinks/juices Most “fast food” Calorie dense snacks • One must expend or not take in 3500 calories to lose ~1 pound of fat

Beverage consumption in the US population. Storey ML - J Am Diet Assoc - 01 -DEC-2006; 106(12): 1992 -2000

Beverage consumption in the US population. Storey ML - J Am Diet Assoc - 01 -DEC-2006; 106(12): 1992 -2000

Beverage consumption in the US population. Storey ML - J Am Diet Assoc - 01 -DEC-2006; 106(12): 1992 -2000

Beverage consumption in the US population. Storey ML - J Am Diet Assoc - 01 -DEC-2006; 106(12): 1992 -2000

Beverage consumption • If the average child/adolescent switched to water and skim milk (8 -12 oz per day) most would lose 1 pound every 1 -2 weeks • Skim milk (8 oz) = 91 calories

Dietary Recommendations • Portion control • Plate method • Divide plate into quadrants • ½ with fruit and veggies • ¼ with starch • ¼ with protein • Fist method • 2 fists = veggies • 1 palm = protein • 1 fist = starch • 1 fist = fruits

Dietary Recommendations • Reducing saturated fat for children > 2 y/o • Increasing intake of dietary fiber, fruits and vegetables • Eat timely, regular meals (especially breakfast) and avoid grazing • Overweight children and adolescents are more likely to skip breakfast and consume few large meals per day • Frequent snacking is associated with higher intake of fat, sugar and calories

Dietary Guidelines for Americans 2010

Dietary Guidelines for Americans 2010

Intensive Lifestyle Modifications Intensive counseling with at least one “person to person” session per month for the first 3 months • Intensive plan covering diet, exercise and behavior changes • Monthly follow up • A maintenance program after the intensive treatment • Is it feasible? Poor reimbursement

Parental Guidance & Commitment • Educate parents about the need for: • • Modeling of healthy habits Avoidance of overly strict diets Setting limits of acceptable behavior Avoidance of food as a reward or punishment

Family Commitment • Good data is lacking regarding interventions in pediatric populations • Most suggest involving the entire family yields better results than targeting individual

Success of lifestyle modifications • Anticipate a success rate of about 25% • Accept this and continue developing techniques to help lifestyle modifications be effective in a larger percentage of patients

Pharmacotherapy • Reserved for those with co-morbidities who have undertaken intensive lifestyle modification with no success • Metformin – not FDA approved for treatment of obesity. Meta-analysis have failed to show a significant change in BMI • Sibutramine, Orlistat, Octreotide, Topiramate and GH are other options; reserved for use by those who specialize in weight loss therapy.

Bariatric Surgery • Referral to clinic with specific experience in bariatric surgery in adolescents • Reserved for those: • Tanner 4 or 5 • BMI >50 kg/m 2 or >40 kg/m 2 with significant severe co-morbidities • Participation in a formal lifestyle modification program • Psychological evaluation • Experienced surgeon • PATIENT DEMONSTRATES THE ABILITY TO FOLLOW HEALTHY DIETARY AND ACTIVITY HABITS

Prevention

Prevention • Breastfeeding for a minimum of 6 months • Educate families through anticipatory guidance at each visit – help them realize there may be a problem • Educate the community

Breastfeeding Percent of births at Baby-Friendly facilities in 2012, by state Data Source: CDC National Survey of Maternity Practices in Infant Nutrition and Care (m. PINC)

Breastfeeding

Ban on “Happy Meals” • Santa Clara County, California banned restaurants from using toys or other goodies to entice kids to order unhealthy food. What are the limits? • 120 calories in a beverage • 200 calories in a single food item • 485 calories in a meal • 480 mg sodium in a single item • 600 mg sodium in a meal • 35 percent total calories from fat • 10 percent of calories from added sweeteners

Ban on “Happy Meals” • San Francisco followed with similar ban in Nov 2010 • Passed with an 8 -3 vote • Took effect December 2011 • Mc. Donald's is complying with ordinance by charging $0. 10 for the addition of a toy -- with the proceeds benefitting the Ronald Mc. Donald House Charity • Has made a difference in some aspects • Mc. Donalds now offering apple slices and fries in all meals • Other fast food companies have eliminated toys in California • New York City is proposing similar legislation

Advocacy • Providers need to advocate for: • Policies to decrease exposure of children and adolescents to promotion of unhealthy food choices in the community • School districts to provide healthy food and drinks along with physical activity programs • All communities to have safe recreational areas and access to affordable high quality fresh fruits and vegetables
")
In Summary • Obesity is an extremely prevalent disease (even in children and adolescents) and needs our attention now • We need to provide guidance for families at every visit to help incorporate: • Increased physical activity • Healthy dietary choices • Behavior changes for the family • We need to advocate for change

Thank you

Available free at www. endo-society. org Available free at www. dietaryguidelines. gov
2223e91e3de152b8b9ed9a67f5fda812.ppt