

1bff21659394a39159ee9295106c7a8d.ppt
- Количество слайдов: 149
 Patient-Centered Medical Quality Homework: Making It Happen Michael Crouch, MD, MSPH Dale Moquist, MD Memorial Family Medicine Residency, Sugar Land, Texas STFM Annual Spring Conference April 27, 2012 1
 Goals: o Discuss concepts and methods for integrating structure & processes for continuous quality improvement into the patient-centered medical home o Present and analyze the success of a quality improvement project conducted in a suburban family practice center o Give participants experience using specific quality improvement tools. 3
 Objectives: After participating in this session, you should be able to. . . o Explain 2 key premises for conducting successful continuous quality improvement (CQI) in an office practice that is functioning as a patientcentered medical home. o Map the processes, do a root cause analysis, and select a QI intervention for a care activity in your setting. o Lead and/or participate effectively as a team member in the planning and implementation of continuous quality improvement (CQI) projects in your work setting. 4
 Session Outline o o o o Introduction & Who We Are Our Opportunity Identified Principles and History of QI Experience of Other Residencies Physicians At Sugar Creek Experience Learning Activity QI Implementation Tips Summary 5
 Session Outline o o o o Introduction & Who We Are Our Opportunity Identified Principles and History of QI Experience of Other Residencies Physician At Sugar Creek Experience Learning Activity QI Implementation Tips Summary 6
 7
7
 8
8
 1 st Patient Centered Medical Home in Texas! Texas Physicians at Sugar Creek Practice Site for Memorial Family Medicine Residency 9
 o Quality measures occupy one of the 4 “rooms”") Patient-centered Medical Home ( PCMH) o Quality measures occupy one of the 4 “rooms” in the patient-centered medical home 10
Patient-centered Medical Home ( PCMH) o Quality measures occupy one of the 4 “rooms” in the patient-centered medical home 10
 Session Outline o o o o Introduction & Who We Are Our Opportunity Identified Principles of QI Experience of Other Residencies Physicians At Sugar Creek Experience Learning Activity QI Implementation Tips Summary 11
 PSC Quality Improvement Project Example: LDL Screening PLAN: Define the problem Dated July 10, 2010 12
 13
13
 Gender Discrepancy in LDL-C Screening Rates o Young men have LDL-C screening much (15 -19%) less often than young women, despite men’s being at higher risk for CHD at earlier age. o Why? 14
 Gender Discrepancy in LDL-C Screening Rates o Young men have LDL-C screening much (15 -19%) less often than young women. o Why? o Probably mostly because they make doctor visits about half as often as women of similar age. 15
 3 rd Report of the Adult") NCEP Cholesterol Screening National Cholesterol Education Program (NCEP) 3 rd Report of the Adult Treatment Panel (ATP-III, 2004) o Recommends screening all adults age 20 & above for lipid abnormalities with a fasting lipid profile at least every 5 years o Bases treatment decisions on LDL-C level 16
NCEP Cholesterol Screening National Cholesterol Education Program (NCEP) 3 rd Report of the Adult Treatment Panel (ATP-III, 2004) o Recommends screening all adults age 20 & above for lipid abnormalities with a fasting lipid profile at least every 5 years o Bases treatment decisions on LDL-C level 16
 Cholesterol Screening Guideline Decision Our quality improvement project team believes that the 2004 NCEP guideline makes more sense than the 2008 USPSTF recommendations, so we chose it to guide our QI project goals. 23
 Session Outline o o o o Introduction & Who We Are Our Opportunity Identified Principles and History of QI Experience of Other Residencies Physicians At Sugar Creek Experience Learning Activity QI Implementation Tips Summary 24
 Quality Improvement Philosophy: Process problems > People problems o 95% of unwanted situations in a work system are more attributable to problematic processes than to problem people. 25
—manufacturing control: “close tolerance range” through") Early History of Quality Improvement Methods o Shewhart (1939)—manufacturing control: “close tolerance range” through specification, production, inspection o W. Edwards Deming— 1950’s in Japan (U. S. companies unreceptive); work toward zero tolerance (zero error rate); total quality improvement (TQI) 26
Early History of Quality Improvement Methods o Shewhart (1939)—manufacturing control: “close tolerance range” through specification, production, inspection o W. Edwards Deming— 1950’s in Japan (U. S. companies unreceptive); work toward zero tolerance (zero error rate); total quality improvement (TQI) 26
 in the 1980’s") Recent History of Continuous Quality Improvement Renamed continuous quality improvement (CQI) in the 1980’s Lots of other pseudonyms for CQI (1 for each consulting firm, it seems), including: o Kaizen o Six Sigma (DMAIC) o Lean Thinking 27
Recent History of Continuous Quality Improvement Renamed continuous quality improvement (CQI) in the 1980’s Lots of other pseudonyms for CQI (1 for each consulting firm, it seems), including: o Kaizen o Six Sigma (DMAIC) o Lean Thinking 27
 4 1 3 2 29
 Principles CQI is an approach to quality management that o") Continuous Quality Improvement (CQI) Principles CQI is an approach to quality management that o emphasizes the organization & systems o focuses on processes not individuals o recognizes both internal and external customers o promotes the need for objective data to analyze and improve processes 30
Continuous Quality Improvement (CQI) Principles CQI is an approach to quality management that o emphasizes the organization & systems o focuses on processes not individuals o recognizes both internal and external customers o promotes the need for objective data to analyze and improve processes 30
 CQI Philosophy o CQI management philosophy contends that most things can be improved. o CQI uses serial experimentation (the scientific method) applied to everyday work, to meet the needs of those we serve and improve the services we offer. 31
 CQI Core Concepts o Quality = meeting and/or exceeding the expectations of our customers. o Success = meeting customers’ needs. o Do not seek to blame people, but rather seek to improve processes. 32
 o Unintended variation in processes can lead to unwanted variation") CQI Core Concepts (cont’d) o Unintended variation in processes can lead to unwanted variation in outcomes, and therefore we seek to reduce or eliminate unwanted variation. o Continual improvement can be made with small, incremental changes. 33
CQI Core Concepts (cont’d) o Unintended variation in processes can lead to unwanted variation in outcomes, and therefore we seek to reduce or eliminate unwanted variation. o Continual improvement can be made with small, incremental changes. 33
 o Continuous improvement is most effective when it becomes a") CQI Core Concepts (cont’d) o Continuous improvement is most effective when it becomes a natural part of everyday work. 34
CQI Core Concepts (cont’d) o Continuous improvement is most effective when it becomes a natural part of everyday work. 34
 CQI Tasks o Form a team that has knowledge of the system needing improvement. o Define a clear aim. o Understand the needs of the people who are served by the system. o Identify & define measures of success. 35
 CQI Tasks o Brainstorm potential change strategies for producing improvement. o Plan, collect, and use data for facilitating effective decision making. o Apply the scientific method to test and refine changes. 36
 Quality Improvement: The Big Picture o Dr. Dale Moquist will paint the big picture context for quality improvement in family medicine. o He was there at the beginning in 1995. 37
 n Healthcare") Quality Improvement: The Big Picture o National Committee for Quality Assurance (NCQA) n Healthcare Effectiveness Data and Information Set (HEDIS) n Quality Index & Effectiveness of Care Measures n Physician and Hospital Quality (PHQ) certification program 38
Quality Improvement: The Big Picture o National Committee for Quality Assurance (NCQA) n Healthcare Effectiveness Data and Information Set (HEDIS) n Quality Index & Effectiveness of Care Measures n Physician and Hospital Quality (PHQ) certification program 38
 The American Academy of Family Physicians is committed to promoting quality, cost-effective health care. The AAFP supports health care quality improvement efforts, including development and application of performance measures which are: o Focused on improving important processes and outcomes of care in terms that matter to patients o Responsive to informed patients’ cultures, values and preferences o 39 Ref: http: //www. aafp. org/online/en/home/policy/policies/p/performancemeasures. html
: o Based on best evidence and reflect") AAFP attribute standards for performance measures (continued): o Based on best evidence and reflect variations in care consistent with appropriate professional judgment o Practical, given variations of systems & resources available in practice settings o Not separately evaluating cost of care from quality & appropriateness of care 40
AAFP attribute standards for performance measures (continued): o Based on best evidence and reflect variations in care consistent with appropriate professional judgment o Practical, given variations of systems & resources available in practice settings o Not separately evaluating cost of care from quality & appropriateness of care 40
: o Take into account the burden of") AAFP attribute standards for performance measures (cont’d): o Take into account the burden of data collection, particularly in the aggregation of multiple measures o Provide transparency for methods used o Assess patient well-being, satisfaction, access to care, disparities and health status o Updated regularly or when new evidence is developed 41
AAFP attribute standards for performance measures (cont’d): o Take into account the burden of data collection, particularly in the aggregation of multiple measures o Provide transparency for methods used o Assess patient well-being, satisfaction, access to care, disparities and health status o Updated regularly or when new evidence is developed 41
 42 http: //www. aafp. org/online/en/home/membership/initiatives/pcmh. html
 Patient-Centered Medical Home Checklist: “Culture of Improvement” o Establish core performance measures o Collect data for better clinical management o Analyze the data for quality improvement o Map processes to identify (in)efficiencies o Discuss (and implement) best practices 43
 Session Outline o o o o Introduction & Who We Are Our Opportunity Identified Principles of QI Experience of Other Residencies Physicians At Sugar Creek Experience Learning Activity QI Implementation Tips Summary 44
 Integrating Improvement Competencies Into Residency Education: A Pilot Project From a Pediatric Continuity Clinic The Accreditation Council for Graduate Medical Education (ACGME) requires residents to attain 6 core competencies. The article below describes a model for integrating 2 competencies (practice-based learning & improvement & systems-based practice) into residency education & assesses clinical outcomes achieved for patients. Ref: Mohr JJ, Randolph GD, Laughon MM, et al. Ambul Pediatr 2003 May-Jun; 3: 131 -6. 45
 A Pilot Project From a Pediatric Continuity Clinic o Study Design—pre-post intervention o Main Outcome Measures—proportion of children up-to-date on DTP, polio, MMR, HIB, & hepatitis B vaccines by 24 months o Intervention—Pediatric faculty facilitated multidisciplinary team meetings (incl. 8 residents) & implemented improvement model to improve selected immunizations 46
 A Pilot Project From a Pediatric Continuity Clinic o Results—residents' improvement team successfully implemented 5 changes in clinic process, which coincided with an increase in immunization rates for 2 -yearolds during the 1 -year study period. o Clinic immunization rates increased from 60% baseline to 86% at follow-up (P =. 04). 47
 A Pilot Project From a Pediatric Continuity Clinic o Conclusion. —This study suggests that it is feasible to integrate practice-based learning & improvement & systems-based practice into residency education while providing a valuable learning experience for residents & improving patient outcomes. o Ref: Mohr JJ, Randolph GD, Laughon MM, et al. Ambul Pediatr 2003 May-Jun; 3: 131 -6. 48
 Family Medicine Residency QI Curriculum Example o Background: The Accreditation Council for Graduate Medical Education (ACGME) requires integrating practice improvement activities into residency training. 49
 Family Medicine Residency QI Curriculum Example o A curricular change was designed at the Department of Family and Community Medicine, University of Louisville, to address selected ACGME competencies by incorporating practice-based improvement activities into the routine clinical work of family medicine residents. 50
 Practice-Based Learning & Improvement ACGME Competencies 1. Locate, appraise, and assimilate evidence from scientific studies related to targeted health problem Didactic: session on performing literature search. Experiential: Residents complete literature search to document evidence for interventions. 51
 Practice-Based Learning & Improvement ACGME Competencies 2. Analyze practice experience & perform practicebased improvement activities using systematic methodology Didactic: sessions on flowcharts, PDSA cycles Experiential: Teams create flowchart to identify root causes of problems in practice. 52
 Practice-Based Learning & Improvement ACGME Competencies 2. Analyze practice experience & perform practicebased improvement activities using systematic methodology Experiential: (cont’d) Teams design learning cycle to make changes in practice. Teams determine & measure outcomes to demonstrate effect of change. 53
 Practice-Based Learning & Improvement ACGME Competencies 3. Obtain and use Experiential: Team information about perform chart audits in own population of own practices. patients and larger Teams may perform population from comparison audits of which those other practices, or patients are drawn. compare other practices’ audit data with their own audit data. 54
 Practice-Based Learning & Improvement ACGME Competencies 4. Facilitate Residents prepare learning of presentations and students and other share them with the healthcare group. professionals 55
 Family Medicine Residency Curriculum Methods o Methods: Teams of residents, faculty, and office staff completed clinical improvement projects at 3 ambulatory care training sites. o o Residents were given academic credit for participation in team meetings. 56
 o After 6 months, residents presented results to") Family Medicine Residency Curriculum Methods (cont’d) o After 6 months, residents presented results to faculty, medical students, other residents, & staff from all 3 training sites. o Residents, staff, and faculty were recognized & rewarded for participation. 57
Family Medicine Residency Curriculum Methods (cont’d) o After 6 months, residents presented results to faculty, medical students, other residents, & staff from all 3 training sites. o Residents, staff, and faculty were recognized & rewarded for participation. 57
 Family Medicine Residency Curriculum Change Outcomes o Program evaluation: Residents demonstrated ACGME competencies for: n Using quality improvement tools to facilitate analysis of root causes and understand the QI process n Using Plan-Do-Study-Act cycle worksheets to guide planning of change process n Using chart audits to measure improvement in clinical projects 58
 Family Medicine Residency Site 1 Outcomes o Team: 4 faculty, 12 residents, 5 staff o Goal: Improve completion of medication lists by 30% over baseline within 3 mos. o Measurements: 100 baseline & 50 follow-up chart audits o Outcome: Increased medication list completion from 10% to 44% (met goal by achieving 34% increase) 59
 Family Medicine Residency Site 2 Outcomes o Team: 5 faculty, 6 residents, 2 nurse practitioners, 1 physician assistant, 10 office staff o Goal: Achieve completion (>6/8 areas addressed) of adult data summary sheets (CADSS) to a level of 60% during a 3 & a half-month period. 60
 Family Medicine Residency Site 2 Outcomes o Measurements: baseline 36 -chart sample & 100 -chart sample in another site; post-intervention chart audit of 35 charts o Outcome: Increased CADDS from 14% to 44% (fell short of goal of 60%) 61
 Family Medicine Residency Site 3 Outcomes o Team: 2 faculty, 6 residents, 5 staff o Goal: increase annual microalbuminuria screening with microalbumin dipstick in pts with DM o Outcome: Increased microalbumin screening from 5% to 29% (fell far short of goal of 55%) 62
 63
63
 Family Medicine Residency Curriculum Change Conclusions o Conclusions: Improvement activities that affect patient care and demonstrate selected ACGME competencies can be successfully incorporated into the daily work flow of family medicine residents. o Ref: Authors: Coleman MT; Nasraty S, Ostapchuk M, Wheeler, S. Joint Commission 64 Journal Quality Patient Safety 2003; 29: 238 -247.
 Family Medicine Residency Example Other Conclusions? o What other conclusion could be drawn from this family medicine residency QI example? 65
 Family Medicine Residency Example Other Conclusions? o What other conclusions could be drawn from this family medicine residency QI example? Overly ambitious goals are a setup for failure to achieve them, and for lowering enthusiasm for QI work 66
 Session Outline o o o o Introduction & Who We Are Our Opportunity Identified Principles of QI Experience of Other Residencies Physicians At Sugar Creek Experience Learning Activity QI Implementation Tips Summary 67
 Our QI Project Example o Project Title: LDL-C Screening in Young Adults o We are presenting our project as a model that demonstrates the potential of Quality Improvement methods for successfully improving the quality of care processes and outcomes.
 Our QI Project Example o Quality Improvement Team Michael Crouch—Project Coordinator and SE Pod Project “Champion” Jaime Cazares—SW Pod Champion Percy Howard—NE Pod Champion Dale Moquist—NW Pod Champion 69
 Processes o Define the problem specifically o Measure") Another QI Paradigm: Six Sigma (DMAIC) Processes o Define the problem specifically o Measure key aspects of the current process o Analyze cause-&-effect relationships to identify root causes limiting the process and outcome quality o Improve or optimize the process toward benchmark goals (external or internal) o Control future processes to prevent regression to lower quality level 70
Another QI Paradigm: Six Sigma (DMAIC) Processes o Define the problem specifically o Measure key aspects of the current process o Analyze cause-&-effect relationships to identify root causes limiting the process and outcome quality o Improve or optimize the process toward benchmark goals (external or internal) o Control future processes to prevent regression to lower quality level 70
 Applying the DMAIC Processes PLAN Phase: Define and Measure the Problem o What is the problem? n Suspected low rate of cholesterol screening in young adults seen in our practice o What is the significance of the problem in the big picture? (next slide) 71
 72
72
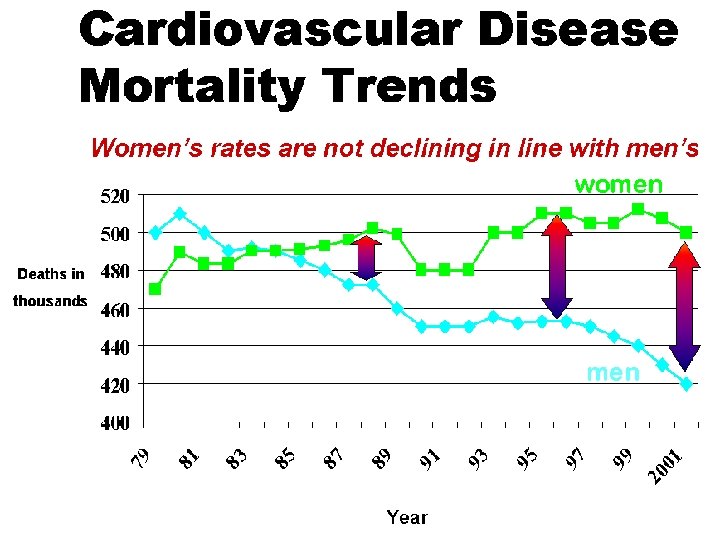
 Women catch men in mid-late 50’s 73
 Women die of CHD & CVA more often than from cancer
 The main cause of coronary heart disease is atherosclerosis o Atherosclerosis major risk factors n Elevated LDL-cholesterol n Low HDL-cholesterol n Smoking or oral tobacco use n Hypertension n Diabetes (usually type 2) n Family history of heart disease in men<55 or women<65 76
 Atherosclerosis natural history o often begins in adolescence or early adulthood o progresses at variable speed o causes heart attack & stroke in 30’s on o 1 st symptom is often sudden death o complications preventable o early intervention maybe more effective (unproven) 77
 Applying the DMAIC Processes PLAN Phase: Define and Measure the Problem o What do we want to keep from recurring? n Young adults seen at PSC who have elevated LDL-C (especially if severe) not knowing they have it. 78
 PLAN Phase: Define and Measure the Problem The Problem = low LDL-C screening rates in young adults. o When & where does problem occur? n. Routinely n. Nationwide, apparently n. More often in men than women 79
 What is the significance of the problem? o Many young adults seen at PSC with treatably elevated LDL-C will go on to develop atherosclerosis in later life in their coronary arteries & other major arteries. o Some young PSC patients will have heart attacks & strokes down the line that could have been prevented or delayed. 80
 Comparing customer expectations to what they currently receive o Expectation—Some knowledgable young adults want to know their cholesterol numbers, but many are unaware or uncaring about this. o This problem might be more important to (some) care providers than it is to many patients. 81
 The hypothesized gap in care quality o. Our practice generally has high expectations for effective preventive healthcare delivery in our practice. o Our practice has a suspected low current level of LDL-C screening. 82
 Benchmarking Ways to identify a performance standard or “metric”: o “Best Practice” performance level (actual) for a family medicine clinic o Expert-advised aspirational performance level (ideal vs. realistic) 83
 Analyze Cause-&-Effect Relationships o Collect a sample of data related to") DMAIC Processes (continued) Analyze Cause-&-Effect Relationships o Collect a sample of data related to the problem 84
DMAIC Processes (continued) Analyze Cause-&-Effect Relationships o Collect a sample of data related to the problem 84
 Assessment of Current Cholesterol Screening at PSC Dr. Crouch ran an “Inquiry” in Centricity Sept. 8, 2010 to analyze cholesterol screening rates in 2007 -2010 for PSC adults seen between Sept. 8, 2009 & September 8, 2010, for each of our 4 care Pods. (LDL-C documented within past 3 years) 85
 86
86
 87
87
 88
88
 91
91
") Refinement of Inquiry o Changed screening interval to within 5 yrs (per NCEP guideline) o Focused on LDL-C screening rates for younger vs. older adults (upper cutpoint for men 35 y. o. , upper cutpoint for women 45 y. o. ) o Changed lower age limit to 25 (20 year olds were 15 y. o. five years ago) 92
Refinement of Inquiry o Changed screening interval to within 5 yrs (per NCEP guideline) o Focused on LDL-C screening rates for younger vs. older adults (upper cutpoint for men 35 y. o. , upper cutpoint for women 45 y. o. ) o Changed lower age limit to 25 (20 year olds were 15 y. o. five years ago) 92
 93
93
 94
94
 External Benchmarks for Cholesterol Screening • No proposed benchmark for an acceptable target cholesterol screening rate could be found. • Had to set an arbitrary improvement target in the absence of an external benchmark standard. 95
 Further Refinement of Inquiry o Decided to focus on LDL-C screening rates for young men & women ages 25 -34 (25 yr olds were only 20 years old 5 years ago) 96
 Developing an Internal Benchmark • The estimated standard deviation for LDL documentation rates for 25 -34 y. o. men & women for the 4 different pods at PSC is approximately 4%. • We decided that a reasonable goal would be to improve our LDL documentation rate by at least 1. 5 standard deviations (6%) over the 2005 -10 PSC documentation rate. 97
 Developing an Internal Benchmark • Decided to try to reduce the inter-Pod variability in LDL-C documentation rate by a relative reduction of 50% (absolute reduction of 7%). • This would reduce the difference between the highest and lowest Pod documentations rates from 14% to 7%. 98
 99
99
 Applying the DMAIC Processes Analyze Cause-&-Effect Relationships o Map the processes, if applicable o Conduct a root cause(s) analysis to identify reasons why the problem exists. 100
 Identifying the Root Cause/s of a Problem When trying to prevent unacceptable events from happening again: o 10% immediately seek to place blame o 26% express opinion of causes without investigating the cause/s of the problem o 50% ask why the problem happened, but o only 20% examined the problem in enough detail to identify an effective solution Ref: Research performed by James M. Stoutenburg as part of his graduate work in Instructional and Performance Technology at 101 Boise State University, Boise, Idaho, 1994.
 102") Process Map (or doesn’t) 102
Process Map (or doesn’t) 102
 103
103
 Do Phase: Try Improvement Step 1: Raise awareness o A noon conference, Oct 15, 2010 on the Quality Improvement Project for LDLC Elevation Detection was held to: ninform providers about baseline data nraise awareness of goals & methods nsolict provider feedback to fine-tune nsolicit cooperation with the QI process ndiscuss root causes of the problem 104
 PLAN: Root Cause Analysis o Preliminary root cause analysis identified numerous potential obstacles to cholesterol screening in young adults 105
 Hypothesized Root Causes o Not understanding cholesterol health risk o Some MDs believing that cholesterol is overrated as a CHD risk factor o Young pts being decades away from CHD o Young women being further away from CHD than men o Pessimism about dietary change lowering cholesterol o Reluctance to prescribe statins 106
 o Young") Hypothesized Root Causes for Low LDL-C Screening Rate in Young Adults (cont’d) o Young males not visiting doctor often o Young adults not requesting chol testing o Differences between NCEP & USPSTF recommendations for chol screening o Time pressure making cholesterol testing a low priority activity in young pt visits o Most MD’s placing low priority on CHD risk factor assessment in young adults 107
Hypothesized Root Causes for Low LDL-C Screening Rate in Young Adults (cont’d) o Young males not visiting doctor often o Young adults not requesting chol testing o Differences between NCEP & USPSTF recommendations for chol screening o Time pressure making cholesterol testing a low priority activity in young pt visits o Most MD’s placing low priority on CHD risk factor assessment in young adults 107
 o MD’s") Hypothesized Root Causes for Low LDL-C Screening Rate in Young Adults (cont’d) o MD’s not checking Logician flowsheet to see if young pt had LDL-C in past 5 yrs o MD not ordering lipids during WWE o MD not ordering lipids during male HPE o MD not ordering lipids during acute visit o Not ordering lipids during chronic visit 108
Hypothesized Root Causes for Low LDL-C Screening Rate in Young Adults (cont’d) o MD’s not checking Logician flowsheet to see if young pt had LDL-C in past 5 yrs o MD not ordering lipids during WWE o MD not ordering lipids during male HPE o MD not ordering lipids during acute visit o Not ordering lipids during chronic visit 108
 Other Root Causes for Low LDL-C Screening Rate in Young Adults o During the noon conference, we asked about other obstacles to cholesterol screening in young adults that we hadn’t thought of so far. 109
 Hypothesized Root Causes for Low LDL-C Screening Rate in Young Adults o Patients not getting ordered lipids done is a major ostacle to screening. (Duh!) n Most common cause of this is insisting on pt being fasting for the lipid profile (A substantial percentage don’t come back the next day, week, or month— maybe next year. ) 110
 Care Provider Survey o Survey Monkey Survey Oct. 14 -31, 2010 assessed knowledge, beliefs, attitudes, and behaviors related to cholesterol screening and further raised physician awareness of cholesterol screening in young adults. (Survey Monkey link was Emailed to all care providers at PSC) 111
 Root Cause Analysis Key Survey Monkey Survey Item o Care providers’ opinions about the relative importance of numerous hypothesized root causes for the low rate of cholesterol screening in young adults was elicited. 112
 113
113
 Identified Root Causes o For 25 -34 year-old patients, cholesterol screening is just “not on the radar” of either physicians or patients. o Most young adults and their care providers have a very low awareness of their long-term future risk for CHD. 114
 Identified Root Causes o Most MD’s place low priority on CHD risk factor assessment in young adults. n MD’s seldom think about long-term implications of high LDL cholesterol and/or family history of premature coronary heart disease when seeing young adults. 115
 Identified Root Causes n MD’s seldom think about the high risk synergy between cigarette smoking or oral tobacco use and even mildly elevated LDL cholesterol when seeing young adults. 116
 Plus Interventions Interim Feedback 117
 118
118
 Intervention Step #2 Faculty Development Seminar October 29, 2010 o QI philosophy & methods o Cholesterol QI Project n. Baseline performance at PSC n. Goals for QI intervention n. QI intervention methods o QI team responsibilities o Faculty preceptor responsibilities o Care provider responsibilities 119
 Do Phase: Try Out Improvement Project Overview 120
 Do Phase: Try Out Improvement o With permission of the Program Director and Clinic Director, we placed cholesterolscreening-awareness-raising signs in each examination room Monday, November 1, 2010 to prompt patients to ask about having their cholesterol checked. “Do you know your cholesterol numbers? If not, ask your doctor about having your blood cholesterol tested. ” 121
 122
122
 Do Phase: Try Out Improvement o Spanish language signs were also placed in each examination room to prompt patients to ask about having their cholesterol checked. “El colesterol alto en la sangre peude obstruir sus arterias. El colesterol alto sangre puede causar un ataque al corazon o al cerebro. ” “Como están sus niveles de colesterol? Si no, hable con su doctor sobre un examen de 123 colesterol. ”
 124
124
 Do Phase: Try Out Improvement o Program Director Dr. David Bauer wrote code for a “pop-up” Logician reminder to prompt the care provider to consider ordering a lipid profile for adult patients who do not have a LDL-C documented in the past 5 years. o The pop-up message due for lipid profile. “Patient appears to be was like this: Would you like to order a lipid profile now? ” (Clicking “yes” enters a lipid profile order). 125
 Do Phase: Try Out Improvement o Intervention Implementation n 3 months: Nov 2010 -Jan 2011 126
 Do Phase: Try Out Improvement o Project Pod coordinators initially urged & periodically (monthly X 3 mos. ) reminded faculty preceptors, while precepting, to: n Preview Logican record of each adult patient scheduled with each resident. n Check for flowsheet lipid values within previous 5 yrs. n Urge the resident care provider to order a lipid profile when appropriate. 127
 Do Phase: Try Out Improvement o Project Pod coordinators arranged for a template letter to be sent to each patient seen in their pod within the past year who has had no lipid profile within 5 years (Email or “Snail mail”) o Letter urged patient to come for office or lab visit at their earliest convenience to have lipid profile drawn & explained the rationale for cholesterol testing. 128
 Do Phase: Try Out Improvement o A lipid profile order was entered in the name of the patient’s primary care provider, printed, and enclosed with the letter. 129
 ran Logician inquiries") STUDY: Assess Effect of Improvement Intervention o Project coordinator (Dr. Crouch) ran Logician inquiries to conduct a postintervention Logician chart audit in February, May, August, & November 2011. o The rate of LDL-C documentation within 5 years was reassessed for patients seen in the past year. 130
STUDY: Assess Effect of Improvement Intervention o Project coordinator (Dr. Crouch) ran Logician inquiries to conduct a postintervention Logician chart audit in February, May, August, & November 2011. o The rate of LDL-C documentation within 5 years was reassessed for patients seen in the past year. 130
 STUDY: Assess Intervention Effect o The 3 -month QI intervention was associated with a 14. 4% absolute increase (from 39. 3% to 53. 7%) in cholesterol screening in adults aged 25 -34—a 3. 4 standard deviation increase (p<0. 01) for the practice overall o Similar improvement was seen for women (37% to 53%) and men (42% to 56%). 131
 STUDY: Assess Intervention Effect o A 6 -month recheck showed a mild decline to 48. 4%, but o Improvement was sustained at 9 -months (53. 2%) and 12 -months (51. 8%) from the intervention startup. o The care pod with the lowest baseline rate showed the greatest improvement (33% to 50%). 132
 133
133
 STUDY: Assess Intervention Effect o In 1 st 12 months, 85 pts (8% of 1, 080 screened) were newly detected to have LDL-C>130 (mean 160, median 147) o Number-needed-to-screen = 13 (to find one person with LDL-C>130) 134
 STUDY: Assess Impact o 7 patients (4 male, 3 female; 0. 6% of those screened) were found to have extreme LDL-C elevation of 195, 198, 204, 213, 231, 327, and 368, respectively. o Number-needed-to-screen = 155 (to find one person with LDL-C>190) 135
 usually identifies someone with genetic Type") STUDY: Assess Impact o Extreme LDL-C elevation (>190) usually identifies someone with genetic Type IIa heterozygous hypercholesterolemia o These individuals are at very high risk for early coronary heart diease and sudden death from heart attack n Clinical CHD onset average of: o 42 y. o. for men o 52 y. o. for women 136
STUDY: Assess Impact o Extreme LDL-C elevation (>190) usually identifies someone with genetic Type IIa heterozygous hypercholesterolemia o These individuals are at very high risk for early coronary heart diease and sudden death from heart attack n Clinical CHD onset average of: o 42 y. o. for men o 52 y. o. for women 136
 STUDY: Assess Payoff o Doing routine non-fasting lipid profiles = key improvement factor. o Monthly reminder Emails and progress reports sent during the intervention period to all clinic personnel seemed very helpful. o Mailed/Emailed letters to patients produced very little short-term yield. 137
 ACT to Sustain Improvement o Since the intervention produced a significant rise in the lipid screening rate for men & women aged 20 -34, strategies were developed for maintaining the higher screening rate long-term. o Quarterly reminder Emails and progress reports to all clinic personnel were the maintenance method. o Verbal encouragement from project team members reinforced desired change. 138
 ACT to Sustain Improvement o If the intervention had not produced a significant rise in the lipid screening rate for men 20 -34 & women 25 -44, a different (“better”) intervention would have been developed and carried out in the April-June 2011 timeframe. 139
 n") Next Steps for Our Program o Phase 2 of Cholesterol QI Program (2012) n Improve rate of documenting LDLC>130 on patients’ problem lists o Phase 3 of Cholesterol QI Program (2013) n Improve rate of statin prescribing and long-term statin adherence o Require each resident to work with a team to develop & implement QI project 140
Next Steps for Our Program o Phase 2 of Cholesterol QI Program (2012) n Improve rate of documenting LDLC>130 on patients’ problem lists o Phase 3 of Cholesterol QI Program (2013) n Improve rate of statin prescribing and long-term statin adherence o Require each resident to work with a team to develop & implement QI project 140
 Session Outline o o o o Introduction & Who We Are Our Opportunity Identified Principles of QI Experience of Other Residencies Physicians At Sugar Creek Experience Learning Activity QI Implementation Tips Summary 141
 Learning Activity: Part 1 o Select a QI project n topic, and n a particular care process or outcome that you believe to be substandard or suboptimal in your clinical setting. 142
 Learning Activity: Part 2 o Draw a care process map that includes key steps in the target care activity. (5 minutes for Steps 1 and 2) 143
 144") Process Map (or doesn’t) 144
Process Map (or doesn’t) 144
 Learning Activity: Part 3 o Draw a cause-effect diagram that includes key factors limiting and enhancing care quality for the target care process or outcome. (5 minutes) 145
 146
146
 Learning Activity: Part 4 o Working in pairs, conduct a root cause analysis to identify the most important modifiable underlying quality limiter for your target activity. (5 minutes for each person’s activity, total of 10 minutes) 147
 148
148
 Learning Activity: Part 5 o Identify 1 feasible, potentially effective intervention* intended to address the root cause of substandard quality of the targeted care process or outcome. (5 minutes for each person’s activity, total of 10 minutes) 149
 150
150
 Session Outline o o o o Introduction & Who We Are Our Opportunity Identified Principles of QI Experience of Other Residencies Physicians At Sugar Creek Experience Learning Activity QI Implementation Tips Summary 151
 Factors Promoting Intervention Success We believe that our PSC quality improvement intervention worked well because: o it was woven into the daily fabric of teaching and clinical routines in our Family Practice Center, and o faculty, residents, and staff were involved in development and implementation, with good buy-in from personnel at all levels. 152
 Educational & Practice Management Payoff for QI Work o Residency Review Committee requirements include practice-based learning and improvement as a new core competency. o Applying quality improvement (QI) methods to targeted patient care activities is one of 4 key processes for maintaining Level 3 Patient-Centered Medical Home (PCMH) certification. 153
 Questions and Comments o Questions? o Comments? 154
 Wrap-up o Thank you for your attendance & attention. 155
 Wrap-up o We would be happy to consult with you about QI questions. You can contact Michael Crouch at: o 281 -325 -4258 (w) 832 -282 -3101 (c) o Email: michael. crouch 46@gmail. com or michael. crouch@memorialhermann. org o Good luck to you in your quality improvement endeavors. (next slide) 156
 A Quality Improvement Blessing May the team rise up to join you, May the boss be always at your back, May the Force for Change be strong within you, The expectations optimistic, but realistic. And until we meet again, There’s always Email and the phone. 157
 References and Resources o Coleman MT, Nasraty S, Ostapchuk M, Wheeler S. introducing practice-based learning and improvement acgme core competencies into a family medicine residency curriculum. Joint Commission Journal Quality Patient Safety 2003; 29: 238 -247. o Mohr JJ, Randolph GD, Laughon MM, et al. Integrating improvement competencies into residency education: a pilot project from a pediatric continuity clinic. Ambul Pediatr 2003 May-Jun; 3: 131 -6. o Kuklina EV, Yoon PW, Keenan NL. Prevalence of coronary heart disease risk factors and screening for high cholesterol levels among young adults, United States 158 1999 -2006. Ann Fam Med 2010; 8: 327 -333.
 References and Resources o http: //www. brecker. com/quality. htm#iso o http: //www. ncbi. nlm. nih. gov/books/NBK 2682/ o http: //www. who. int/patientsafety/education/curriculum/wh o_mc_topic-7. pdf o http: //www. cdc. gov/ostlts/NPHIIMeeting/Quality. Im provement. html 159