

ed938d58879a371747f342622051a520.ppt
- Количество слайдов: 105
") Park Access State Program Training 2010 Division of Nutrition, Physical Activity and Obesity (DNPAO) March 19, 2010 Dee Merriam, FASLA Community Planner National Center for Environmental Health U. S. Centers for Disease Control and Prevention “The findings and conclusions in this presentation have not been formally disseminated by the Centers for Disease Control and Prevention and should not be construed to represent any agency determination or policy. ” F: # Active FilesCDCConferences2009 Oct 26 -28 - NEPH -AtlPP development
Park Access State Program Training 2010 Division of Nutrition, Physical Activity and Obesity (DNPAO) March 19, 2010 Dee Merriam, FASLA Community Planner National Center for Environmental Health U. S. Centers for Disease Control and Prevention “The findings and conclusions in this presentation have not been formally disseminated by the Centers for Disease Control and Prevention and should not be construed to represent any agency determination or policy. ” F: # Active FilesCDCConferences2009 Oct 26 -28 - NEPH -AtlPP development
 “No Place To Play” The Trust for Public Land 2004 study of children’s access to parks. Los Angeles Boston 97% Los Angeles 33%
 When you are walking – Distance Matters http: //www. swanydesign. com/Return. To. Oz/ toinks. blogdrive. com/
 Radial versus Network Analysis X . 25 mile radius PP slide courtesy of Doug Allen A
 Objective Using the City of Atlanta park system examine the difference in estimates of population served resulting from park service areas drawn using radial and network analysis.
 Methods Major Tasks: 1. Obtain GIS layer showing park boundaries 2. Identify eligible parks 3. Develop a typology of entrance types 4. Map entrances on air photos 5. Establish service areas -. 25 and. 5 mile radial and network service areas for each park and the city as a whole 6. Assign population to park service areas - used 2000 census data and proportional weighting
 Entrance Typology All - Primarily automobile but can serve pedestrians and maintenance vehicles Pedestrian - Serves only pedestrians – no motorized vehicle access Maintenance - Maintenance entrance only – usually gated Pedestrian/Maintenance - Maintenance entrance but pedestrian access is possible (no gates) Potential Pedestrian - No definitive entrance but terrain permits access
 Mapping Entrances • Located entrances using air photos • Field verified 61 parks Central Springvale
 Potential Pedestrian Access Points - Points along park boundary where entrance to park is possible (permitted by terrain) but no formal entrance exist - Usually placed at park corners - Not placed between existing entrances unless entrance fronts a street
 Potential Entrances
 Create Park Service Areas • Radial Buffer – draw polygon. 25 mile from park boundary • Network Buffers Measure. 25 mile along street network from entrances Black dots represent end points. 25 mile from closest entrance
 Create Park Service Areas ½ and ¼ Mile Network Buffers One Service Area per entrance is created (blue outlines) by connecting end points
 Create Park Service Areas • “Dips” are where two Network Service Areas meet • Individual Service Areas are merged into one PSA per park • Results in oddly shaped Service Area (blue outline)
 Replace with Perkerson
 Create Park Service Areas for the City as a Whole
 Assign Population to Park Service Areas
 met the study criteria that there must be") Findings 154 Parks (out of 345) met the study criteria that there must be a reason to enter the park. - A park bench, - A trail, - An open field, etc. Parks ranged from. 042 acres to 250 acres 18 parks were less than. 5 acres
Findings 154 Parks (out of 345) met the study criteria that there must be a reason to enter the park. - A park bench, - A trail, - An open field, etc. Parks ranged from. 042 acres to 250 acres 18 parks were less than. 5 acres
 Park Service Areas for the City as a Whole Radial Estimate of Population Served ¼ mile = 44% ½ mile = 79% Source: Center for Geographic Information Systems, Georgia Institute of Technology
 Park Service Areas for the City as a Whole Street Network Estimate of Population Served ¼ mile = 21% ½ mile= 51% Source: Center for Geographic Information Systems, Georgia Institute of Technology
 51% 79% 21% 44% City as a Whole Estimates of Population Served
 Correlation between Radial and Network Population Estimates for Specific Park Sites • Least Correlation ---- . 5% (Brownsmill) • Median --------- 44. 8% (Orme) • Greatest Correlation - 81. 8% (Hardy Ivy) % of radial population within network service area (network est/radial est)
 Least correlation – Brownsmill. 5% Population within the. 25 mile radial buffer = 2, 613 Population within the. 25 mile street network = 13
 Greatest Correlation- Hardy Ivy 81. 8% Population within the. 25 mile radial buffer = 482 Population within the. 25 mile street network = 394
 Most Population Served- Freedom Park Population within the. 25 mile radial buffer = 10, 524 Population within the. 25 mile street network = 6, 851
 Limitations • Assumes that population is equally distributed within census block groups • May miss access points (undercount) or identify entrances that are not usable (overcount. ) • Assumes all streets are walkable. • Assumes that all parks provide equal service
 Some streets do not invite walking.
 Parks Provide Different Levels of Service
 How This Analysis Can Be Used
 Find Service Gaps Radial Network
 Illustrates where access points can be added. Population within. 25 Radial Service Area = 4, 311 Population within. 25 mile Street Network Service Area = 2, 439
 Illustrates where access points can be added. Population within. 25 Radial Service Area = 4, 311 Population within. 25 mile Street Network Service Area = 2, 439
 Illustrates impact of adding a street. Population within. 25 Radial Service Area = 743 Population within. 25 mile Street Network Service Area = 25
 Illustrates impact of adding a street. Population within. 25 Radial Service Area = 743 Population within. 25 mile Street Network Service Area = 25
 Conclusions • In all cases radial analysis overstated service • At the system scale more precise maps provide clearer representation of service gaps • Distance tended to reduce the discrepancy between the radial and network estimates • At the site scale graphics illustrate where entrances can be added to expand service • Graphics show where street connectivity can be added to expand service
 Placing parks within a walkable distance Make Active Transportation -- Easy
 Access to parks--- Destinations Park 1 Geographic Location Park 2 3 Location in relation to the street 1. Have a park– some place to go 2. Give the park street frontage 3. Make the park easy to get to from many points in the neighborhood.
 Open space in backyards
 Open Space located in the back of lots is not visible or accessible. Street House Back Yards House Street Public Realm
 Photo from Desmond Dr
 Open Space that is commonly owned and highly visible and accessible. House Street Park Street House Public Realm
 Place park for maximum visibility and access. -Open Space fronts street -Lots are across the street which gives community access. -Connecting streets direct views to open space -Narrow lots front the greenspace. -Highest premium for lots with greatest access. Open space fronts street. It is highly visible and accessible.
 Putting the Principles to Work Original Site Concept • Access is through access alleys and likely around dumpsters. • Limited points to view the natural area. • Few of the residents have access. • The site is isolated.
 Putting the Principles to Work Revised Site Concept • Main Road fronts the open space. • Maximum natural surveillance • All residents have equal access. • The open space becomes a significant amenity.
 Walk route distance is important ! A X Dee Merriam 770 -488 -3981 dmerriam@cdc. gov www. cdc. gov/healthyplaces . 25 mile radius PP slide courtesy of Doug Allen

 City as a Whole Estimates of Population Served Distance from park Radial Estimate Network Estimate ¼ Mile = 44% 21% ½ Mile = 79% 51%
 Atlanta Statistics * Quarter mile Half mile Estimated population served radial estimate 181, 950 327, 869 Estimated population served network estimate 86, 883 211, 375 Radial estimate - network estimate r-n 95, 066 116, 494 109. 4% 55. 1% 47. 8% 64. 5% Network estimate % of pop served n/pop 20. 9% 50. 8% Radial estimate % of pop served r/pop 43. 7% 78. 7% % Radial overestimate (r-n)n Network estimate as % of radial estimate n/r * Population estimates based upon 2000 US Census; Total city population 416, 474
 F: # Active FilesPhotosResearch Photos12 -06 for Atlanta flyer/Mc. Kinley-Wilson Triangle – 5 -05
 Comparisons of Major Cities 2008 City Access* (% of population within. 25 mile radius of a Park) Acres / 1, 000 Park Acres as population % of land area New York 91. 0% 4. 6 19. 7% San Francisco 85. 0% 7. 8 19. 3% Boston 97. 0% 9. 2 17. 7% Los Angeles 33. 0% 6. 2 7. 9% 40. 0% Atlanta 7. 6 4. 3% Source: TPL, Atlanta data from Project Greenspace Note: TPL weighted the analysis of 7 cities captured the % of children served; Atlanta was not in the TPL study, Atlanta's analysis was for total population 51
 Putting the Principles to Work Original Site Concept Revised Site Concept

 Candace Rutt, PH. D. Centers for Disease Control") Neighborhood Parks and Active Living (NPAL) Candace Rutt, PH. D. Centers for Disease Control and Prevention
Neighborhood Parks and Active Living (NPAL) Candace Rutt, PH. D. Centers for Disease Control and Prevention
 Key Research Questions • Who uses parks and for what purposes? • To what extent do parks serve as venues for physical activity? • What factors predict park use and physical activity? Ecological Framework Individual factors Parks attributes Park connectivity Neighborhood attributes Other factors? ?
 Study design n Phase I: Descriptive study n n n In-park surveys Direct observation of physical activity GIS distances from home to parks
 Study parks • 12 parks selected from Atlanta metro county: De. Kalb County • Park selection goal: maximize variability on key factors – – – Size Facilities Programming SES Ethnicity of neighborhood Neighborhood configuration
 Phase I: Data Collection – June – August 2004 – 8 days per park • 4 weekdays • 4 weekend days – 14 hours per day (6: 30 AM – 8: 30 PM) – Intercept Surveys and Direct Observation
 Intercept surveys • Stationed at entrances and exits • 13 intercept questions • 6+years old • Spanish survey
 Direct Observation of Physical Activity Divided parks into activity scanning areas Recorded number crossing line on trail
 GIS Measures • Mapped address data from respondents • Indicated mode • Calculated closest distance to park from home via street network • Created ½ mile street network and “crow fly” buffers to conduct walkability measures
 What did we learn about our park users?
 Demographics Direct Observation Total: 15, 917 park users 37% Female 63% Male 9% Tee 50% 39% n Adu Chil 3% t dre Older
 Physical Activity Direct Observation 26% Sedentary 9% Vigorous 29% Moderate 35% Light
 Variation in park users and behaviors by parks
 Demographic") Binary Logistic Regression Outcome variables % Exercise (25% or less; greater than 25%) Demographic Age Race White (base) Black Other Ethnicity Gender Visits/week Travel behaviors Mode GIS travel dist. Environmental Walkable Neigh Pool Rec Center Trail Restrooms Dog Area 1. 9 (1. 5, 2. 5) 1. 9 (1. 3, 2. 8) 1. 8 (1. 1, 2. 8) 1. 2 (1. 0, 1. 5) 6. 6 (5. 4, 8. 1) 1. 3 (1. 001, 1. 7) 0. 95 (0. 94, 0. 97) Visits/week (fewer than 2 d/wk; Active Activities 2 or more d/wk) (active versus sed) 0. 29(0. 23, 0. 38) 1. 7 (1. 1, 2. 5) 5. 2 (4. 1, 6. 6) 1. 5(1. 02, 2. 15) 0. 40 (0. 22, 0. 73) 0. 38 (. 21, . 70) 2. 2 (1. 3, 3. 7) 1. 3 (1. 03, 1. 6) 0. 62 (0. 44, 0. 88) 2. 5 (1. 9, 3. 3) 0. 52 (0. 41, 0. 67)
Binary Logistic Regression Outcome variables % Exercise (25% or less; greater than 25%) Demographic Age Race White (base) Black Other Ethnicity Gender Visits/week Travel behaviors Mode GIS travel dist. Environmental Walkable Neigh Pool Rec Center Trail Restrooms Dog Area 1. 9 (1. 5, 2. 5) 1. 9 (1. 3, 2. 8) 1. 8 (1. 1, 2. 8) 1. 2 (1. 0, 1. 5) 6. 6 (5. 4, 8. 1) 1. 3 (1. 001, 1. 7) 0. 95 (0. 94, 0. 97) Visits/week (fewer than 2 d/wk; Active Activities 2 or more d/wk) (active versus sed) 0. 29(0. 23, 0. 38) 1. 7 (1. 1, 2. 5) 5. 2 (4. 1, 6. 6) 1. 5(1. 02, 2. 15) 0. 40 (0. 22, 0. 73) 0. 38 (. 21, . 70) 2. 2 (1. 3, 3. 7) 1. 3 (1. 03, 1. 6) 0. 62 (0. 44, 0. 88) 2. 5 (1. 9, 3. 3) 0. 52 (0. 41, 0. 67)
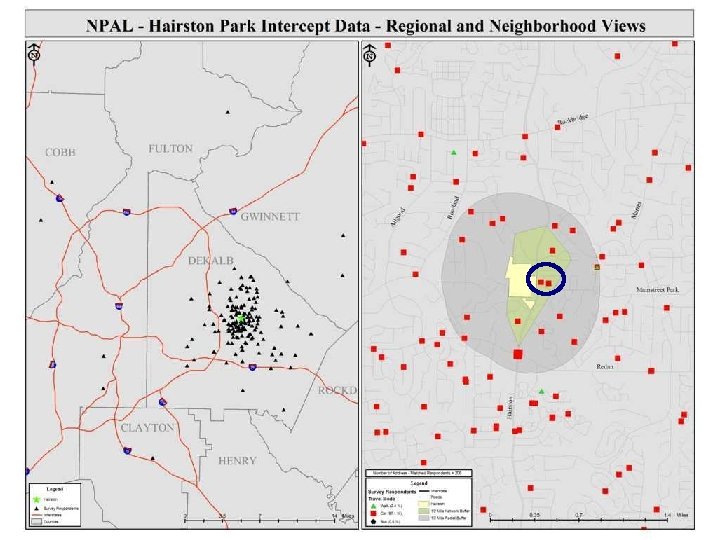
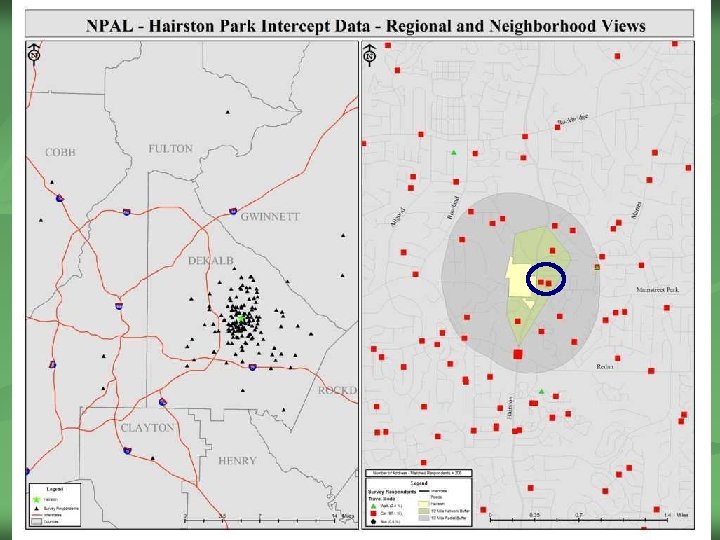
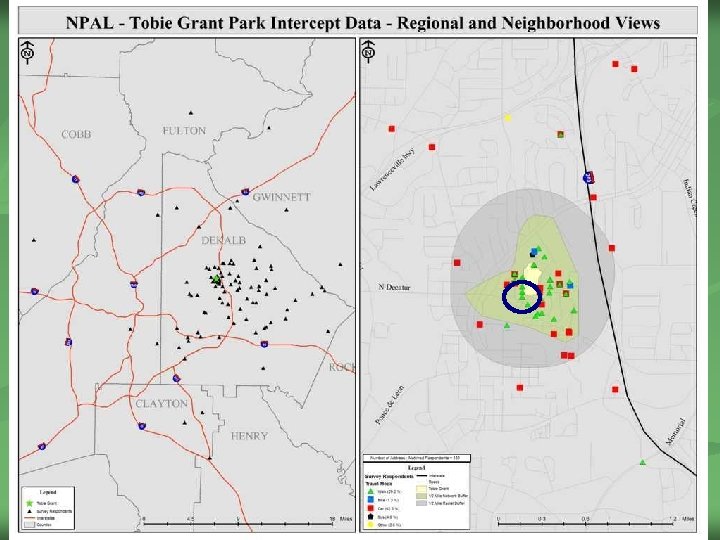
 Greater car use related to neighborhood characteristics and connectivity? Hairston Park Tobie Grant Park
 Cluster Analysis • Goal: identify homogenous subgroups of urban park users that are as different as possible from each other • 2 step cluster analysis – No a-prior number of groups – Large sample size (N=2, 930) – Continuous and categorical data
 Cluster Analysis • 19. 1% of sample in Cluster 1 – High intensity neighborhood exercisers • 23. 0% of sample in Cluster 2 – Moderate intensity neighborhood exercisers • 36. 7% of sample in Cluster 3 – Non-neighborhood sedentary child caregivers • 13. 3% of sample in Cluster 4 – Non-neighborhood sports enthusiasts
 Cluster Analysis • Cluster 1: High intensity neighborhood exercisers – – – Lived closer Younger Male White Non-motorized transportation Got more of their total pa at the park – Visit more frequently – More likely to engage in fitness/exercise, run/jog, bike, walk, pass through the park, and commute through the park
 Cluster Analysis n Cluster 2: Moderate intensity neighborhood exercisers n n n n n Lived closer Older Female White Non-Hispanic Non-motorized transportation Got more of their total pa at the park Visit more frequently More likely to engage in
 Cluster Analysis • Cluster 3: Non-neighborhood sedentary child caregivers – – – – Lived further from the park Use motorized transportation Younger Female Non-white Went less frequently Got less of their total pa at the park Were more likely to take their children to the park and playground, watch sports, swim, fish, camp, picnic, engage in community events, or other activities
 Cluster Analysis n Cluster 4: Non-neighborhood sports enthusiasts Lived further from the park n n n n Lived furthest from the park Use motorized transportation Younger Male Hispanic Went less frequently Got more of their total pa at the park Were more likely to play organized and nonorganized sports and disk golf.
 Cluster Analysis • Somewhat similar to study done by Emory and GT students – – Neighborhood exercisers (68. 2%) Sports enthusiasts (26. 0%) Community center aficionados (2. 8%) Leisure lovers (2. 8%)
 Conclusions • Activities engaged in and distance to the park were more important than most of the demographic variables • People tend to travel further to engage in certain types of activities (Giles-Corti & Donovan, 2002) • Can be used with social marketing to increase park use in different segments of the population
 Conclusions • Parks are an important venue for physical activity • People who live closer to parks use them more frequently and get more of their total physical activity at the park • Should encourage planners to place parks within neighborhoods with amenities than encourage physical activity, such as trails
 Multi-Institutional Collaborative Team Centers for Disease Control and Prevention Dr. Howard Frumkin, CDC Dr. Candace Rutt, CDC Laura Biazzo, CDC Shauntrelle Chappell, CDC Emory University Dr. Karen Mumford Dr. Lance Waller Georgia State University Dr. Amy Helling Georgia Institute of Technology Dr. Cheryl Contant Dr. Steve French Tony Giarrusso University of Georgia Dr. Steve Dempsey We gratefully acknowledge support from the Robert Wood Johnson Foundation Active Living Research Program
 Candace Rutt, PH. D. Centers for Disease Control") Neighborhood Parks and Active Living (NPAL) Candace Rutt, PH. D. Centers for Disease Control and Prevention
Neighborhood Parks and Active Living (NPAL) Candace Rutt, PH. D. Centers for Disease Control and Prevention
 Key Research Questions n n n Who uses parks and for what purposes? To what extent do parks serve as venues for physical activity? What factors predict park use and physical activity? Ecological Framework Individual factors Parks attributes Park connectivity Neighborhood attributes Other factors? ?
 Study design n Phase I: Descriptive study n n n In-park surveys Direct observation of physical activity GIS distances from home to parks
 Study parks n n 12 parks selected from Atlanta metro county: De. Kalb County Park selection goal: maximize variability on key factors n n n Size Facilities Programming SES Ethnicity of neighborhood Neighborhood configuration
 Phase I: Data Collection n n June – August 2004 8 days per park 4 weekdays n 4 weekend days n n n 14 hours per day (6: 30 AM – 8: 30 PM) Intercept Surveys and Direct Observation
 Intercept surveys • Stationed at entrances and exits • 13 intercept questions • 6+years old • Spanish survey
 Direct Observation of Physical Activity Divided parks into activity scanning areas Recorded number crossing line on trail
 GIS Measures • Mapped address data from respondents • Indicated mode • Calculated closest distance to park from home via street network • Created ½ mile street network and “crow fly” buffers to conduct walkability measures
 What did we learn about our park users?
 Demographics Direct Observation Total: 15, 917 park users 9% Teen 37% Female 63% Male 50% Adult 39% Children 3% Older Adult
 Physical Activity Direct Observation 9% Vigorous 26% Sedentary 29% Moderate 35% Light
 Variation in park users and behaviors by parks
 Demographic") Binary Logistic Regression Outcome variables % Exercise (25% or less; greater than 25%) Demographic Age Race White (base) Black Other Ethnicity Gender Visits/week Travel behaviors Mode GIS travel dist. Environmental Walkable Neigh Pool Rec Center Trail Restrooms Dog Area 1. 9 (1. 5, 2. 5) 1. 9 (1. 3, 2. 8) 1. 8 (1. 1, 2. 8) 1. 2 (1. 0, 1. 5) 6. 6 (5. 4, 8. 1) 1. 3 (1. 001, 1. 7) 0. 95 (0. 94, 0. 97) Visits/week (fewer than 2 d/wk; Active Activities 2 or more d/wk) (active versus sed) 0. 29(0. 23, 0. 38) 1. 7 (1. 1, 2. 5) 5. 2 (4. 1, 6. 6) 1. 5(1. 02, 2. 15) 0. 40 (0. 22, 0. 73) 0. 38 (. 21, . 70) 2. 2 (1. 3, 3. 7) 1. 3 (1. 03, 1. 6) 0. 62 (0. 44, 0. 88) 2. 5 (1. 9, 3. 3) 0. 52 (0. 41, 0. 67)
Binary Logistic Regression Outcome variables % Exercise (25% or less; greater than 25%) Demographic Age Race White (base) Black Other Ethnicity Gender Visits/week Travel behaviors Mode GIS travel dist. Environmental Walkable Neigh Pool Rec Center Trail Restrooms Dog Area 1. 9 (1. 5, 2. 5) 1. 9 (1. 3, 2. 8) 1. 8 (1. 1, 2. 8) 1. 2 (1. 0, 1. 5) 6. 6 (5. 4, 8. 1) 1. 3 (1. 001, 1. 7) 0. 95 (0. 94, 0. 97) Visits/week (fewer than 2 d/wk; Active Activities 2 or more d/wk) (active versus sed) 0. 29(0. 23, 0. 38) 1. 7 (1. 1, 2. 5) 5. 2 (4. 1, 6. 6) 1. 5(1. 02, 2. 15) 0. 40 (0. 22, 0. 73) 0. 38 (. 21, . 70) 2. 2 (1. 3, 3. 7) 1. 3 (1. 03, 1. 6) 0. 62 (0. 44, 0. 88) 2. 5 (1. 9, 3. 3) 0. 52 (0. 41, 0. 67)
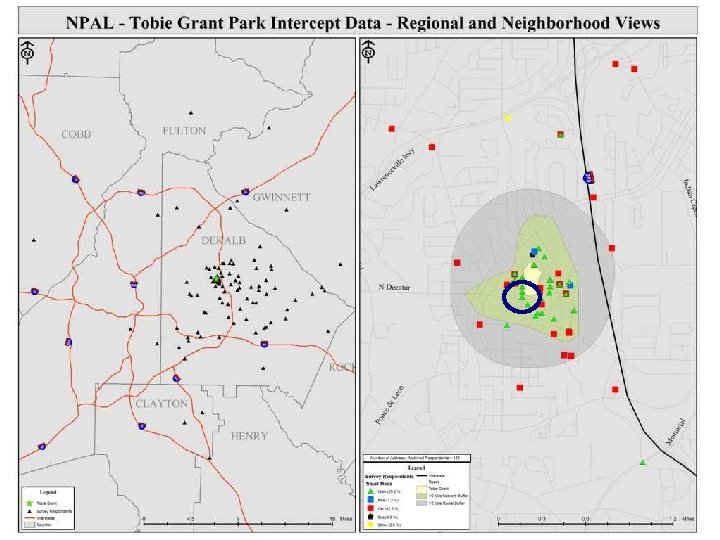
 Greater car use related to neighborhood characteristics and connectivity? Hairston Park Tobie Grant Park
 Cluster Analysis n n Goal: identify homogenous subgroups of urban park users that are as different as possible from each other 2 step cluster analysis n n n No a-prior number of groups Large sample size (N=2, 930) Continuous and categorical data
 Cluster Analysis n 19. 1% of sample in Cluster 1 n n 23. 0% of sample in Cluster 2 n n Moderate intensity neighborhood exercisers 36. 7% of sample in Cluster 3 n n High intensity neighborhood exercisers Non-neighborhood sedentary child caregivers 13. 3% of sample in Cluster 4 n Non-neighborhood sports enthusiasts
 Cluster Analysis n Cluster 1: High intensity neighborhood exercisers n n n n Lived closer Younger Male White Non-motorized transportation Got more of their total pa at the park Visit more frequently More likely to engage in fitness/exercise, run/jog, bike, walk, pass through the park, and commute through the park
 Cluster Analysis n Cluster 2: Moderate intensity neighborhood exercisers n n n n n Lived closer Older Female White Non-Hispanic Non-motorized transportation Got more of their total pa at the park Visit more frequently More likely to engage in fitness/exercise, walk their dog, and
 Cluster Analysis n Cluster 3: Non-neighborhood sedentary child caregivers n n n n Lived further from the park Use motorized transportation Younger Female Non-white Went less frequently Got less of their total pa at the park Were more likely to take their children to the park and playground, watch sports, swim, fish, camp, picnic, engage in community events, or other activities
 Cluster Analysis n Cluster 4: Non-neighborhood sports enthusiasts Lived further from the park n n n n Lived furthest from the park Use motorized transportation Younger Male Hispanic Went less frequently Got more of their total pa at the park Were more likely to play organized and nonorganized sports and disk golf.
 Cluster Analysis n Somewhat similar to study done by Emory and GT students n n Neighborhood exercisers (68. 2%) Sports enthusiasts (26. 0%) Community center aficionados (2. 8%) Leisure lovers (2. 8%)
 Conclusions n n n Activities engaged in and distance to the park were more important than most of the demographic variables People tend to travel further to engage in certain types of activities (Giles-Corti & Donovan, 2002) Can be used with social marketing to increase park use in different segments of the population
 Conclusions n n n Parks are an important venue for physical activity People who live closer to parks use them more frequently and get more of their total physical activity at the park Should encourage planners to place parks within neighborhoods with amenities than encourage physical activity, such as trails
 Multi-Institutional Collaborative Team Centers for Disease Control and Prevention Dr. Howard Frumkin, CDC Dr. Candace Rutt, CDC Laura Biazzo, CDC Shauntrelle Chappell, CDC Emory University Dr. Karen Mumford Dr. Lance Waller Georgia State University Dr. Amy Helling Georgia Institute of Technology Dr. Cheryl Contant Dr. Steve French Tony Giarrusso University of Georgia Dr. Steve Dempsey We gratefully acknowledge support from the Robert Wood Johnson Foundation Active Living Research Program