b9e1aebb5960bb23bc7a4e5204463bc6.ppt
- Количество слайдов: 23
 Pain Points of Product Conversion WHERE DO THOSE PRODUCTS COME FROM AND WHY THIS UNDERSTANDING IS A BIGGER PRIORITY MORE THAN EVER Brent Petty, CMRP Executive Industry Consultant Global Healthcare Team Lexmark International, Inc. Barbara Strain, CVAHP Director Value Management University of Virginia Health System
 Objectives This session will provide a roadmap for: 1. Reviewing the mix of products in the delivery of patient care and how to pinpoint where the value is and why. 2. Developing strategies using standard processes, purchase driven costs and patient outcomes helping drive the value to the organization will be understood. 3. Analyzing a criteria based decision matrix that will reveal critical success factors such as collaborating with clinical stakeholders, keeping supply chain management and finance in the loop and getting to a win-win solution.
 Where do those products come from?
 Origin of Products – know the why § Professional Meetings § Articles § New staff § Onboarding new physicians § New contract cycle § Supplier discontinues product § Benchmarking; price, utilization, strategic direction § Regulatory § Procedure change § Equipment – new or upgrade §Unresolvable product issues § Other, other, other
 How to Get to the What v. Nurses or other clinically trained staff employed by Supply Chain Management v. Physician liaison to or employed by/leads SCM v Alignment of institutional resources; finance, contracting, data analysts v. Value Analysis processes v. New Product Introduction standard work
 One example of a decision matrix
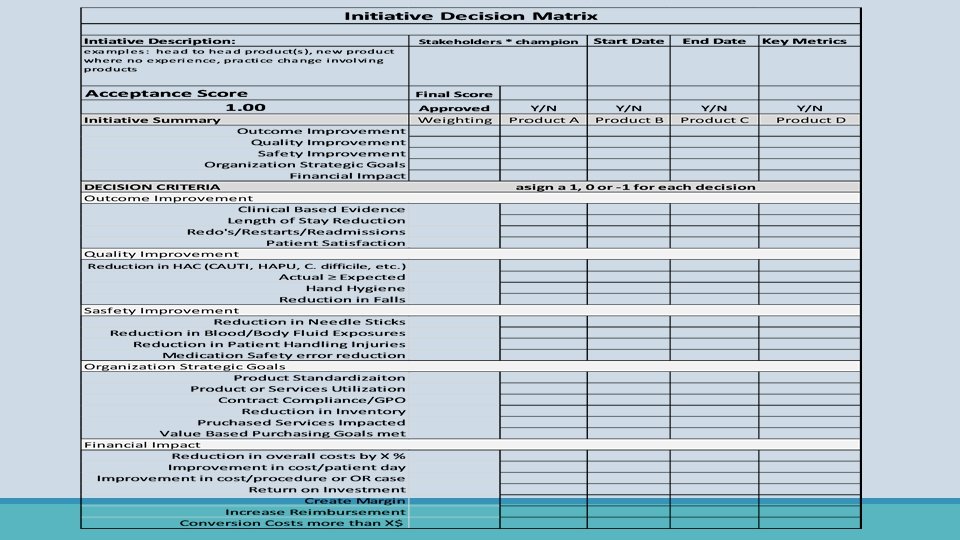
 Ø Choose what is the best fit for your organization and the initiative Decision Criteria OUTCOME IMPROVEMENT QUALITY IMPROVEMENT SAFETY IMPROVEMENT ORGANIZATION STRATEGIC GOALS FINANCIAL IMPACT • Clinical based evidence • Length of stay • Patient satisfaction • Physician alignment • Efficiency • Restarts/Redraws/Redo’s and Re-
 ØReduction of Hospital Acquired Infections • Be a member of the groups working on these initiatives Ø Actual performance vs Expected performance Decision Criteria OUTCOME IMPROVEMENT QUALITY IMPROVEMENT SAFETY IMPROVEMENT ORGANIZATION STRATEGIC GOALS FINANCIAL IMPACT • Apply to the initiative under review • Example Right Supply, Right Time üTime or timing to deliver supplies üTriggers/pars üPatient special needs Ø Hand Hygiene ØFalls Reduction
 Ø Reduce employee injuries sticks/exposures Decision Criteria OUTCOME IMPROVEMENT QUALITY IMPROVEMENT SAFETY IMPROVEMENT ORGANIZATION STRATEGIC GOALS FINANCIAL IMPACT • Employee Health • Workman’s Compensation • Staff temp pool expenses • Right product, Right procedure Ø Patient Handling • Shears • Staff injuries • Repositioning patient in bed • Transferring patient to stretcher/bed/chair • Up out of bed/down the hall
 Ø Product Standardization Ø Utilization of products or services Ø Contract compliance/GPO Decision Criteria OUTCOME IMPROVEMENT QUALITY IMPROVEMENT SAFETY IMPROVEMENT ORGANIZATION STRATEGIC GOALS FINANCIAL IMPACT Ø Reduce on hand inventory Ø Purchased Services
 Ø Decrease cost: • per patient day Decision Criteria OUTCOME IMPROVEMENT QUALITY IMPROVEMENT SAFETY IMPROVEMENT ORGANIZATION STRATEGIC GOALS FINANCIAL IMPACT • per procedure • per operative case • per CMI Ø Return On Investment – ROI • Net cost/savings of product • Net cost of conversion • Net improvement of initiative • Overall ROI Ø Create Margin • Physician Preference Items – PPI Ø Neutralize or Increase Reimbursement
 Plan the Work and Work the Plan
 Cross-Industry Comparison of Size, Quality & Productivity / Efficiency
 What do these numbers have in common? 0 86 1095 0 Died today - Ebola 86 Died today - Guns 1095 Died today Accidentally in US Hospitals
 The way IT is designed remains part of the problem! Tejal Gandhi, MD, president of the National Patient Safety Foundation and associate professor of medicine, Harvard Medical School, spoke at the hearing. WASHINGTON | July 18, 2014 • It's a chilling reality – one often overlooked in annual mortality statistics: Preventable medical errors persist as the No. 3 killer in the U. S. – third only to heart disease and cancer – claiming the lives of some 400, 000 people each year. At a Senate hearing Thursday, patient safety officials put their best ideas forward on how to solve the crisis, with IT often at the center of discussions. • Hearing members, who spoke before the Subcommittee on Primary Health and Aging, not only underscored the devastating loss of human life – more than 1, 000 people each day – but also called attention to the fact that these medical errors cost the nation a colossal --- $1 trillion each year!
 Too much waste in the U. S. healthcare system! ~$750 B 20 September. per year in waste in the US healthcare system, according to the Institute of Medicine. (25% of total U. S. healthcare spend) Unnecessary services: ~$210 Excess admin costs: ~$190 Inefficient delivery of care: ~$130 Inflated prices: ~$105 Fraud: ~$75 Prevention failures: ~$55 3 out of 10 68% of specialists receive no information from Primary Care physician prior to referral visit 60 -70% of referrals go unscheduled 25% of appointments are missed lab tests are reordered because results are lost! Institute of Medicine report: ‘Best Care at Lower Cost: The Path to Continuously Learning Health Care in America” 17
 Achieving a better way. … The single functional requirement for the design of a jet aircraft cockpit is to facilitate interaction between the decision – maker and the critical information. The cockpit design creates an environment that allows for efficient and reliable interaction.
") Comprehensive Care for Joint Replacement Model (CJR)
Comprehensive Care for Joint Replacement Model (CJR)
 Example --Scorecard Orthopedic
 Example --Scorecard Slipper Socks Scorecard Slipper socks MFG Price Parity Fall per QTR GOAL Measure Value GOAL Falls Measure Value GOAL Medicare Exp Reimbursement Margin per patient Measure Value GOAL Total Cost per patient Measure Value MSDRG Name Measure Value Total Supply Cost per Volume patient GOAL Floor A 400 A $1. 73 Floor 2 West B $1. 85 Floor ICU C $1. 68 Floor Step Down D 12 $2. 01 LEGEND Total SC Actual MSCM Total Cost GOAL MET = SC Goal 1 Std Deviation from Lowest Cost HPM GOAL UNMET = Margin Total or Exp Payment (greater) - SC + Direct Variable
 Session Wrap up: • Holistic Concerned with complete systems rather than with the analysis of or dissection into parts Wellmont Holston Valley Medical Center • • Value based healthcare is a reality – Payer based programs will drive increase focus on costeffectiveness of all aspects of care delivered – Patients as consumers will ultimately define value Increasing demand for clinical evidence and reducing variation to support products. Can you answer this question: – “In my bundled payment cases, this product will represent an increased cost that will directly reduce reimbursement. Why should I use it? ”