

1b55ec2e338d78f3f90e7343a08c89de.ppt
- Количество слайдов: 74
 Page 1
 Page 2
 Chiffre d'affaires (données publiées) 2004") Chiffre d’affaires données publiées aux données comparables (en M€) Chiffre d'affaires (données publiées) 2004 2005 Variation 412, 7 557, 9 + 35, 2% Effet de conversion ($ et £) 2, 7 Variation du périmètre (Entrée Algorithmics) CHIFFRE D'AFFAIRES (données comparables) - 68, 7 412, 7 491, 9 + 19, 2%
Chiffre d’affaires données publiées aux données comparables (en M€) Chiffre d'affaires (données publiées) 2004 2005 Variation 412, 7 557, 9 + 35, 2% Effet de conversion ($ et £) 2, 7 Variation du périmètre (Entrée Algorithmics) CHIFFRE D'AFFAIRES (données comparables) - 68, 7 412, 7 491, 9 + 19, 2%
 (en M€) 2004 2005 Variation FITCH GROUP 411,") Chiffre d’affaires par société (données publiées) (en M€) 2004 2005 Variation FITCH GROUP 411, 6 556, 1 + 35, 1% Fitch Ratings 403, 8 476, 6 + 18, 0% Algorithmics 7, 8 * 79, 5 Autres (société mère) 1, 1 1, 8 412, 7 557, 9 CHIFFRE D'AFFAIRES (données publiées) * Fitch Risk Management seule en 2004 + 35, 2%
Chiffre d’affaires par société (données publiées) (en M€) 2004 2005 Variation FITCH GROUP 411, 6 556, 1 + 35, 1% Fitch Ratings 403, 8 476, 6 + 18, 0% Algorithmics 7, 8 * 79, 5 Autres (société mère) 1, 1 1, 8 412, 7 557, 9 CHIFFRE D'AFFAIRES (données publiées) * Fitch Risk Management seule en 2004 + 35, 2%
 (en M€) 2004 2005 Variation FITCH GROUP 411,") Chiffre d’affaires par société (données comparables) (en M€) 2004 2005 Variation FITCH GROUP 411, 6 490, 1 + 19, 1% Fitch Ratings 403, 8 479, 1 + 18, 6% Algorithmics 7, 8 11, 0 + 41, 0% Autres (société mère) 1, 1 1, 8 412, 7 491, 9 CHIFFRE D'AFFAIRES (données comparables) + 19, 2%
Chiffre d’affaires par société (données comparables) (en M€) 2004 2005 Variation FITCH GROUP 411, 6 490, 1 + 19, 1% Fitch Ratings 403, 8 479, 1 + 18, 6% Algorithmics 7, 8 11, 0 + 41, 0% Autres (société mère) 1, 1 1, 8 412, 7 491, 9 CHIFFRE D'AFFAIRES (données comparables) + 19, 2%
 Chiffre d’affaires publié par zone géographique 2004 1 États-Unis 2 % 2005 % 241, 5 58, 5 % 297, 1 53, 3% Grande Bretagne 51, 5 12, 5 % 78, 6 14, 1% 3 Allemagne 11, 9 2, 9 % 20, 1 3, 6 % 4 Italie 9, 7 2, 3 % 14, 3 2, 6% 5 France 10, 0 2, 4 % 13, 6 2, 4% 6 Espagne 8, 6 2, 1 % 11, 0 2, 0% 7 Pays-Bas 6, 8 1, 7 % 11, 0 2, 0% Suisse 9, 2 2, 2 % 10, 7 1, 9% Mexique 5, 5 1, 3 % 10, 0 1, 8% 5, 7 1, 4 % 9, 2 1, 6% 8 9 10 Japon % du chiffre d'affaires publié total 87, 3% 85, 2%
 Chiffre d’affaires (données publiées) Autres") Du chiffre d’affaires au résultat opérationnel courant (en M€) Chiffre d’affaires (données publiées) Autres produits et charges d’exploitation Résultat opérationnel courant (données publiées) 2004 2005 Variation 412, 7 557, 9 + 35, 2% - 336, 6 - 450, 7 76, 1 107, 2 Effet de conversion ($ et £) 0, 7 14, 2 Variation du périmètre (Entrée Algorithmics) RÉSULTAT OPÉRATIONNEL COURANT (données comparables) + 40, 9% 76, 1 122, 1 + 60, 4%
Du chiffre d’affaires au résultat opérationnel courant (en M€) Chiffre d’affaires (données publiées) Autres produits et charges d’exploitation Résultat opérationnel courant (données publiées) 2004 2005 Variation 412, 7 557, 9 + 35, 2% - 336, 6 - 450, 7 76, 1 107, 2 Effet de conversion ($ et £) 0, 7 14, 2 Variation du périmètre (Entrée Algorithmics) RÉSULTAT OPÉRATIONNEL COURANT (données comparables) + 40, 9% 76, 1 122, 1 + 60, 4%
 (en M€) 2004 2005 Variation FITCH GROUP") Résultat opérationnel courant par société (données publiées) (en M€) 2004 2005 Variation FITCH GROUP 88, 4 120, 5 + 36, 3% Fitch Ratings 99, 1 149, 0 + 50, 4% Algorithmics - 10, 7 * - 28, 5 Autres (société mère) - 12, 3 - 13, 3 76, 1 107, 2 RÉSULTAT OPÉRATIONNEL COURANT (données publiées) * Fitch Risk Management seule en 2004 + 40, 9%
Résultat opérationnel courant par société (données publiées) (en M€) 2004 2005 Variation FITCH GROUP 88, 4 120, 5 + 36, 3% Fitch Ratings 99, 1 149, 0 + 50, 4% Algorithmics - 10, 7 * - 28, 5 Autres (société mère) - 12, 3 - 13, 3 76, 1 107, 2 RÉSULTAT OPÉRATIONNEL COURANT (données publiées) * Fitch Risk Management seule en 2004 + 40, 9%
 (en M€) 2004 2005 Variation FITCH GROUP") Résultat opérationnel courant par société (données comparables) (en M€) 2004 2005 Variation FITCH GROUP 88, 4 135, 4 + 53, 2% Fitch Ratings 99, 1 149, 7 + 51, 1% Algorithmics - 10, 7 - 14, 3 - 33, 6% Autres (société mère) - 12, 3 - 13, 3 76, 1 122, 1 18, 4% 24, 8% RÉSULTAT OPÉRATIONNEL COURANT (données comparables) Marge opérationnelle (ROC / CA) + 60, 4%
Résultat opérationnel courant par société (données comparables) (en M€) 2004 2005 Variation FITCH GROUP 88, 4 135, 4 + 53, 2% Fitch Ratings 99, 1 149, 7 + 51, 1% Algorithmics - 10, 7 - 14, 3 - 33, 6% Autres (société mère) - 12, 3 - 13, 3 76, 1 122, 1 18, 4% 24, 8% RÉSULTAT OPÉRATIONNEL COURANT (données comparables) Marge opérationnelle (ROC / CA) + 60, 4%
 (en M€) Résultat opérationnel courant") Du résultat opérationnel courant au résultat opérationnel (données publiées) (en M€) Résultat opérationnel courant 2004 2005 Variation 76, 1 107, 2 + 40, 9% 2, 2 - 1, 2 78, 3 106, 0 (données publiées) Autres produits et charges opérationnels RÉSULTAT OPÉRATIONNEL (données publiées) + 35, 4%
Du résultat opérationnel courant au résultat opérationnel (données publiées) (en M€) Résultat opérationnel courant 2004 2005 Variation 76, 1 107, 2 + 40, 9% 2, 2 - 1, 2 78, 3 106, 0 (données publiées) Autres produits et charges opérationnels RÉSULTAT OPÉRATIONNEL (données publiées) + 35, 4%
 (en M€) 2004 2005 78, 3") Du résultat opérationnel au résultat net (données publiées) (en M€) 2004 2005 78, 3 106, 0 Coût de l’endettement financier - 18, 2 - 18, 1 Autres produits et charges financiers - 3, 5 0, 3 Charge d’impôt 6, 9 - 40, 3 Résultat net des sociétés mises en équivalence 0, 4 0, 5 Résultat net des sociétés cédées ou en cours de cession - 14, 9 9, 4 Intérêts minoritaires - 2, 6 - 0, 2 46, 4 57, 6 Résultat opérationnel (données publiées) RÉSULTAT NET – Part Groupe (données publiées)
Du résultat opérationnel au résultat net (données publiées) (en M€) 2004 2005 78, 3 106, 0 Coût de l’endettement financier - 18, 2 - 18, 1 Autres produits et charges financiers - 3, 5 0, 3 Charge d’impôt 6, 9 - 40, 3 Résultat net des sociétés mises en équivalence 0, 4 0, 5 Résultat net des sociétés cédées ou en cours de cession - 14, 9 9, 4 Intérêts minoritaires - 2, 6 - 0, 2 46, 4 57, 6 Résultat opérationnel (données publiées) RÉSULTAT NET – Part Groupe (données publiées)
 Page 12
 Historique u Fondation de Fimalac en 1991 u Création d’un département de notation financière : début 1992 u Fimalac acquiert IBCA (Angleterre) : fin 1992 u u u Acquisition de Fitch (USA) par Fimalac : en 1997 => fusion avec Fitch : création de “Fitch Ibca” Acquisition de Duff & Phelps (USA) en 2000 => fusion avec “Fitch Ibca” et création de “Fitch Ibca Duff & Phelps” Acquisition de Bankwatch (Canada) : fin 2000 => “Fitch Ibca Duff & Phelps” prend le nom simplifié de “Fitch Ratings”
 Croissance du chiffre d'affaires In $ Mil $693 $511 $455 $356
 In $ Mil") Croissance du résultat opérationnel courant (EBIT) In $ Mil
Croissance du résultat opérationnel courant (EBIT) In $ Mil
 Structure de Fitch Group FITCH GROUP 100 % FITCH RATINGS 100 % ALGORITHMICS Y compris Fitch Risk Management
 en M$ 2004 2005 %") Du chiffre d'affaires au résultat opérationnel courant (données publées) en M$ 2004 2005 % variation 2005 vs. 2004 511, 3 - 227, 5 - 95, 3 692, 6 - 325, 6 - 134, 2 + 35, 5 % - 322, 8 - 459, 8 188, 5 232, 8 Provision intéressement - 67, 7 - 53, 2 Dépréciations & amortissements - 11, 0 - 29, 5 109, 8 150, 1 Normes IAS Chiffre d’Affaires (données publiées) Charges de personnel Autres charges externes Total charges EBITDA (données publiées) Résultat Opérationnel Courant (données publiées) + 23, 5 % + 36, 7 %
Du chiffre d'affaires au résultat opérationnel courant (données publées) en M$ 2004 2005 % variation 2005 vs. 2004 511, 3 - 227, 5 - 95, 3 692, 6 - 325, 6 - 134, 2 + 35, 5 % - 322, 8 - 459, 8 188, 5 232, 8 Provision intéressement - 67, 7 - 53, 2 Dépréciations & amortissements - 11, 0 - 29, 5 109, 8 150, 1 Normes IAS Chiffre d’Affaires (données publiées) Charges de personnel Autres charges externes Total charges EBITDA (données publiées) Résultat Opérationnel Courant (données publiées) + 23, 5 % + 36, 7 %
 En M$ Normes IAS 2004 2005 511, 3 692,") Résultats par société (données publiées) En M$ Normes IAS 2004 2005 511, 3 692, 6 Fitch. Ratings 501, 5 593, 6 Algorithmics 9, 8 99, 0 188, 5 232, 8 Fitch. Ratings 197, 5 247, 6 Algorithmics - 9, 0 - 14, 8 109, 8 150, 1 Fitch. Ratings 123, 1 185, 6 Algorithmics - 13, 3 - 35, 5 Chiffre d’Affaires FITCH GROUP EBITDA FITCH GROUP Résultat opérationnel courant FITCH GROUP % variation 2005 vs. 2004 + 18, 4 % + 25, 4 % + 50, 8 %
Résultats par société (données publiées) En M$ Normes IAS 2004 2005 511, 3 692, 6 Fitch. Ratings 501, 5 593, 6 Algorithmics 9, 8 99, 0 188, 5 232, 8 Fitch. Ratings 197, 5 247, 6 Algorithmics - 9, 0 - 14, 8 109, 8 150, 1 Fitch. Ratings 123, 1 185, 6 Algorithmics - 13, 3 - 35, 5 Chiffre d’Affaires FITCH GROUP EBITDA FITCH GROUP Résultat opérationnel courant FITCH GROUP % variation 2005 vs. 2004 + 18, 4 % + 25, 4 % + 50, 8 %
 Page 19
 Entrée de Hearst au capital de Fitch Group Prise de participation minoritaire de 20 % dans Fitch Group
 Valeur de la transaction en M$ Valorisation Fitch Group transaction 100% 20% EBITDA FITCH RATINGS 247, 6 Multiple Moody's 17, 2 x Valeur d'entreprise Fitch Ratings 4 259 Valeur d'entreprise Algorithmics 175 4 434 Valeur d'entreprise FITCH GROUP Décote minoritaire -1 080 Dette nette estimée au closing -234 Provision intéressement cumulée estimée au closing -162 4 038 2 958 Valeur Nette 100% FITCH GROUP Valeur Nette 20% FITCH GROUP 592
 Valorisation de Fitch Group parité : 1€ = 1, 2$ Valeur d'entreprise FITCH GROUP Valorisation Fitch selon transaction 4 434 Décote appliquée sur Moody's Moyenne Analystes 2 832 3 596 3 159 2 104 2 679 2 350 -234 Provision intéressement cumulée estimée Moyenne Analystes Etrangers (2) 0% Dette nette estimée Moyenne Analystes Français (1) -162 Valeur Nette FITCH GROUP en M$ 4 038 Valeur Nette FITCH GROUP en M€ 3 365 (1) CAI Cheuvreux, Exane BNP Paribas, Fideuram Wargny, Oddo Securities. (2) Cazenove, Dawnay Day Lockhart et UBS.
 Valorisation de Fimalac parité : 1€ = 1, 2$ Valorisation Fitch selon transaction Valeur Nette FITCH GROUP en M€ 3 365 Valeur Nette 80% FITCH GROUP (ap. impôts) ap. Moyenne Analystes Français (1) Moyenne Analystes Etrangers (2) Moyenne Analystes 2 104 2 679 2 350 2 650 Trésorerie cession 20% FITCH GROUP (ap. impôts) ap. + 467 Trésorerie, autres actifs et passifs de Fimalac + 133 ANR FIMALAC en M€ = 3 250 = 2 237 = 2 812 = 2 483 37, 5 Cours théorique en € 86, 7 59, 7 75, 0 66, 2 Cours au 28/02/06 en € 66, 3 Potentiel de hausse 31% 45% 16% 31% Nbre de titres FIMALAC (en millions) (après annulation de 400 000 titres) (1) CAI Cheuvreux, Exane BNP Paribas, Fideuram Wargny, Oddo Securities. (2) Cazenove, Dawnay Day Lockhart et UBS.
 Les aspects contractuels u u Opération soumise à l’accord des autorités de la concurrence, closing prévu fin avril 2006 Les aspects contractuels
 Page 25
 Des indicateurs opérationnels en forte croissance en 2005 • Chiffre d'affaires : • Résultat opérationnel courant : + 60, 4 % • Les ratios opérationnels du groupe se sont améliorés : + 19, 2 % 2004 üRésultat opérationnel courant / Chiffre d'affaires 18, 4 % üRésultat net / Capitaux propres (données publiées) 10, 1 % • 2005 24, 8 % 12, 5 % Augmentation du dividende de 19 % à 1, 25 € par action A données comparables
 Dividende ordinaire par action
 Cours comparés – Fimalac, CAC 40 & SBF 120 de Décembre 1992 à Février 2006 - Base 100 FIMALAC 1 312 SBF 120 304 CAC 40 273 5 6 3 4 5 6 7 8 9 0 2 1 2 3 4 -9 c-9 c-9 c-9 c-0 c-0 c Dé Dé Dé Dé
 Cours comparés – Fimalac, CAC 40 & SBF 120 de janvier 2005 à février 2006 - Base 100 au 28/02/2006 FIMALAC 188 SBF 120 135 CAC 40 131 6 6 5 5 5 5 -0 v-05 r-05 ai-0 n-0 l-05 û-0 pt-0 t-05 v-0 c-0 v-0 év-0 v an Fé Ma Av M Jui Ao Se Oc No Dé Jan F J
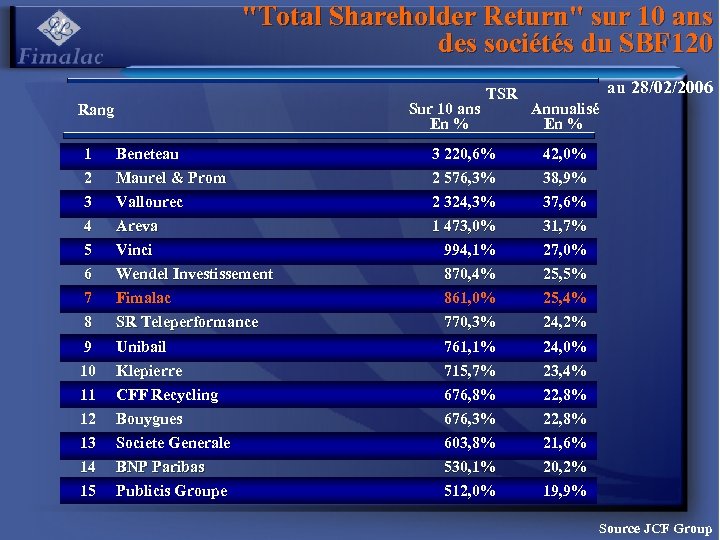 "Total Shareholder Return" sur 10 ans des sociétés du SBF 120 au 28/02/2006 TSR Sur 10 ans Annualisé En % Rang 1 2 Beneteau Maurel & Prom 3 220, 6% 2 576, 3% 42, 0% 38, 9% 3 4 Vallourec Areva 2 324, 3% 1 473, 0% 37, 6% 31, 7% 5 6 Vinci Wendel Investissement 994, 1% 870, 4% 27, 0% 25, 5% 7 8 Fimalac SR Teleperformance 861, 0% 770, 3% 25, 4% 24, 2% 9 10 Unibail Klepierre 761, 1% 715, 7% 24, 0% 23, 4% 11 12 CFF Recycling Bouygues 676, 8% 676, 3% 22, 8% 13 14 Societe Generale BNP Paribas 603, 8% 530, 1% 21, 6% 20, 2% 15 Publicis Groupe 512, 0% 19, 9% Source JCF Group
 Page 31
 IAS Norms % of 2005 total 2004") Revenue by Segment (in millions of US$) IAS Norms % of 2005 total 2004 change 2005/2004 Structured Finance 267, 5 324, 9 21, 5% 54, 7% Corporate Finance 143, 4 163, 7 14, 2% 27, 6% Public Finance/Sovereigns 34, 8 40, 9 17, 5% 6, 9% Subscriptions / Training 55, 8 64, 1 14, 9% 10, 8% 501, 5 593, 6 18, 4% 100% TOTAL FITCH RATINGS
Revenue by Segment (in millions of US$) IAS Norms % of 2005 total 2004 change 2005/2004 Structured Finance 267, 5 324, 9 21, 5% 54, 7% Corporate Finance 143, 4 163, 7 14, 2% 27, 6% Public Finance/Sovereigns 34, 8 40, 9 17, 5% 6, 9% Subscriptions / Training 55, 8 64, 1 14, 9% 10, 8% 501, 5 593, 6 18, 4% 100% TOTAL FITCH RATINGS
 IAS Norms change % of 2005/2004 2005") Revenue by Region (in millions of US$) IAS Norms change % of 2005/2004 2005 total 2004 2005 North America 291, 4 342, 0 17, 4% 57, 6% Europe, Middle East & Africa 175, 1 207, 9 18, 7% 35, 0% Latin America 19, 1 24, 0 25, 7% 4, 0% Asia Pacifica 15, 9 19, 7 23, 9% 3, 3% 501, 5 593, 6 18, 4% 100 % TOTAL FITCH RATINGS
Revenue by Region (in millions of US$) IAS Norms change % of 2005/2004 2005 total 2004 2005 North America 291, 4 342, 0 17, 4% 57, 6% Europe, Middle East & Africa 175, 1 207, 9 18, 7% 35, 0% Latin America 19, 1 24, 0 25, 7% 4, 0% Asia Pacifica 15, 9 19, 7 23, 9% 3, 3% 501, 5 593, 6 18, 4% 100 % TOTAL FITCH RATINGS
 (in millions of US$) 2004 2005 % change 2005 vs. 2004") Key Figures (reported) (in millions of US$) 2004 2005 % change 2005 vs. 2004 Revenue (reported) 501, 5 593, 6 + 18, 4 % EBITDA (reported) 197, 5 247, 6 + 25, 4 % 39, 4 % 41, 7 % 123, 1 185, 6 24, 5 % 31, 3 % IAS Norms EBITDA margin Current Operating Income (reported) Current Operating Income margin + 50, 8 %
Key Figures (reported) (in millions of US$) 2004 2005 % change 2005 vs. 2004 Revenue (reported) 501, 5 593, 6 + 18, 4 % EBITDA (reported) 197, 5 247, 6 + 25, 4 % 39, 4 % 41, 7 % 123, 1 185, 6 24, 5 % 31, 3 % IAS Norms EBITDA margin Current Operating Income (reported) Current Operating Income margin + 50, 8 %
 700 600 500 400") Revenue and Current Operating Income Growth (in millions of US$) 700 600 500 400 300 200 100 - Operating Margin 1997 1998 1999 2000 2001 Revenue 21% 26% 25% 2002 2003 2004 2005 Operating Income 23% 25% 31%
Revenue and Current Operating Income Growth (in millions of US$) 700 600 500 400 300 200 100 - Operating Margin 1997 1998 1999 2000 2001 Revenue 21% 26% 25% 2002 2003 2004 2005 Operating Income 23% 25% 31%
 Drivers of Debt Capital Markets Growth Drivers of recent and future growth in debt capital markets u u Macroeconomic drivers Ø Worldwide economic growth Ø Levels of real interest rates Ø Levels of capital spending Ø Merger and acquisition activity Ø Deregulation Market structure drivers Ø Innovation (e. g. , new instruments) in the debt capital markets Ø Growth of securitization Ø Disintermediation of markets Ø Increased availability of financial information Ø Demand from “new money” investors
 Points of Differentiation BMA survey: Majority of investors believe 3 ratings is ideal Source: Bond Market Association Rating Industry Day, February 2006
 Source: Moody’s Investor Presentation, March 2006") Market Share By Revenue (First Nine Months 2005) Source: Moody’s Investor Presentation, March 2006
Market Share By Revenue (First Nine Months 2005) Source: Moody’s Investor Presentation, March 2006
 Fitch 2005 Market Share (By Issuance Dollar Volume) Source: SDC, Bondware,") Market Share (continued) Fitch 2005 Market Share (By Issuance Dollar Volume) Source: SDC, Bondware, Fitch
Market Share (continued) Fitch 2005 Market Share (By Issuance Dollar Volume) Source: SDC, Bondware, Fitch
 Key 2005 Accomplishments Greater Institutional Acceptance – Transitioning the Market to a Three Rating Environment u u Inclusion in key fixed income indexes Ø Lehman Brothers, Merrill Lynch, Banc of America, i. Traxx, i. Boxx, Bond Buyer, NASD Bloomberg Corporate Bond Indices, etc. Inclusion in institutional investor investment guidelines Ø 56% of top 100 institutional investors have changed or are in process of changing Ø 78% of top 50 public pension fund investors have changed or are in process of changing Ø Calpers, Citigroup, Dreyfus, Fidelity, PIMCO, TIAA-CREF, etc.
 Key Rating Initiatives u u u Recovery ratings Ø Created") Key 2005 Accomplishments (continued) Key Rating Initiatives u u u Recovery ratings Ø Created two new types of ratings – issuer default ratings and recovery ratings Ø Being rolled out across all corporate, utility, bank and insurance sectors Credit derivatives Ø Valuspread acquisition provides data for analysis and a commercial platform Ø Content additions to Fitch. CDx, Fitch’s online hub of credit derivatives information Ø RAPCD announced March 15, will provide integrated platform for credit and market risk in growing synthetic CDO market Quantitative financial research Ø Invested in 2005 to build QFR teams in NY and London Ø Focused on structured finance, but also involved in other areas Ø Focused on updating current Fitch internal and external models plus building new solutions
Key 2005 Accomplishments (continued) Key Rating Initiatives u u u Recovery ratings Ø Created two new types of ratings – issuer default ratings and recovery ratings Ø Being rolled out across all corporate, utility, bank and insurance sectors Credit derivatives Ø Valuspread acquisition provides data for analysis and a commercial platform Ø Content additions to Fitch. CDx, Fitch’s online hub of credit derivatives information Ø RAPCD announced March 15, will provide integrated platform for credit and market risk in growing synthetic CDO market Quantitative financial research Ø Invested in 2005 to build QFR teams in NY and London Ø Focused on structured finance, but also involved in other areas Ø Focused on updating current Fitch internal and external models plus building new solutions
 Key Rating Initiatives (continued) u u VECTOR version 2. 2") Key 2005 Accomplishments (continued) Key Rating Initiatives (continued) u u VECTOR version 2. 2 released for CDO market Insurance Q Ratings Ø Built on success of QIFS ratings in Europe with U. S. rollout Ø Furthers market transparency by providing information on insurers of all size u u u Introduced two measures of banking system vulnerability – Banking System Indicator and Macro Prudential Indicator Continued expansion in high yield, leveraged loans and covered bonds International Securitisation Report and Structured Finance International best structured finance rating agency awards – again Products & Services u u Focused on identifying opportunities to complement core products -- Fitch Research and Ratings Delivery Service -- with new products and services Launched three structured finance-focused products in 2005 Ø Bond Compare, FASTracker, ABCP SMART
Key 2005 Accomplishments (continued) Key Rating Initiatives (continued) u u VECTOR version 2. 2 released for CDO market Insurance Q Ratings Ø Built on success of QIFS ratings in Europe with U. S. rollout Ø Furthers market transparency by providing information on insurers of all size u u u Introduced two measures of banking system vulnerability – Banking System Indicator and Macro Prudential Indicator Continued expansion in high yield, leveraged loans and covered bonds International Securitisation Report and Structured Finance International best structured finance rating agency awards – again Products & Services u u Focused on identifying opportunities to complement core products -- Fitch Research and Ratings Delivery Service -- with new products and services Launched three structured finance-focused products in 2005 Ø Bond Compare, FASTracker, ABCP SMART
 Key 2006 Initiatives Structured Finance Initiatives u u Updated RMBS model Revised VECTOR CDO model RAPCD for synthetic CDOs Continue to build QFR team Corporate/Financial Institution Initiatives u u Continued recovery ratings implementation Insurance capital model Financial guaranty capital model Expand in high yield and leveraged loan markets Business Development Initiatives u u Build on index and investment guideline inclusion momentum Grow products and services
 Regulatory Update U. S. u SEC continues its ongoing review of the appropriate level of regulation for ratings agencies Released for public comment Proposed Rule on definition of NRSRO in April 2005 Ø Produced technical assistance for Congress relating to SEC statutory authority in June 2005 Ø u “Credit Rating Agency Duopoly Relief Act of 2005” introduced in House in June 2005 Hearings held in 2005; additional hearings in House possible in 2006 Ø Senate hearing held March 7 Ø International u European Parliament asked EU Commission to assess need for rating agency legislation in 2004 Ø u EU Commission announced it will not propose new legislation to regulate but will monitor compliance with existing and self-regulatory rules IOSCO published Code of Conduct Fundamentals for Credit Rating Agencies in December 2004 Ø Fitch supports the IOSCO approach ; published its official Code of Conduct in January 2005
 Market Outlook u Long-term secular outlook remains favorable but cyclical factors may induce some volatility u Continued worldwide economic growth u Potential for rising real interest rates u Increased M&A activity u Basel II u u BMA projects 13% decline in total US issuance volume in 2006 (driven by RMBS) EMEA issuance outlook more positive, particularly in structured finance
 Goals u u Continue to capitalize on overall institutionalization efforts Maintain and grow market share across all key segments and region Ø Revised models should drive incremental ratings share u Enhanced pricing flexibility u Continue to grow revenue from products and services u Fitch Ratings: 10 -12% revenue growth annually Ø US: 8 -10% Ø International: 20%
 Algorithmics Incorporated Page 47
 Algorithmics Incorporated (in millions of US$) 2004 2005 Revenue (reported) 9,") Key Figures (reported) Algorithmics Incorporated (in millions of US$) 2004 2005 Revenue (reported) 9, 8 99, 0 EBITDA (reported) - 9, 0 - 14, 8 Current Operating Income (reported) - 13, 3 - 35, 5 IAS Norms Note: 2004 includes FRM only. 2005 reflects only ~11 months of Algorithmics revenue, an adjustment of the revenue recognition policy, and $15. 7 million amortization charge associated with acquired Algo IP
Key Figures (reported) Algorithmics Incorporated (in millions of US$) 2004 2005 Revenue (reported) 9, 8 99, 0 EBITDA (reported) - 9, 0 - 14, 8 Current Operating Income (reported) - 13, 3 - 35, 5 IAS Norms Note: 2004 includes FRM only. 2005 reflects only ~11 months of Algorithmics revenue, an adjustment of the revenue recognition policy, and $15. 7 million amortization charge associated with acquired Algo IP
 IAS Norms Revenue by Region") Algorithmics Incorporated (in millions of US$) IAS Norms Revenue by Region
Algorithmics Incorporated (in millions of US$) IAS Norms Revenue by Region
 Algorithmics Incorporated Overview Algorithmics strives to be the single most respected and widely used provider of risk management solutions in the world. u Founded in 1989, a recognized leader in enterprise risk management u 660 professionals in 18 global offices u Serves the global financial services industry u Over 300 solutions clients including 70 of the world’s largest banks
 Algorithmics Incorporated Recognized Leadership “The broadest and deepest offering available for Basel II. . . advanced features and technology. . . an integrated approach to market, credit, and operational risk, but also delivers data and sophisticated analytics/models. “ Source: Celent, February 2006
 Algorithmics Incorporated Recognized Leadership " Algorithmics stands in the Leaders quadrant due to proven implementation capability, functional breadth across the entire Basel II criteria solution architecture, and its deep domain and issue knowledge. " Source: Gartner, September 2005
 Algorithmics Incorporated Financial Institution of the Future Today Do business and then compute risk. Tomorrow Compute risk and then do business!
 Algorithmics Incorporated Algo Suite One data architecture One analytical engine One suite of solutions Key differentiators: Ø Enterprise wide Ø Comprehensive solutions Ø Integrated framework Ø Scalable architecture Ø Advanced analytics Ø Proven solutions Comprehensive Solutions
 Algorithmics Incorporated Corporate Achievements in 2005 Growth u Secured >90 new licenses Enhanced Resources and Approach u Completed successful integration of Fitch Risk u Established focused, revenue-oriented business lines u Developed new 3 rd party alliances: Numeri. X, Citigroup, Polaris Delivered Value u Secured powerful value-added statements by clients Industry Recognition u Risk Awards, Gartner Magic Quadrant, American Banker Top 100, Celent Basel II
 Algorithmics Incorporated Solution Achievements in 2005 Algo Suite 4. 5 Ø Successful launch in April; more than 20 upgrades completed or underway Capital Management and Credit Risk (Algo Capital, Algo Credit) Ø Ø Ø Leading market share for Basel II Vendors (Celent 2006) Proven economic and regulatory capital solutions Successful launch of European Credit Data Services Introduced credit workflow solutions to the market Over 80 capital management and credit risk clients
 Ø Integration created") Algorithmics Incorporated Solution Achievements in 2005 Operational Risk (Algo Op. Vantage) Ø Integration created the largest operational risk team in the world Ø Recognized by Chartis Research as leading operational risk provider Ø Loss Event Database (FIRST) Ø More than 80 operational risk clients worldwide Market Risk for the Buy Side and Sell Side (Algo Risk) Ø Gained momentum with partnered ASP solutions (BBG, BHF, SSID) Ø Opened Mt. F framework to accommodate 3 rd party models Ø Extended decision support, including optimization Ø Over 100 market risk (Algo Risk) clients Collateral Management (Algo Collateral) Ø Optimized for scalability Ø Progress made toward development of version 5. 0 (launch Q 3 2006) Ø Over 60 long-term collateral clients
Algorithmics Incorporated Solution Achievements in 2005 Operational Risk (Algo Op. Vantage) Ø Integration created the largest operational risk team in the world Ø Recognized by Chartis Research as leading operational risk provider Ø Loss Event Database (FIRST) Ø More than 80 operational risk clients worldwide Market Risk for the Buy Side and Sell Side (Algo Risk) Ø Gained momentum with partnered ASP solutions (BBG, BHF, SSID) Ø Opened Mt. F framework to accommodate 3 rd party models Ø Extended decision support, including optimization Ø Over 100 market risk (Algo Risk) clients Collateral Management (Algo Collateral) Ø Optimized for scalability Ø Progress made toward development of version 5. 0 (launch Q 3 2006) Ø Over 60 long-term collateral clients
 Algorithmics Incorporated Financial Institution of the Future Compute Risk then do business Solution Strategy, building on core competencies: • Full forward valuation. No Short Cuts • Enterprise wide consolidation of all risks • Risk related work-flow and decision process Evolving Positioning Integrated Solution Strategy for ERM • Software • Content • Services • Advisory
 Algorithmics Incorporated Risk Management Growth Drivers u Evolving regulatory pressures u Increasing complexity in financial markets and products u Ongoing trends toward buying solutions rather than building in-house u Increasing scope and scale of risk management requirements u Growing interest from non-traditional markets – ex. buy side u Evolving trends towards risk management best practice for competitive and business advantage
 Algorithmics Incorporated Key Investment Areas in 2006 People: Increased investment in subject matter expertise in business lines and field; significant enhancements to services and advisory resources Buy Side Investment decision process Managed service / ASP Explore related verticals Sell Side Decision support Advanced analytics Open Mt. F program (Numeri. X) Credit Processes Credit workflow Internal ratings process Limit management Collateral Management Scalability and flexibility Risk-based margining Capital Management Advisory Economic & regulatory capital EPE (Basel II) Content (Credit Data Services) Extensive models platform (Citigroup) Analytics for Fitch Ratings Operational Risk Scalability and flexibility Advisory Content
 Risk Leadership Algorithmics Incorporated Growth Objectives 20%+ overall revenue growth ü Market opportunity ü Our market position ü Solutions that matter ü Investment in growth strategy
 Page 62
 Page 63
 Global Presence Headcount NA: ~870 New York LA: ~160 Washington EMEA: ~590 Chicago AP: ~160 San Francisco Austin Total: ~1, 780 Tampa Toronto Barcelona London Frankfurt Paris Moscow Warsaw Milan Istanbul Beijing Seoul Tokyo Monterrey Mexico City San Salvador San Jose Bogota Caracas Quito Lima Taipei Hong Kong Bangkok Kuala Lumpur Singapore Brisbane La Paz Rio De Janeiro Sao Paulo Tunis New Delhi Kolkata Chennai Mumbai Santiago Buenos Aires Montevideo Johannesburg Colombo Sydney
 u u u 5,") Market Coverage Fitch’s Ratings Universe (as of year end 2005) u u u 5, 387 financial institutions Ø 3, 212 banks Ø 1, 976 insurance companies 1, 279 corporate ratings 96 sovereign ratings 80, 323 municipal transactions under surveillance 117 sub-sovereign ratings structured finance deals under surveillance Ø 6, 361 U. S. Ø 1, 436 EMEA Ø 271 Asia-Pacific
Market Coverage Fitch’s Ratings Universe (as of year end 2005) u u u 5, 387 financial institutions Ø 3, 212 banks Ø 1, 976 insurance companies 1, 279 corporate ratings 96 sovereign ratings 80, 323 municipal transactions under surveillance 117 sub-sovereign ratings structured finance deals under surveillance Ø 6, 361 U. S. Ø 1, 436 EMEA Ø 271 Asia-Pacific
 Points of Differentiation Opinions respected by investors and issuers Experienced career analysts Thorough analysis and reporting In-depth criteria and modeling Global regulatory recognition Service -oriented culture Commitment to proactive service Prompt response to inquiries Active investor visitation program Frequent seminars and conferences Sharing the ideas behind our opinions Open decision-making framework Accessibility of analysts Timely presale research Ongoing surveillance A multinational firm built on local expertise Dual headquarters in New York and London Coverage in over 90 countries Regional presence in six US cities Credit decisions reflecting on the ground perspective Innovative and forward thinking Original Research and modeling Receptivity to new ideas and markets Specialized knowledge in complex credits Proven record of innovation
 Code of Conduct Introduction to Fitch Ratings Code of Conduct u u u “Fitch Ratings is committed to providing the world's securities markets with objective, timely, independent and forward-looking credit opinions. Fitch is dedicated to several core principles -- objectivity, independence, integrity and transparency. Investor confidence in Fitch’s ratings and research is difficult to win, and easy to lose, and Fitch’s continued success is dependent on that confidence. “Fitch expects all of its employees to act in accordance with the highest standards of personal and professional integrity in all aspects of their activities and to comply with all applicable laws, rules and regulations, and all policies and procedures adopted by Fitch, that govern the conduct of Fitch employees. Each employee is personally responsible for maintaining the highest levels of integrity to preserve the trust and confidence of global investors. “Throughout its history, Fitch has established and implemented policies, procedures and internal controls to ensure the objectivity and integrity of its ratings. Fitch’s Code of Conduct summarizes Fitch’s existing policies and procedures designed to ensure the highest standards for Fitch’s ratings. Fitch will promptly disclose any changes to this Code, or to how this Code is implemented and enforced. ”
 Additional Information on Key 2005 Accomplishments Recovery Ratings u Fitch has created two new rating types; recovery ratings (RR) and issuer default ratings (IDR) u Rolled-out through 2005 and Q 1 2006, recovery ratings provide investors with information on the two components of credit risk — a benchmark probability of default and a recovery expectation given default u These ratings are being consistently applied globally across all corporate, bank, utility and insurance sectors High Yield u Recognizing the increased importance of this asset class and growing demand from investors and other market constituents, Fitch formed a group to focus on better serving the high yield market in the Fall of 2004 u Fitch currently rates 80 of the top 100 high yield issuers u Approximately 1/3 of Fitch's corporate ratings are high yield u Over 360 loan assessments were requested and completed in 2005
 Additional Information on Key 2005 Accomplishments Covered Bonds u Covered bonds are securities issued by financial institutions and secured on a portfolio of assets such as mortgage loans (residential or commercial) and loans to public entities u Fitch currently rates the following types of covered bonds Ø Germany’s Hypotheken and Oeffentliche Pfandbrief, Spain's Cedulas Hipotecarias, France's Obligations Foncieres, UK Contractual Covered Bonds, Ireland's Asset Covered Securities, Luxembourg's Lettres de Gage Publiques, Italy's Covered Bonds, Dutch Contractual Covered Bonds Credit Derivatives u The use of credit derivatives, and synthetic transactions in particular, reflects a change in behavior by investors and bankers in the capital markets u In 2005, Fitch invested in the research and development of new credit derivatives products and services designed to marry the analysis of credit risk and market risk, particularly in the growing market for synthetic CDOs Ø RAPCD announced at Fitch’s Credit Derivatives Conference in New York March 15 u Valuspread provides banks and other market participants with prices on credit default swaps direct from leading global market makers
 Additional Information on Key 2005 Accomplishments Q Ratings u Q-IFS ratings are generated solely using a statistical model that utilizes financial statement information u The model incorporates “rating logic” that mirrors many aspects of the quantitative analysis used to assign Fitch’s traditional Insurance Financial Strength ratings, as well as new measures and tools intended to enhance the quantitative parts of Fitch’s traditional analysis u Throughout the year, Fitch initiated Q-IFS ratings on 166 insurance and reinsurance companies in France, Germany, the United Kingdom, and the U. S. Fitch assigned ratings to 473 U. S. property/casualty insurance companies and 280 U. S. life insurance companies New Products & Services u Bond Compare - allows subscribers to conduct side-by-side evaluations of individual structured finance deals u FASTracker - Fitch Alert Surveillance Tracker (FASTracker) - is a portfolio management tool that delivers frequent email alerts about new research, press releases, and performance data for structured finance u ABCP S. M. A. R. T (Surveillance. Metrics. Analytics. Research. Tools. ) provides a detailed and consistent reporting format for U. S. asset backed commercial paper performance data
 Algorithmics Incorporated Page 71
 Algorithmics Incorporated Recognized Leadership “The rankings show that Algorithmics' brand is as strong as ever… Algorithmics once again swept the board in terms of risk management. " Clive Davidson, Risk Magazine Contributing Editor First In: Basel II Market Risk Credit Risk Collateral Management Op Risk Capital Calculation
 Algorithmics Incorporated Sample Client List
 Algorithmics Incorporated Top 10 Strategic Risk Initiatives Risk Initiative Buy side risk management Risk management for hedge funds Economic capital Portfolio credit risk Capital management Credit derivatives Risk data architecture KRI for op risk SOX outside the US Energy risk Financial Insights 2006 = Algorithmics Solutions Algo Risk, Algo Collateral Algo Capital Algo Credit Algo Capital Algo Suite Algo Op. Vantage Algo Risk Algo Suite