

b9d8b21827654f5f9c7b399d6e217955.ppt
- Количество слайдов: 124
 P/C Insurance in an Era of Mega-Catastrophes Overview & Implications Institute for Business & Homes Safety Annual Conference Orlando, FL November 7, 2007 Robert P. Hartwig, Ph. D. , CPCU, President Insurance Information Institute 110 William Street New York, NY 10038 Tel: (212) 346 -5520 Fax: (212) 732 -1916 bobh@iii. org www. iii. org
 Presentation Outline 1. Declining Profitability—Past the Cyclical Peak Ø Ratings & Financial Strength 2. Deteriorating Underwriting Trends: Still Strong, for How Long? Ø Key Personal & Commercial Lines Review 3. 4. 5. 6. 7. 8. Vanishing Premium Growth: Approaching a Standstill Weak Pricing: Competitive Pressures Mounting Rising Expenses: Creeping Upward Overcapacity: Rapid Capital/Surplus Growth ROE Pressure Investment Volatility: More Pain, Less Gain Catastrophic Loss: The Worst Has Yet to Come Ø Reinsurance Summary 9. Shifting Legal Liability & Tort Environment: Will the Pendulum Swing Against Insurers? 10. Regulation, Legislation & Litigation: Attention to CATs Grows 11. Q&A
 #1 DECLINING PROFITABILITY Profits in 2006/7 Reached Their Cyclical Peak; ROEs Already Falling
* 2001 ROE = -1.") P/C Net Income After Taxes 1991 -2007 F ($ Millions)* 2001 ROE = -1. 2% 2002 ROE = 2. 2% 2003 ROE = 8. 9% 2004 ROE = 9. 4% 2005 ROE= 9. 4% 2006 ROAS 1 = 14. 0% 2007 F ROAS = 13. 1%** Insurer profits peaked in 2006/7. “Normal” CAT year, average investment gain imply flattening *ROE figures are GAAP; 1 Return on avg. surplus. 2007 F figure is annualized actual first half net income of $32. 596 B **Actual first half 2007 result. Sources: A. M. Best, ISO, Insurance Information Inst.
P/C Net Income After Taxes 1991 -2007 F ($ Millions)* 2001 ROE = -1. 2% 2002 ROE = 2. 2% 2003 ROE = 8. 9% 2004 ROE = 9. 4% 2005 ROE= 9. 4% 2006 ROAS 1 = 14. 0% 2007 F ROAS = 13. 1%** Insurer profits peaked in 2006/7. “Normal” CAT year, average investment gain imply flattening *ROE figures are GAAP; 1 Return on avg. surplus. 2007 F figure is annualized actual first half net income of $32. 596 B **Actual first half 2007 result. Sources: A. M. Best, ISO, Insurance Information Inst.
 ROE: P/C vs. All Industries 1987– 2008 E P/C profitability is cyclical, volatile and vulnerable Sept. 11 Hugo Andrew Lowest CAT losses in 15 years Northridge *2007 is actual first half ROAS of 13. 1%. 2008 P/C insurer ROE is I. I. I. estimate. Source: Insurance Information Institute; Fortune Katrina, Rita, Wilma 4 Hurricanes
 Profitability Peaks & Troughs in the P/C Insurance Industry, 1975 – 2008 F 1977: 19. 0% 1987: 17. 3% 10 Years 1997: 11. 6% 10 Y ears 1975: 2. 4% 2006: 14. 0% 1984: 1. 8% s 9 Year 1992: 4. 5% *2007 is actual first half ROAS of 13. 1%. 2008 P/C insurer ROE is I. I. I. estimate. Source: Insurance Information Institute; Fortune 2001: -1. 2%
 ROE vs. Equity Cost of Capital: US P/C Insurance: 1991 -2007 E US P/C insurers missed their cost of capital by an average 6. 7 points from 1991 to 2002, but on target or better 2003 -07 Source: The Geneva Association, Ins. Information Inst. +3. 1 pts -0. 1 pts +0. 2 pts -9. 0 pts -13. 2 pts +3. 5 pts The p/c insurance industry achieved its cost of capital in 2005/6 for the first time in many years The cost of capital is the rate of return insurers need to attract and retain capital to the business
 Insurance & Reinsurance Stocks: Finally Gaining in 2007 Total YTD Returns Through November 2, 2007 Mortgage insurers are down 66%, Title insurers down 35% on subprime & real estate woes P/C insurance, reinsurance stocks lagging on soft market concerns, and subprime selloff. Some relief due to very low hurricane losses Source: SNL Securities, Standard & Poor’s, Insurance Information Inst. *Includes Financial Guarantee
 Top Industries by ROE: P/C Insurers Still Underperformed in 2006* P/C insurer profitability in 2006 ranked 30 th out of 50 industry groups despite renewed profitability P/C insurers underperformed the All Industry median for the 19 th consecutive year *Excludes #1 ranked Airline category at 65. 1% due to special one-time bankruptcy-related factors. Source: Fortune, April 30, 2007 edition; Insurance Information Institute
 Advertising Expenditures by P/C Insurance Industry, 1999 -2006 Ad spending by P/C insurers is at a record high, signaling increased competition Source: Insurance Information Institute from consolidated P/C Annual Statement data.
 FINANCIAL STRENGTH & RATINGS Industry Has Weathered the Storms Well, But Cycle May Takes Its Toll
 Reasons for US P/C Insurer Impairments, 1969 -2005 2003 -2005 Deficient reserves, CAT losses are more important factors in recent years 1969 -2005 *Includes overstatement of assets. Source: A. M. Best: P/C Impairments Hit Near-Term Lows Despite Surging Hurricane Activity, Special Report, Nov. 2005;
 P/C Insurer Impairment Frequency vs. Combined Ratio, 1969 -2006 Impairment rates are highly correlated underwriting performance 2006 impairment rate was 0. 43%, or 1 -in-233 companies, half the 0. 86% average since 1969 Source: A. M. Best; Insurance Information Institute
 #2 DETERIORATING UNDERWRITING Extremely Strong 2006/07; Relying on Momentum & Discipline for 2008
 P/C Insurance Combined Ratio, 1970 -2008 F* Combined Ratios 1970 s: 100. 3 1980 s: 109. 2 1990 s: 107. 8 2000 s: 102. 2** Sources: A. M. Best; ISO, III *Actual figure of 92. 7 through first half 2007. **Through 2007: H 1.
 P/C Insurance Combined Ratio, 2001 -2008 F As recently as 2001, insurers were paying out nearly $1. 16 for every dollar they earned in premiums 2005 figure benefited from heavy use of reinsurance which lowered net losses Sources: A. M. Best; ISO, III. *III estimates for 2007/8 deterioration due primarily to falling rates, but results still strong assuming normal CAT activity 2006 produced the best underwriting result since the 87. 6 combined ratio in 1949
 2007 is") Ten Lowest P/C Insurance Combined Ratios Since 1920 (& 2007: H 1) 2007 is off to a great start The 2006 combined ratio of 92. 5 was the best since the 87. 6 combined in 1949 The industry’s best underwriting years are associated with periods of low interest rates Sources: Insurance Information Institute research from A. M. Best data. *2007 first half actual.
Ten Lowest P/C Insurance Combined Ratios Since 1920 (& 2007: H 1) 2007 is off to a great start The 2006 combined ratio of 92. 5 was the best since the 87. 6 combined in 1949 The industry’s best underwriting years are associated with periods of low interest rates Sources: Insurance Information Institute research from A. M. Best data. *2007 first half actual.
 1975 -2007 F* $ Billions Insurers earned a record underwriting profit") Underwriting Gain (Loss) 1975 -2007 F* $ Billions Insurers earned a record underwriting profit of $31. 7 billion in 2006, the largest ever but only the second since 1978. Expect figure near $28 billion in 2007 assuming “normal” CAT losses. Cumulative underwriting deficit since 1975 is $412 billion. Source: A. M. Best, Insurance Information Institute *Actual 2007: H 1 underwriting profit = $14. 402 B annualized to $28. 8 B.
Underwriting Gain (Loss) 1975 -2007 F* $ Billions Insurers earned a record underwriting profit of $31. 7 billion in 2006, the largest ever but only the second since 1978. Expect figure near $28 billion in 2007 assuming “normal” CAT losses. Cumulative underwriting deficit since 1975 is $412 billion. Source: A. M. Best, Insurance Information Institute *Actual 2007: H 1 underwriting profit = $14. 402 B annualized to $28. 8 B.
 Impact of Reserve Changes on Combined Ratio Reserve adequacy has improved substantially Source: A. M. Best, Lehman Brothers estimates for years 2007 -2009
 Strengthening Release Reserve redundancies") Cumulative Prior Year Reserve Development by Line (As of 12/31/06) Strengthening Release Reserve redundancies in most lines have resulted in releases in recent years Sources: Lehman Brothers; A. M. Best’s Aggregates & Averages Schedule P, Part 2.
Cumulative Prior Year Reserve Development by Line (As of 12/31/06) Strengthening Release Reserve redundancies in most lines have resulted in releases in recent years Sources: Lehman Brothers; A. M. Best’s Aggregates & Averages Schedule P, Part 2.
 PERSONAL LINES: Private Passenger Auto
 Private Passenger Auto is Enormous Part of P/C Industry Private passenger auto accounted for 34% or $164. 1 B in DPW in 2006 $97. 3 B $66. 8 B $261. 8 B Source: A. M. Best; Insurance Information Institute $60. 1 B
 Personal Lines Combined Ratio, 1993 -2006 A very strong 2006 resulted from favorable frequency & severity trends and low CAT activity Source: A. M. Best; Insurance Information Institute.
 Commercial Lines Combined Ratio, 1993 -2006 Commercial coverages have exhibited extreme variability. Are current results anomalous? Outside CATaffected lines, commercial insurance is doing fairly well. Caution is required in underwriting longtail commercial lines. 2006 results benefited from relatively disciplined underwriting, low CAT losses and reserve releases Source: A. M. Best; Insurance Information Institute .
 Homeowners Insurance
 Homeowners Insurance Combined Ratio Average 1990 to 2006= 111. 8 Insurers have paid out an average of $1. 12 in losses for every dollar earned in premiums over the past 17 years Sources: A. M. Best; III
 Rates of Return on Net Worth for Homeowners Ins: US Averages: 1993 to 2005 US HO Insurance = +2. 5% (+3. 3% through 2006 E) Source: NAIC; 2006 figure is Insurance Information Institute estimate.
 Allstate is offering a version of its Home Inventory software to its customers
 #3 VANISHING PREMIUM GROWTH At a Virtual Standstill in 2007/08
 Strength of Recent Hard Markets by NWP Growth* 1975 -78 1984 -87 2001 -04 2006 -2010 (post-Katrina) period could resemble 1993 -97 (post-Andrew) 2005: biggest real drop in premium since early 1980 s Note: Shaded areas denote hard market periods. Source: A. M. Best, Insurance Information Institute *2007 -10 figures are III forecasts/estimates.
 Growth in Net Written Premium, 2000 -2008 F P/C insurers will experience their slowest growth rates since the late 1990 s…but underwriting results are expected to remain healthy *2007 figure base on 2007 actual first half result of 0. 1%. Source: A. M. Best; Forecasts from the Insurance Information Institute.
 #4 WEAK PRICING Under Intense Pressure in 2007/08, Especially Commercial Lines
 Average Expenditures on Auto Insurance Countrywide auto insurance expenditures are expected to fall 0. 5% in 2007, the first drop since 1999 Lower underlying frequency and modest severity are keeping auto insurance costs in check *Insurance Information Institute Estimates/Forecasts Source: NAIC, Insurance Information Institute
 Average Expenditures on Homeowners Insurance** Countrywide home insurance expenditures rose an estimated 6% in 2006 Homeowners in non. CAT zones will see smaller increases, but larger in CAT zones *Insurance Information Institute Estimates/Forecasts **Excludes cost of flood and earthquake coverage. Source: NAIC, Insurance Information Institute
 Homeowners Insurance Expenditures as a % of Median Existing Home Prices, 1995 -2008 F Record catastrophe losses and declining home prices are pushing HO insurance expenditures as a % of median home price up Source: National Association of Realtors, NAIC; Insurance Info. Institute calculations and HO expenditure estimates/ forecasts for years 2005 -2008.
 Magnitude") Average Commercial Rate Change, All Lines, (1 Q: 2004 – 2 Q: 2007) Magnitude of rate decreases diminished greatly after Katrina but have grown again KRW Effect Source: Council of Insurance Agents & Brokers; Insurance Information Institute
Average Commercial Rate Change, All Lines, (1 Q: 2004 – 2 Q: 2007) Magnitude of rate decreases diminished greatly after Katrina but have grown again KRW Effect Source: Council of Insurance Agents & Brokers; Insurance Information Institute
 Cumulative Commercial Rate Change by Line: 4 Q 99 – 3 Q 07 Commercial account pricing has been trending down for 3 years and is now on par with prices in late 2001, early 2002 Source: Council of Insurance Agents & Brokers
 #5 RISING EXPENSES Expense Ratios Will Rise as Premium Growth Slows
 Personal vs. Commercial Lines Underwriting Expense Ratio* Expenses ratios will likely rise as premium growth slows *Ratio of expenses incurred to net premiums written. Source: A. M. Best; Insurance Information Institute
 #6 OVERCAPACITY Accumulation of Capital/ Surplus Depresses ROEs
 U. S. Policyholder Surplus: 1975 -2007* $ Billions Capacity as of 6/30/07 was $512. 8 B, 5. 3% above year-end 2006, 80% above its 2002 trough and 54% above its 1999 peak. Foreign reinsurance and residual market mechanisms absorbed 45% of 2005 CAT losses of $62. 1 B Capacity exceeded a half trillion dollars for the first time during the 2 nd quarter of 2007 “Surplus” is a measure of underwriting capacity. It is analogous to “Owners Equity” or “Net Worth” in non-insurance organizations Source: A. M. Best, ISO, Insurance Information Institute. *As of June 30, 2007
 P/C Industry Premium-to-Surplus Ratio, 1985 -2007: H 1 Private Carriers $ Billions 1. 92: 1 At 0. 87: 1 as of 6/30/07, now approaching all-time record premium-to-surplus ratio of 0. 84: 1 in 1998 P: S Ratio $512. 8 B $447 B $145 B Low P: S Ratio 0. 84: 1 in 1998 $76 B Calendar Year H 1 = First Half Source: 1985– 2006, A. M. Best Aggregates & Averages; ; 2007 ISO 0. 87: 1
 Annual Catastrophe Bond Transactions Volume, 1997 -2007* Catastrophe bond issuance has soared in the wake of Hurricanes Katrina and the hurricane seasons of 2004/2005 Source: MMC Securities and Guy Carpenter; Insurance Information Institute. *Through 10/31/07
* Reasons Behind Capital") P/C Insurer Share Repurchases, 1987 - First Half 2007 ($ Millions)* Reasons Behind Capital Build-Up & Repurchase Surge • Strong underwriting results First half 2007 share buybacks are already 86% of the 2006 record • Moderate catastrophe losses • Reasonable investment performance • Lack of strategic alternatives (M&A, large-scale expansion) Returning capital owners (shareholders) is one of the few options available Sources: Credit Suisse, Company Reports; Insurance Information Inst.
P/C Insurer Share Repurchases, 1987 - First Half 2007 ($ Millions)* Reasons Behind Capital Build-Up & Repurchase Surge • Strong underwriting results First half 2007 share buybacks are already 86% of the 2006 record • Moderate catastrophe losses • Reasonable investment performance • Lack of strategic alternatives (M&A, large-scale expansion) Returning capital owners (shareholders) is one of the few options available Sources: Credit Suisse, Company Reports; Insurance Information Inst.
 MERGER & ACQUISITION Few Catalysts for Major P/C Consolidation in ‘ 08
 P/C Insurance-Related M&A Activity, 1988 -2006 surge due mostly to 2 deals. No trend started. Reinsurance, distribution are exceptions . Source: Conning Research & Consulting. No model for successful consolidation has emerged
 Distribution Sector: Insurance. Related M&A Activity, 1988 -2006 No extraordinary trends evident Source: Conning Research & Consulting.
 Distribution Sector M&A Activity, 2005 vs. 2006 2005 2006 Number of bank acquisitions is falling years Source: Conning Research & Consulting
 #7 FLAT & VOLATILE INVESTMENTS More Pain, Little Gain
 $ Billions Net Investment Income Investment income posted modest gains in 2006, but is running flat in 2007 Growth History 2002: -1. 3% 2003: +3. 9% 2004: +3. 4% 2005: +24. 4%* 2006: +5. 2% 2007: 0. 0%** Source: A. M. Best, ISO, Insurance Information Institute; *Includes special dividend of $3. 2 B. Increase is 15. 7% excluding dividend. **Based on annualized H 1 result of $26. 128 B.
 Total Returns for Large Company Stocks: 1970 -2007* S&P 500 was up 13. 62% in 2006, Up 6. 44% YTD 2007* Markets are up in 2007 for the 5 th consecutive year (so far) Source: Ibbotson Associates, Insurance Information Institute. *Through November 2, 2007.
 Realized capital") US P/C Net Realized Capital Gains, 1990 -2007: H 1 ($ Millions) Realized capital gains rebounded strongly in 2004/5 but fell sharply in 2006 despite strong stock market as insurers “bank” their gains. Rising again in 2007. Sources: A. M. Best, ISO, Insurance Information Institute. *As of June 30, 2007.
US P/C Net Realized Capital Gains, 1990 -2007: H 1 ($ Millions) Realized capital gains rebounded strongly in 2004/5 but fell sharply in 2006 despite strong stock market as insurers “bank” their gains. Rising again in 2007. Sources: A. M. Best, ISO, Insurance Information Institute. *As of June 30, 2007.
 Property/Casualty Insurance 1 Industry Investment Gain Investment gains fell in 2006 and even now are only marginally larger than in the late 1990 s 1 Investment gains consist primarily of interest, stock dividends and realized capital gains and losses. 2006 figure consists of $52. 3 B net investment income and $3. 4 B realized investment gain. *2005 figure includes special one-time dividend of $3. 2 B. **Annualized H 1 result of $30. 301 B. Sources: ISO; Insurance Information Institute.
 #8 CATASTROPHIC LOSS Wind, Fire & Water
 Most of US Population & Property Has Major CAT Exposure Is Anyplace Safe?
 U. S. Insured Catastrophe Losses* $ Billions 2006 was a welcome respite. 2005 was by far the worst year ever for insured catastrophe losses in the US, but the worst has yet to come. $100 Billion CAT year is coming soon *Excludes $4 B-$6 b offshore energy losses from Hurricanes Katrina & Rita. **Through 9/30/07. Note: 2001 figure includes $20. 3 B for 9/11 losses reported through 12/31/01. Includes only business and personal property claims, business interruption and auto claims. Non-prop/BI losses = $12. 2 B. Source: Property Claims Service/ISO; Insurance Information Institute
 Global Insured Catastrophe Losses* $ Millions Global CAT losses set 3 records over the past decade *Property losses only. Source: Swiss Re, sigma 2/07.
 Global Insured Catastrophe Losses by Region, 2001 -2006 North America accounted for 73% of global catastrophe losses 2001 -2006 Notes: 2001 -03 figures for N. America include US only. 2001 figure includes only property losses from 9/11. Source: Insurance Information Institute compiled from Swiss Re sigma issues.
 Global Insured Catastrophe Losses by Region, 2001 -2006 Insured property catastrophe losses from 2001 through 2006 totaled $214. 3 billion, 73% of which occurred in North America. Notes: 2001 -03 figures for N. America include US only. 2001 figure includes only property losses from 9/11. Source: Insurance Information Institute compiled from Swiss Re sigma issues.
 Inflation-Adjusted U. S. Insured Catastrophe Losses By Cause of Loss, 1986 -2005¹ Insured disaster losses totaled $289. 1 billion from 1984 -2005 (in 2005 dollars). Tropical systems accounted for nearly half of all CAT losses from 1986 -2005, up from 27. 1% from 1984 -2003. Catastrophes are all events causing direct insured losses to property of $25 million or more in 2005 dollars. Catastrophe threshold changed from $5 million to $25 million beginning in 1997. Adjusted for inflation by the III. 2 Excludes snow. 3 Includes hurricanes and tropical storms. 4 Includes other geologic events such as volcanic eruptions and other earth movement. 5 Does not include flood damage covered by the federally administered National Flood Insurance Program. 6 Includes wildland fires. 1 Source: Insurance Services Office (ISO). .
 Distribution of US Insured CAT Losses: TX, FL vs US, 1980 -2006* $ Billions of 2005 Dollars Florida accounted for 22% of all US insured CAT losses from 1980 -2006: $57 B out of $249. 3 B *All figures (except 2006 loss) have been adjusted to 2005 dollars. Source: PCS division of ISO.
 Some 33 catastrophe") U. S. Catastrophe Losses 2006: States With Largest Losses ($ Millions) Some 33 catastrophe events* in 34 states cost insurers an estimated $9. 2 bn in 2006, compared with $61. 9 bn in 2005. Cat losses in the following five states -- totaling $4. 5 bn -- represent half the total catastrophe losses for the year. SURPRISE!! Missouri and Kansas ranked in the top 5 in insured catastrophe losses in 2006 at nearly $1. 5 billion. *ISO defines a catastrophe event as an event causing $25 million or more in insured property losses. Source: ISO; Insurance Information Institute
U. S. Catastrophe Losses 2006: States With Largest Losses ($ Millions) Some 33 catastrophe events* in 34 states cost insurers an estimated $9. 2 bn in 2006, compared with $61. 9 bn in 2005. Cat losses in the following five states -- totaling $4. 5 bn -- represent half the total catastrophe losses for the year. SURPRISE!! Missouri and Kansas ranked in the top 5 in insured catastrophe losses in 2006 at nearly $1. 5 billion. *ISO defines a catastrophe event as an event causing $25 million or more in insured property losses. Source: ISO; Insurance Information Institute
 2007 Hurricane Season: No Big Hits…So Far A Sigh of Relief The 2007 season saw 14 named storms including two rare Category 5 storms, but the US escaped this year with very little loss Source: www. wunderground. com, accessed 11/3/07; Insurance Information Institute
 Florida has nearly $2 trillion") Total Value of Insured Coastal Exposure (2004, $ Billions) Florida has nearly $2 trillion in insured coastal exposure Source: AIR Worldwide
Total Value of Insured Coastal Exposure (2004, $ Billions) Florida has nearly $2 trillion in insured coastal exposure Source: AIR Worldwide
 Nearly") Insured Coastal Exposure as a % of Statewid Insured Exposure (2004, $ Billions) Nearly 80% of Florida’s total insured exposure is coastal *III list Source: AIR Worldwide
Insured Coastal Exposure as a % of Statewid Insured Exposure (2004, $ Billions) Nearly 80% of Florida’s total insured exposure is coastal *III list Source: AIR Worldwide
 Florida has nearly $1 trillion") Value of Insured Residential Coastal Exposure (2004, $ Billions) Florida has nearly $1 trillion in insured residential coastal exposure Source: AIR
Value of Insured Residential Coastal Exposure (2004, $ Billions) Florida has nearly $1 trillion in insured residential coastal exposure Source: AIR
 Florida has nearly $ trillion") Value of Insured Commercial Coastal Exposure (2004, $ Billions) Florida has nearly $ trillion in insured residential commercial exposure Source: AIR
Value of Insured Commercial Coastal Exposure (2004, $ Billions) Florida has nearly $ trillion in insured residential commercial exposure Source: AIR
 Insured Losses from Top 10 Earthquakes Adjusted to 2005 Exposure Levels (Billions of 2005 Dollars) With development along major fault lines, the threat of $25 B+ quakes looms large Source: AIR Worldwide 3 of the Top 10 are not West Coast events
 Number of Tornadoes, 1985 – 2006 p There are usually more than 1, 000 confirmed tornadoes each year in the US. They accounted for about 25% of catastrophe losses since 1985 Source: US Dept. of Commerce, Storm Prediction Center, National Weather Service; Ins. Info. Inst.
 California Wildfires Update & Historical Perspective
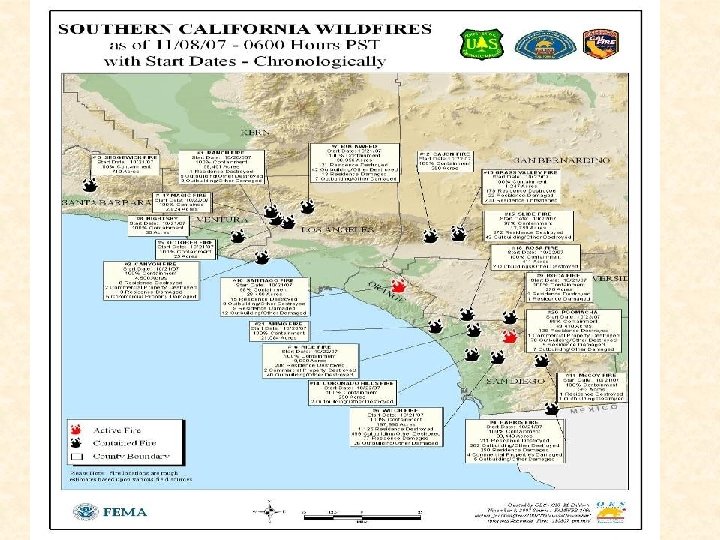
") Top Ten Catastrophic Wildland Fires In California, 1970 -2007* Insured Losses (Millions 2006 $) *Estimated insured losses. Adjusted to 2006 dollars by the Insurance Information Institute. 2007 fire losses are stated in 2007 dollars. Source: ISO's Property Claim Services Unit; Insurance Information Institute.
Top Ten Catastrophic Wildland Fires In California, 1970 -2007* Insured Losses (Millions 2006 $) *Estimated insured losses. Adjusted to 2006 dollars by the Insurance Information Institute. 2007 fire losses are stated in 2007 dollars. Source: ISO's Property Claim Services Unit; Insurance Information Institute.
 Top Catastrophic Wildland Fires In The United States, 1970 -2007* Insured Losses (Millions 2006 $) *Estimated insured losses. Adjusted to 2006 dollars by the Insurance Information Institute. 2007 fire losses are stated in 2007 dollars. Source: ISO's Property Claim Services Unit; Insurance Information Institute.
 Top 15 California Homeowners Insurers, 2006 Rank Company 1 State Farm IL Group 2 Zurich Insurance Group 3 Direct Premiums Written Market Share (%) $1, 436, 028, 885 21. 7% 1, 116, 433, 543 16. 9 Allstate Insurance Group 887, 879, 647 13. 4 4 California State Auto Group 414, 417, 030 6. 3 5 USAA Group 294, 930, 839 4. 5 6 AUTO Club Enterprises Ins. Group 266, 029, 053 4. 0 7 Nationwide Group 233, 463, 019 3. 5 8 Mercury General Group 196, 753, 111 3. 0 9 Safeco Insurance Group 182, 038, 003 2. 8 10 Allianz Insurance Group 165, 577, 501 2. 5 11 Liberty Mutual Insurance Group 128, 771, 659 1. 9 12 Travelers Group 124, 763, 066 1. 9 13 Hartford Fire & Casualty Group 107, 073, 769 1. 6 14 Balboa Insurance Group 100, 850, 262 1. 5 15 American International Group 90, 424, 381 1. 4 Source: © 2007 Highline Data LLC.
 Flood Insurance Analysis of Purchase and Policy Purchase and Lapse Since Katrina
 Gulf States: NFIP Flood Policies in Force: July 1993 – July 2007* August 29, 2005 Hurricane Katrina Surge in Sales: Katrina/Rita Effect, Net Increase of 618, 335 policies or 21. 6% *Mandatory purchase of flood coverage for structures in floodplains with federally backed mortgages became effective in 1993. NFIP National Advertising Campaign began in 1993. PIF= Policies In Force. Gulf States are: AL, FL, LA, MS and TX. Source: NFIP; Insurance Information Institute.
 Alabama: NFIP Flood Policies in Force: July 1993 – July 2007* August 29, 2005 Hurricane Katrina Surge in Sales: Katrina Effect *Mandatory purchase of flood coverage for structures in floodplains with federally backed mortgages became effective in 1993. NFIP National Advertising Campaign began in 1993. PIF= Policies In Force. Source: NFIP; Insurance Information Institute
 Florida: NFIP Flood Policies in Force: July 1993 – July 2007* August 29, 2005 Hurricane Katrina Surge in Sales: Katrina Effect *Mandatory purchase of flood coverage for structures in floodplains with federally backed mortgages became effective in 1993. NFIP National Advertising Campaign began in 1993. PIF= Policies In Force. Source: NFIP; Insurance Information Institute
 Louisiana: NFIP Flood Policies in Force: July 1993 – July 2007* August 29, 2005 Hurricane Katrina Surge in Sales: Katrina Effect *Mandatory purchase of flood coverage for structures in floodplains with federally backed mortgages became effective in 1993. NFIP National Advertising Campaign began in 1993. PIF= Policies In Force. Source: NFIP; Insurance Information Institute
 Mississippi: NFIP Flood Policies in Force: July 1993 – July 2007* August 29, 2005 Hurricane Katrina Surge in Sales: Katrina Effect *Mandatory purchase of flood coverage for structures in floodplains with federally backed mortgages became effective in 1993. NFIP National Advertising Campaign began in 1993. PIF= Policies In Force. Source: NFIP; Insurance Information Institute
 Texas: NFIP Flood Policies in Force: July 1993 – July 2007* August 29, 2005 Tropical Storm Allison Hurricane Katrina Surge in Sales: Katrina/Rita Effect *Mandatory purchase of flood coverage for structures in floodplains with federally backed mortgages became effective in 1993. NFIP National Advertising Campaign began in 1993. PIF= Policies In Force. Source: NFIP; Insurance Information Institute
 NFIP Flood Policy Growth in Gulf States Since Katrina* The number of flood insurance policies sold in the Gulf states in the 2 years following Katrina increased by 618, 335 or 21. 6% *Change from July 2005 through August 2007. Sources: NFIP ; Insurance Information Institute.
 NFIP Flood Policy Growth inn Gulf States Since Katrina* The number of flood insurance policies sold in the Gulf states in the 2 years following Katrina increased by 21. 6% *Change from July 2005 through August 2007. Sources: NFIP ; Insurance Information Institute.
 Percentage of NFIP Flood Policies Issued Since Katrina That Are Not Renewed* Flood policy nonrenewal rates in Gulf states are surprisingly high *Policies issued since July 2005 as of August 2007. **US figure is nonrenewal rate for all policies in force, average over 12 month period ending August 2007. Sources: NFIP ; Insurance Information Institute.
 States Create Their Own Vulnerability and Try to Blame Insurers
 in Florida Homeowners Insurance, $ Billions 1992 -2006 E* Florida’s homeowners") Underwriting Gain (Loss) in Florida Homeowners Insurance, $ Billions 1992 -2006 E* Florida’s homeowners insurance market produces small profits in most years and enormous losses in others *2005 estimate by Insurance Information Institute based on historical loss and expense data for FL adjusted for estimated 2005 residential windstorm losses of $7. 35 B. 2006 estimate from Ins. Info. Inst.
Underwriting Gain (Loss) in Florida Homeowners Insurance, $ Billions 1992 -2006 E* Florida’s homeowners insurance market produces small profits in most years and enormous losses in others *2005 estimate by Insurance Information Institute based on historical loss and expense data for FL adjusted for estimated 2005 residential windstorm losses of $7. 35 B. 2006 estimate from Ins. Info. Inst.
 in Florida Homeowners Insurance, 1992 -2006 E* Regulator") $ Billions Cumulative Underwriting Gain (Loss) in Florida Homeowners Insurance, 1992 -2006 E* Regulator under US law has duty to allow rates that are “fair, ” “not excessive” and “not unduly discriminatory. ” Reality is that regulators in CAT-prone states suppress rates. It took insurers 11 years (1993 -2003) to erase the UW loss associated with Andrew, but the 4 hurricanes of 2004 erased the prior 7 years of profits & 2005 deepened the hole. *2005 estimate by Insurance Information Institute based on historical loss and expense data for FL adjusted for estimated 2005 residential windstorm losses of $7. 35 B. 2006 estimate from Ins. Info. Inst.
$ Billions Cumulative Underwriting Gain (Loss) in Florida Homeowners Insurance, 1992 -2006 E* Regulator under US law has duty to allow rates that are “fair, ” “not excessive” and “not unduly discriminatory. ” Reality is that regulators in CAT-prone states suppress rates. It took insurers 11 years (1993 -2003) to erase the UW loss associated with Andrew, but the 4 hurricanes of 2004 erased the prior 7 years of profits & 2005 deepened the hole. *2005 estimate by Insurance Information Institute based on historical loss and expense data for FL adjusted for estimated 2005 residential windstorm losses of $7. 35 B. 2006 estimate from Ins. Info. Inst.
 Rates of Return on Net Worth for Homeowners Ins: US vs. Florida 1990 – 2006 E Averages: 1990 to 2006 E US HO Insurance = -0. 9% FL HO Average = -36. 5% 4 Hurricanes Andrew Wilma, Dennis, Katrina Source: NAIC; 200/6 US and FL estimates from the Insurance Information Institute.
 Hurricane Katrina pushed all") Major Residual Market Plan Estimated Deficits 2004/2005 (Millions of Dollars) Hurricane Katrina pushed all of the residual market property plans in affected states into deficits for 2005, following an already record hurricane loss year in 2004 * MWUA est. deficit for 2005 comprises $545 m in assessments plus $50 m in Federal Aid. Source: Insurance Information Institute
Major Residual Market Plan Estimated Deficits 2004/2005 (Millions of Dollars) Hurricane Katrina pushed all of the residual market property plans in affected states into deficits for 2005, following an already record hurricane loss year in 2004 * MWUA est. deficit for 2005 comprises $545 m in assessments plus $50 m in Federal Aid. Source: Insurance Information Institute
 Exposure to loss in Florida Citizens") Florida Citizens Exposure to Loss (Billions of Dollars) Exposure to loss in Florida Citizens nearly doubled in 2006 and was up another 50% during the first half of 2007 Source: PIPSO; Insurance Information Institute. *As of June 30.
Florida Citizens Exposure to Loss (Billions of Dollars) Exposure to loss in Florida Citizens nearly doubled in 2006 and was up another 50% during the first half of 2007 Source: PIPSO; Insurance Information Institute. *As of June 30.
 Billions Pre- vs. Post-Event in FL for 2007 Hurricane Season There is a very significant likelihood of major, multiyear assessments in 2007 $80. 0 B $55. 0 B $49. 5 B $43. 8 B $35. 0 B Total = $25. 0 B $20. 0 Billion Notes: Pre-event funding includes funds available to Citizens, FHCF and private carriers plus contingent funding available through private reinsurance to pay claims in 2007. Post-event funding is on a present value basis and does not include financing costs. Probabilities are expressed as “odds of a single storm of this magnitude or greater happening in 2007. ” Source: Tillinghast Towers Perrin, Study of Recent Legislative Changes to Florida’s Property Insurance Mechanisms, 3/07.
 Average Annual Assessment per Household, 1 -in-100 Year Event in 2007 The average Florida household will pay $8, 699 over 30 years in assessments if a 1 -in-100 year event strikes in 2007. Assessments could rise if additional storms hit in 2007 or beyond. Source: Tillinghast Towers Perrin, Study of Recent Legislative Changes to Florida’s Property Insurance Mechanisms, 3/07.
 Savings vs. Costs by Region: Neither Equitable nor Proportionate STATEWIDE AVERAGE Average Savings: $265 Cost of 1 -in-30 Storm: $2, 550 Cost is 10 times avg. savings ORLANDO TALLAHASSEE Average Savings: $20 Cost of 1 -in-30 Storm: $2, 000 Cost is 100 times avg. savings TAMPA Average Savings: $100 Cost of 1 -in-30 Storm: $2, 300 Cost is 23 times avg. savings Average Savings: $30 Cost of 1 -in-30 Storm: $2, 075 Cost is 69 times avg. savings MIAMI Average Savings: $1, 120 Cost of 1 -in-30 Storm: $3, 375 Cost is 3 times avg. savings Source: Tillinghast Towers Perrin, Study of Recent Legislative Changes to Florida’s Property Insurance Mechanisms, 3/07.
 New Condo Construction in South Miami Beach, 2007 -2009 • Number of New Developments: 15 • Number of Individual Units: 2, 111 • Avg. Price of Cheapest Unit: $940, 333 • Avg. Price of Most Expensive Unit: $6, 460, 000 • Range: $395, 000 - $16, 000 • Overall Average Price per Unit: $3, 700, 167* • Aggregate Property Value: At least $6 Billion *Based on average of high/low value for each of the 15 developments Source: Insurance Information Institute from www. miamicondolifestyle. com accessed April 5, 2007.
 Historical Hurricane Strikes in Galveston County, TX, 1900 -2002 Source: NOAA Coastal Services Center, http: //hurricane. csc. noaa. gov/hurricanes/pop. jsp; Insurance Info. Institute.
 TWIA’s liability") TWIA Growth In Exposure to Loss (Building & Contents Only, $ Billions) TWIA’s liability in-force for building & contents has surged by 260 percent in the last 7 years from $12. 1 bn in 2000 to $43. 5 bn as of 3/31/07 Source: TWIA; Insurance Information Institute; *As of 11/30/06; **As of 3/31/07.
TWIA Growth In Exposure to Loss (Building & Contents Only, $ Billions) TWIA’s liability in-force for building & contents has surged by 260 percent in the last 7 years from $12. 1 bn in 2000 to $43. 5 bn as of 3/31/07 Source: TWIA; Insurance Information Institute; *As of 11/30/06; **As of 3/31/07.
 ROE for Homeowners Insurance in Texas, 1992 - 2005 14 -Year Average: 92 -05 Auto: +7. 6% Home: -2. 1% Despite recent improvements, TX is a very risky longrun proposition Source: NAIC
 New Construction in Galveston: Will Dreams be Blown Away? • More than $2. 3 Billion Residential, Commercial and Public Construction is Under Way in 2007 • More than 6, 500 Residential Units Under Construction Ø Mostly condos, including several towers up to 27 stories high Ø One development by Centex Homes will consist of 2, 300 condos and houses on 1, 000 acres • The Average Home Price Rose 89% to $232, 800 over the 4 Years Ending Jan. 2007 • Typical Price Range for Newer Condos: $400, 000 Up to $1. 5 Million Ø An undeveloped waterview lot can go for as much as $300, 000 Ø Most will be insured via TWIA Limits up to $1. 6 million + contents • Inconvenient Truth: Galveston is Site of the Deadliest Natural Disaster in US History Ø At least 8, 000 people were killed in a 1900 hurricane Ø 3, 600 homes were destroyed Ø The current seawall is only 15. 6 ft. high; Katrina’s storm surge was nearly 30 feet. • Insured Losses Today from Repeat of 1900 Storm Would Cost $21 - $33 Billion Ø Would become the 3 rd most expensive hurricane in US history (after Katrina and Andrew) Source: Insurance Information Institute from “A Texas-Sized Hunger for Gulf Coast Homes, ” New York Times, March 18, 2007 and www. 1900 storm. com and www. twia. org accessed July 9, 2007.
 Percentage Increase in Estimated Housing Units for MA Counties, 2000 to 2006 Coastal growth in housing construction in MA exceeds the state overall by a wide margin. Barnstable, Dukes, Plymouth and Nantucket counties are seeing large increases in housing units. Source: Population Division, U. S. Census Bureau
 Barnstable County, Massachusetts* Last period of intense hurricane activity ran from the 1930 s to 1960 *Barnstable County is mostly comprised of Cape Cod The population of Barnstable County is five times larger than it was during the last period of intense hurricane activity (19401960).
 Historical Hurricane Strikes in Dare County, NC, 1900 -2002 Population in Dare County is 6 times what it was in the 1950 s Source: NOAA Coastal Services Center, http: //hurricane. csc. noaa. gov/hurricanes/pop. jsp; Insurance Info. Institute.
 Historical Hurricane Strikes in Suffolk County, NY, 1900 -2002 Population in Suffolk County is 4. 5 times what it was in the 1940 s Source: NOAA Coastal Services Center, http: //hurricane. csc. noaa. gov/hurricanes/pop. jsp; Insurance Info. Institute.
 Hurricane Strikes vs. Population for Charleston County, South Carolina Source: NOAA
 Public Attitude Monitor 2006: Unfairness of Policyholder Subsidies Most non-coastal policyholders believe premium subsidies for coastal property owners are unfair Coastal States Source: Insurance Research Council
 Public Attitude Monitor 2006: Unfairness of Taxpayer Subsidies Most non-coastal dwellers believe taxpayer subsidies for coastal property owners are unfair Coastal States Source: Insurance Research Council
 Insured Lighting Losses And Paid Claims, 2004 -2006 Lighting losses are rising even as the number of claims falls due to increasing number and value of household electronic devices Source: Insurance Information Institute.
 Average Cost per Lightning Claim, 2004 - 2006 Average cost per lightning claim increased $800 or 30% from 2004 to 2006 due to the increasing number and value of household electronic devices Source: Insurance Information Institute.
 Percentage of California Homeowners with Earthquake Insurance, 1994 -2004* The vast majority of California homeowners forego earthquake coverage & play Russian Roulette with their most valuable asset. *Includes CEA policies beginning in 1996. **2006 estimate from Insurance Information Network of CA. Source: California Department of Insurance; Insurance Information Institute.
 REINSURANCE MARKETS Reinsurance Prices are Stabilizing; Falling in Some Areas
 Share of Losses Paid by Reinsurers, by Disaster* Reinsurance is playing an increasingly important role in the financing of mega. CATs; Reins. Costs are skyrocketing *Excludes losses paid by the Florida Hurricane Catastrophe Fund, a FL-only windstorm reinsurer, which was established in 1994 after Hurricane Andrew. FHCF payments to insurers are estimated at $3. 85 billion for 2004 and $4. 5 billion for 2005. Sources: Wharton Risk Center, Disaster Insurance Project; Insurance Information Institute.
 US Reinsurer Net Income & ROE, 1985 -2006 Reinsurer profitability has rebounded Source: Reinsurance Association of America.
 Debate Over Reinsurance Market Performance & Government • Reinsurance markets typically suffer large shocks, followed by a period of higher prices and transient capacity constraints • A new equilibrium between Supply and Demand is typically found within 18 months, commensurate with changes in the risk landscape. This is Economics 101 and is a textbook illustration of how capitalism works. • A competing hypothesis suggests that reinsurance markets “fail” because they do not provide a stable price or quantity of protection as is required in an economy with continuously exposed fixed assets, especially one that is growth oriented • Public Policy Solution: Acting on this hypothesis generally results in displacement of private (re)insurance capital by government intermediaries • Question Asked: Are policyholders and the economy better served through free markets, government or some hybrid? Sources: Insurance Information Institute
 Catastrophe Regulation & Litigation Is the Pendulum Swinging Against Insurers?
 Financing CAT Risk: Ideas & Proposals Insurers & Policymakers Are Trying to Tackle this Difficult Issue
 Proposals & Ideas Abound • Insurers and Policymakers Have Proposed and Support a Wide Range of Ideas and Proposals • Proposals Reflect Different Assessments of the Risk and About the Appropriate Role of Government vis a vis Private Markets • Approaches Range from Free Market, Pure Risk-Based Pricing to Significant and Active Role by State/Federal Government • Some Proposals Call for a Government “Back Stop” That Comes into Play at Some Level of Loss (National CAT Fund) • Some Believe that Level is When an Event Threatens Solvency • Remaining Availability/Affordability Issues May Lend Themselves to Government Role Under Any Plan
 How the Homeowners Defense Act of 2007 Would Operate Source: Zurich Technical Center, Federal Legislative Series Report, August 31, 2007.
 Homeowners Defense Act of 2007: How it Works & Rationale The Act has Two Main Components: 1. Establishment of Consortium to encourage state facilities to cede risk into the private markets, particularly the catastrophe bond markets 2. Creation of a Federal loan program to provide preevent liquidity and post-event long term financing for state residual markets and catastrophe funds Source: Zurich Technical Center, Federal Legislative Series Report, August 31, 2007.
 Homeowners Defense Act of 2007: How it Works & Rationale • With the back-drop of terrifying financial conditions within State property residual markets in certain states, the objectives of the Bill appear to be: 1. Transfer of catastrophic risk from under-capitalized state facilities into the global reinsurance network and capital markets 2. Ensuring the ability of these State facilities to make good on their commitments in the weeks after a storm and to spread over-time the potentially massive state taxpayer burden caused by under-capitalization and unsound pricing Source: Zurich Technical Center, Federal Legislative Series Report, August 31, 2007.
 Homeowners Defense Act of 2007: How it Works & Rationale The Main Questions Appear to be Whether: 1. The Bill would lead to the structural changes necessary to bring these facilities into financial health over time or simply enable further fiscal deterioration 2. The State facilities could be otherwise motivated to purchase reinsurance and explore capital market solutions without the need for Federal involvement 3. Adequate private capital can be mustered to meet the borrowing needs of the State catastrophe funds and residual markets Source: Zurich Technical Center, Federal Legislative Series Report, August 31, 2007.
 • TRIA expires 12/31/07. The current") Terrorism Risk Insurance Act Federal Terrorism Reinsurance (TRIA) • TRIA expires 12/31/07. The current federal program offers $100 billion of coverage subject to a $27. 5 B industry aggregate retention. • Under S. XXXX: “Terrorism Risk Insurance Program Reauthorization Act of 2007” Ø Ø Ø Ø Ø • 7 -Yr. Extension, expiring 12/31/14 Maintains 20% Direct Earned Premium Deductible for duration of Extension NBCR risks remain excluded (in contrast to House bill) No personal lines or group life Eliminates distinction between foreign and domestic acts of terrorism Deletes requirement that terrorist act be on behalf of foreign person or foreign interest Changes in definition of terrorist act require substantial rate and form filings in states Federal government’s cap remains at $100 billion through 2014 Requires Comptroller General to issue report within 1 year on feasibility of NBCR insurance market; CG must also issue report within 180 days on obstacles in development of private sector market for terror insurance Administration has said it will not oppose Senate bill (issued veto threat for House) Sources: Insurance Information Institute
Terrorism Risk Insurance Act Federal Terrorism Reinsurance (TRIA) • TRIA expires 12/31/07. The current federal program offers $100 billion of coverage subject to a $27. 5 B industry aggregate retention. • Under S. XXXX: “Terrorism Risk Insurance Program Reauthorization Act of 2007” Ø Ø Ø Ø Ø • 7 -Yr. Extension, expiring 12/31/14 Maintains 20% Direct Earned Premium Deductible for duration of Extension NBCR risks remain excluded (in contrast to House bill) No personal lines or group life Eliminates distinction between foreign and domestic acts of terrorism Deletes requirement that terrorist act be on behalf of foreign person or foreign interest Changes in definition of terrorist act require substantial rate and form filings in states Federal government’s cap remains at $100 billion through 2014 Requires Comptroller General to issue report within 1 year on feasibility of NBCR insurance market; CG must also issue report within 180 days on obstacles in development of private sector market for terror insurance Administration has said it will not oppose Senate bill (issued veto threat for House) Sources: Insurance Information Institute
 Catastrophe Litigation • Insurers have won virtually every major case in post-Katrina litigation environment Ø Most cases centered on validity of flood exclusion and various wind vs. water theories • This came at a high PR cost as post-Katrina litigation was dragged out over a 2 -year period accounting for the vast majority of negative press in the first 16 months after the storm Ø FL significantly added to negative press in 2007 • While the industry was successful at explaining the rational for pursuing most cases, it struggled with the classic David vs. Goliath story • Championed by personally affected politicians • Feeds “Insurance Hoax” genre of stories Ø View that insurers systematically deny, delay and lowball Ø Bad Faith litigation is wave of future (e. g. , LA AG suit) • Exacerbated by hundreds of thousands of nonrenewals
 Summary • Industry results were unsustainably good 2006/07; Overall profitability reached its highest level (est. 14%) since 1988 Ø Strong 2007 but profitability slipping • Underwriting results were aided by lack of CATs & favorable underlying loss trends, including tort system improvements • Most of the escalating toll from CAT losses is the direct of state and local decisions to permit development in vulnerable areas and then provide insurance subsidies to property owners, killing the “messenger of risk” • States/communities will never relinquish this right and therefore losses will spiral upward indefinitely Ø Mitigation, fortified homes can have significant tempering effect on aggregate losses if widely implemented and enforced • Property cat reinsurance markets past peak & more competitive • Premium growth rates are slowing to their levels since the late 1990 s; Insurance is more affordable in most locations • Clear need to remain underwriting focused • Major Challenges: Ø Slow Growth Environment Ahead Ø Maintaining price/underwriting discipline Ø Managing variability/volatility of results Ø Managing regulatory/litigation threats
 Insurance Information Institute On-Line If you would like a copy of this presentation, please give me your business card with e-mail address