

6. Perel_Moscow 2016 O2 del.pptx
- Количество слайдов: 75
: An oversimplified concept? Azriel Perel Professor of Anesthesiology and Intensive") Oxygen delivery (DO 2): An oversimplified concept? Azriel Perel Professor of Anesthesiology and Intensive Care Sheba Medical Center, Tel Aviv University, Israel Moscow, Russia, 2016
Oxygen delivery (DO 2): An oversimplified concept? Azriel Perel Professor of Anesthesiology and Intensive Care Sheba Medical Center, Tel Aviv University, Israel Moscow, Russia, 2016
 Pulsion/MAQUET (Germany)") Disclosure Masimo (USA) Pulsion/MAQUET (Germany)
Disclosure Masimo (USA) Pulsion/MAQUET (Germany)
 DO 2 = Ca. O 2 X CO Ca.") The Oxygen Delivery (DO 2) DO 2 = Ca. O 2 X CO Ca. O 2 = Arterial oxygen content (O 2 in 100 ml) CO = Cardiac output
The Oxygen Delivery (DO 2) DO 2 = Ca. O 2 X CO Ca. O 2 = Arterial oxygen content (O 2 in 100 ml) CO = Cardiac output
 DO 2 = Ca. O 2 X CO Ca.") The Oxygen Delivery (DO 2) DO 2 = Ca. O 2 X CO Ca. O 2 = Hgb X 1. 34 X Sa. O 2 + (Pa. O 2 X 0. 0032) Ca. O 2 = 15 X 1. 34 X 1. 0 + (100 X 0. 0032) ~ 20 ml/100 cc DO 2 = 20 X 10 X 5 = 1000 ml/min
The Oxygen Delivery (DO 2) DO 2 = Ca. O 2 X CO Ca. O 2 = Hgb X 1. 34 X Sa. O 2 + (Pa. O 2 X 0. 0032) Ca. O 2 = 15 X 1. 34 X 1. 0 + (100 X 0. 0032) ~ 20 ml/100 cc DO 2 = 20 X 10 X 5 = 1000 ml/min
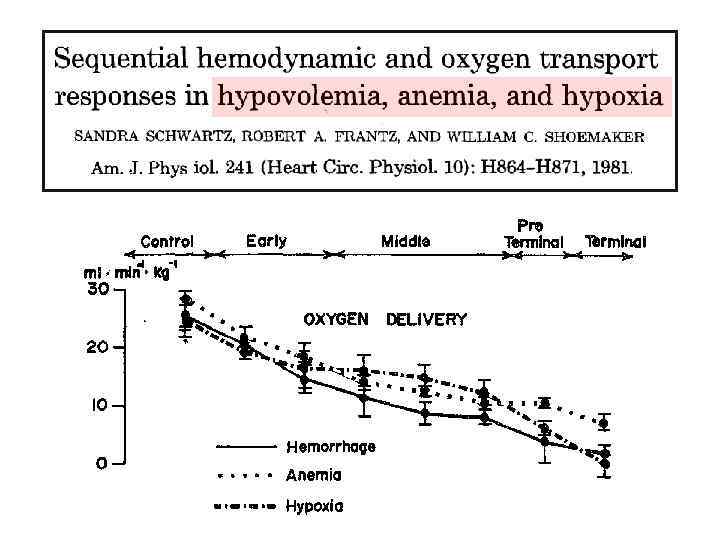
 Venous oximetry. Bloos, Reinhart. Intensive Care Med 2005; 31: 911 -3 O 2 Delivery ? ? ?
 DO 2 = Ca. O 2 X CO Ca. O 2 = Hgb X 1. 34 X Sa. O 2 + (Pa. O 2 X 0. 0032) Ø Prompt detection of any abnormalities in the individual DO 2 components is of great importance. Ø What are the optimal values of these components in individual patients? Ø How to best titrate our therapeutic interventions, namely, Blood, Oxygen and Fluids, which are all potentially detrimental when given in excess?
 DO 2 = Ca. O 2 X CO Ca. O 2 = Hgb X 1. 34 X Sa. O 2 + (Pa. O 2 X 0. 0032) Sp. Hb Sp. O 2 ORI PVI Hemoglobin Oxygen Saturation Oxygenation Reserve Index Pleth Variability Index
 DO 2 = Ca. O 2 X CO Ca. O") Patient blood management (PBM) DO 2 = Ca. O 2 X CO Ca. O 2 = Hgb X 1. 34 X Sa. O 2 + (Pa. O 2 X 0. 0032) Complications! Costs!
Patient blood management (PBM) DO 2 = Ca. O 2 X CO Ca. O 2 = Hgb X 1. 34 X Sa. O 2 + (Pa. O 2 X 0. 0032) Complications! Costs!
 DO 2 = Ca. O 2 X CO ? Ca.") Patient blood management (PBM) DO 2 = Ca. O 2 X CO ? Ca. O 2 = 7 X 1. 34 X 1. 0 + (0. 3) ~ 10 ml/100 cc ? DO 2 = 10 X 5 = 500 ml/min
Patient blood management (PBM) DO 2 = Ca. O 2 X CO ? Ca. O 2 = 7 X 1. 34 X 1. 0 + (0. 3) ~ 10 ml/100 cc ? DO 2 = 10 X 5 = 500 ml/min
 The lower you fly, the lesser is the tolerance for an error!
 DO 2 = Ca. O 2 X CO Ca. O") Patient blood management (PBM) DO 2 = Ca. O 2 X CO Ca. O 2 = Hgb X 1. 34 X Sa. O 2 + (Pa. O 2 X 0. 0032) Sp. Hb
Patient blood management (PBM) DO 2 = Ca. O 2 X CO Ca. O 2 = Hgb X 1. 34 X Sa. O 2 + (Pa. O 2 X 0. 0032) Sp. Hb
 Sp. Hb and t. Hb measurements over 4 days in a 84 y/o female patient being treated for pneumonia in the ICU Shander A. et al. Presented at Society for the Advancement of Blood Medicine (SABM) Annual Meeting 2010; San Juan, Puerto Rico
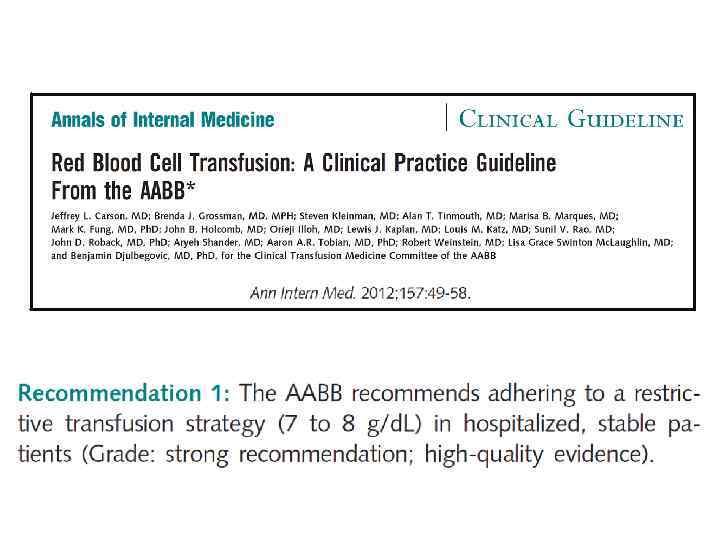
 Ø Indiscriminate reliance on a single Hgb “transfusion trigger” and rigid protocols falls into the category of “imprecision medicine. ” Ø Technical advances including non invasive monitoring facilitate more personalized and precise medical management.
 Sp. Hb monitoring in a patient after multiple trauma Mc. Evoy MT. Am J Crit Care. 2013 Nov; 22(6 Suppl): e. S 1 13.
.") Ø The most common complication in these 79, 183 patients was bleeding (6. 2%). Ø Bleeding was also the complication with the greatest overall impact on mortality and end organ dysfunction.
Ø The most common complication in these 79, 183 patients was bleeding (6. 2%). Ø Bleeding was also the complication with the greatest overall impact on mortality and end organ dysfunction.
 The score can be effective in identifying patients at higher and lower than average likelihood of major complications and/or death after surgery.
 Ø There is marked variation in blood transfusion practices. Ø Most transfusions given intraoperatively are for hypotension or other indicators of tissue hypoperfusion. Ø A transfusion threshold or trigger is less relevant in the intraoperative setting. Ø Single unit red cell transfusions should be used more often.
 Ø The post transfusion Hb was unnecessarily high, suggesting that the decision to transfuse led to more than 1 p. RBC unit at a time. Ø Some hospitals that claimed to have a restrictive transfusion strategy transfused at rather high Hb concentrations.
 Continuous Sp. Hb during exploratory laparotomy The anesthesiologist held back 2 additional units 2 units RBC Incision made. 1 liter of blood noted in suction canister within minutes
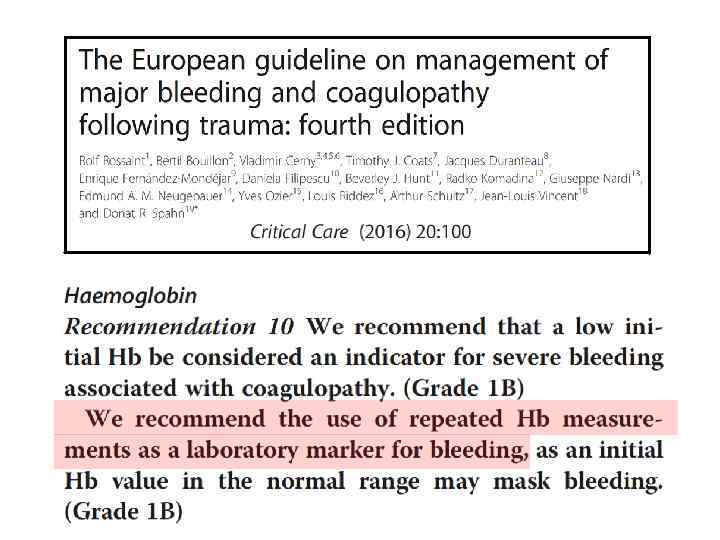
 Many transfusions are not preceded by a Hb measurement.
 Sp. Hb + PVI monitoring during partial hepatectomy Sp. Hb IV crystalloids started Dilution! PVI
 Ø Hemodilution results in a loss of RBC filled capillaries, leading to a iatrogenic reduction in oxygen carrying capacity and the development of organ dysfunction.
 Cardiac µPO 2 Renal µPO 2 started to decrease at a Hct of 38%! Intestinal µPO 2
 Ø Hemodilution results in a loss of RBC filled capillaries, leading to a iatrogenic reduction in oxygen carrying capacity and the development of organ dysfunction. Ø Such a hemodilutional loss of coherence can be corrected by maintaining an adequate Hct and by the appropriate administration of quality blood.
 DO 2 = Ca. O 2 X CO Ca. O") Oxygenation (Sp. O 2) DO 2 = Ca. O 2 X CO Ca. O 2 = Hgb X 1. 34 X Sa. O 2 + (Pa. O 2 X 0. 0032) Sp. O 2
Oxygenation (Sp. O 2) DO 2 = Ca. O 2 X CO Ca. O 2 = Hgb X 1. 34 X Sa. O 2 + (Pa. O 2 X 0. 0032) Sp. O 2
 Aiming for an Sp. O 2 of 92% is reasonable for ensuring satisfactory oxygenation in Caucasian patients requiring mechanical ventilation.
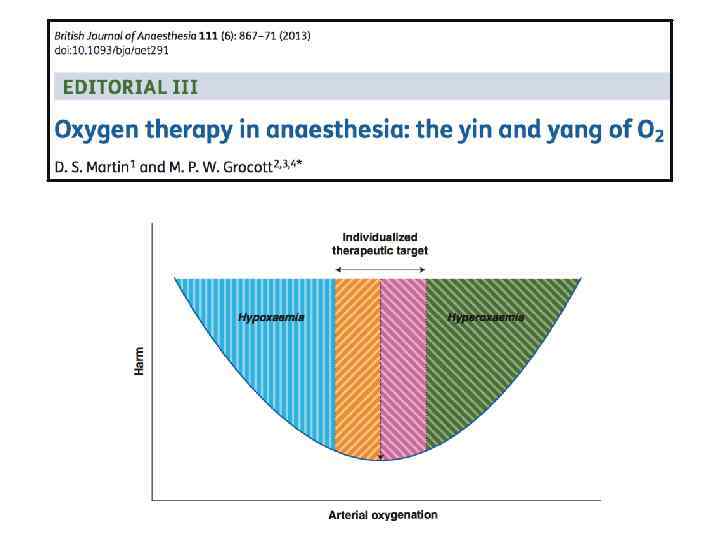
 “We propose to consider resetting the target range for arterial oxygenation higher (85– 110 mm Hg) as a potential strategy to improve the long term outcomes (cognitive and physical impairment) of ARDS survivors”.
 establishes a highly available source of O 2 that can") Ø Hyperoxic ventilation (HV) establishes a highly available source of O 2 that can be utilized effectively for tissue oxygenation. Ø HV increases the tolerance to anemia (Hb equivalent in the range of 3 7 g/d. L).
Ø Hyperoxic ventilation (HV) establishes a highly available source of O 2 that can be utilized effectively for tissue oxygenation. Ø HV increases the tolerance to anemia (Hb equivalent in the range of 3 7 g/d. L).
 The limitations of pulse oximetry Sp. O 2 = 97% Is the Pa. O 2 100 or 400 mm. Hg? Only the Pa. O 2 can be used to assess the hyperoxic range; however, measurements are both intermittent and delayed.
 DO 2 = Ca. O 2 X CO Ca. O") Oxygenation (Pa. O 2) DO 2 = Ca. O 2 X CO Ca. O 2 = Hgb X 1. 34 X Sa. O 2 + (Pa. O 2 X 0. 0032) ORI – Oxygen Reserve Index
Oxygenation (Pa. O 2) DO 2 = Ca. O 2 X CO Ca. O 2 = Hgb X 1. 34 X Sa. O 2 + (Pa. O 2 X 0. 0032) ORI – Oxygen Reserve Index
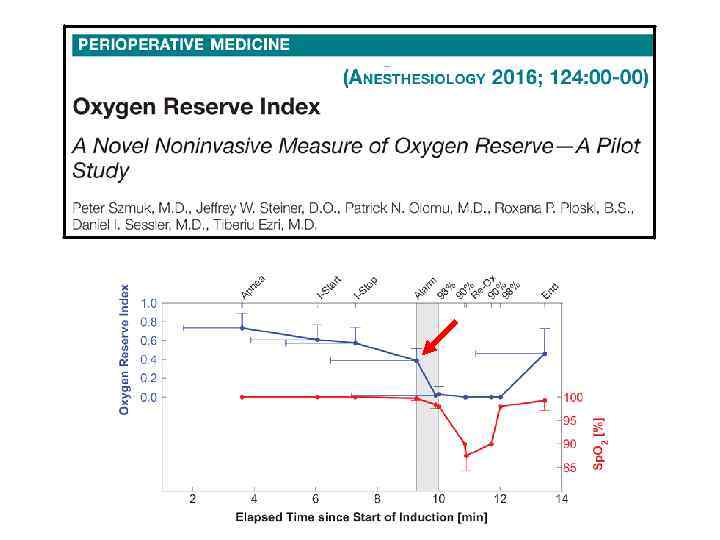
 ORI is a non invasive continuous parameter that provides") The Oxygen Reserve Index (ORI) ORI is a non invasive continuous parameter that provides information about the oxygenation in the moderate hyperoxic range (Pa. O 2 >100 and <≈200 mm. Hg) in patients receiving supplemental oxygen. ORI is an “index” with a unit less scale between 0 and 1.
The Oxygen Reserve Index (ORI) ORI is a non invasive continuous parameter that provides information about the oxygenation in the moderate hyperoxic range (Pa. O 2 >100 and <≈200 mm. Hg) in patients receiving supplemental oxygen. ORI is an “index” with a unit less scale between 0 and 1.
 100 ←ORI Sensitive region→ Sv. O 2 80") Sa. O 2 Oxyhemoglobin saturation (%) 100 ←ORI Sensitive region→ Sv. O 2 80 As Pa. O 2 increases > 100 mm. Hg, Sa. O 2 maximizes at ~100% while Sv. O 2 at the measurement site continues to increase until it stabilizes at a Pa. O of about 2 200 mm. Hg. The resulting change in light absorption over this Pa. O 2 range is the basis for the ORI calculation. 60 40 20 Hypoxia Normoxia Hyperoxia 0 Pa. O 2 (mm. Hg) 0 30 5 5 27 27 0 25 Venous Pa. O 2/s. O 2 curve 5 5 22 22 0 20 5 5 17 17 0 15 5 5 12 12 0 10 75 75 50 25 25 0 Arterial Pa. O 2/s. O 2 curve
Sa. O 2 Oxyhemoglobin saturation (%) 100 ←ORI Sensitive region→ Sv. O 2 80 As Pa. O 2 increases > 100 mm. Hg, Sa. O 2 maximizes at ~100% while Sv. O 2 at the measurement site continues to increase until it stabilizes at a Pa. O of about 2 200 mm. Hg. The resulting change in light absorption over this Pa. O 2 range is the basis for the ORI calculation. 60 40 20 Hypoxia Normoxia Hyperoxia 0 Pa. O 2 (mm. Hg) 0 30 5 5 27 27 0 25 Venous Pa. O 2/s. O 2 curve 5 5 22 22 0 20 5 5 17 17 0 15 5 5 12 12 0 10 75 75 50 25 25 0 Arterial Pa. O 2/s. O 2 curve
 ORI validation study: preliminary results ORI=0. 61 ORI=0. 69 Scheeren TWL et al. , Euroanaesthesia 2016: 01 AP 04 -9
: 750 -1") Anesthesiology. 2016; 124(4): 750 -1
Anesthesiology. 2016; 124(4): 750 -1
 30 min
 Ø Pre oxygenation should be routine, as oxygen reserves are not always sufficient to cover the duration of intubation. Ø Predictive risk factors for inadequate pre oxygenation share overlap with criteria predictive of difficult mask ventilation.
 ORI response to preoxygenation before intubation and extubation Fi. O 2 decreased to 35% following intubatiion Preoxygenation prior to extubation (Pa. O 2 285 mm. Hg) Preoxygenation PO 2
 2016
2016
 2016
2016
 2016
2016
 Crit Care Med 2015; 43: 574– 583 Am J Respir Crit Care Med 2016; 193: 273 -80 Pa. O 2?
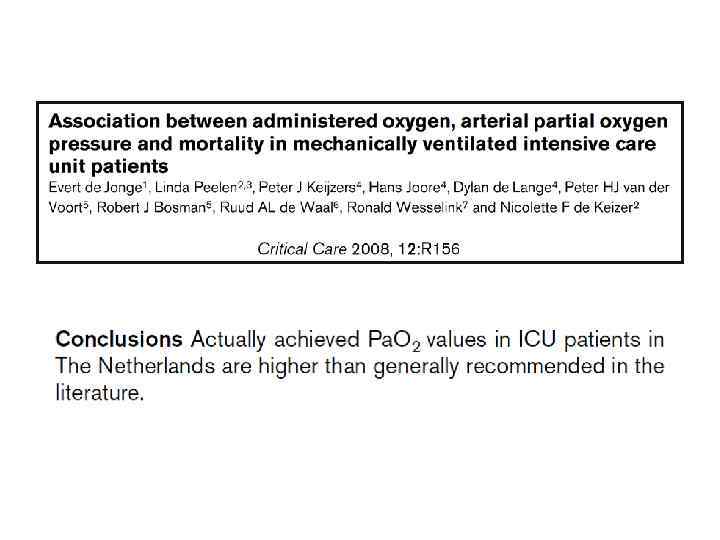
 Physicians frequently prescribe higher FIO 2 levels than are necessary to achieve their arterial oxygenation goal, further increasing the risk of oxygen toxicity.
 Ø May provide early alarm when oxygenation deteriorates. Ø") The Oxygen Reserve Index (ORI) Ø May provide early alarm when oxygenation deteriorates. Ø May make pre oxygenation visible. Ø May facilitate Fi. O 2 titration and prevent unintended hyperoxia. Ø May reflect immediate response to PEEP, recruitment maneuver, spontaneous improvement in ARDS, etc.
The Oxygen Reserve Index (ORI) Ø May provide early alarm when oxygenation deteriorates. Ø May make pre oxygenation visible. Ø May facilitate Fi. O 2 titration and prevent unintended hyperoxia. Ø May reflect immediate response to PEEP, recruitment maneuver, spontaneous improvement in ARDS, etc.
 DO 2 = Ca. O 2 X CO Ca. O") The Cardiac Output (CO) DO 2 = Ca. O 2 X CO Ca. O 2 = Hgb X 1. 34 X Sa. O 2 + (Pa. O 2 X 0. 0032) Fluids! Inotropes!
The Cardiac Output (CO) DO 2 = Ca. O 2 X CO Ca. O 2 = Hgb X 1. 34 X Sa. O 2 + (Pa. O 2 X 0. 0032) Fluids! Inotropes!
 refers to the use of fluids and/or inotropes to target") “Goal directed therapy (GDT) refers to the use of fluids and/or inotropes to target hemodynamic goals to improve oxygen delivery (DO 2) to the tissues. ”
“Goal directed therapy (GDT) refers to the use of fluids and/or inotropes to target hemodynamic goals to improve oxygen delivery (DO 2) to the tissues. ”
 The limitations of Cardiac Output Ø The individual optimal CO is difficult to assess. Ø A ‘normal’ or even high CO does not preclude the presence of inadequate regional and micro circulatory flow. Ø A low CO does not tell us WHAT to do. Ø The CO does not predict fluid responsiveness.
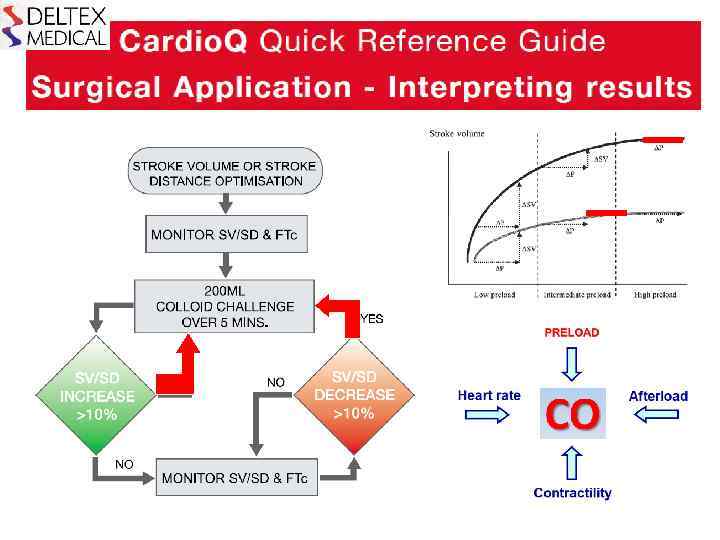
 OPTIMISE JAMA. Published on line May 19, 2014.
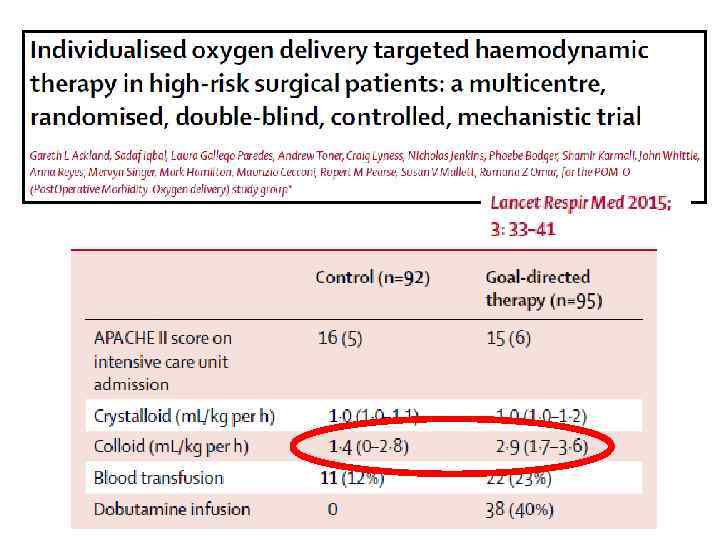
 Ø Sub study of the OPTIMISE trial including 100 of the original 368 patients enrolled in the intervention group. Ø Only 28. 6% of the fluid challenges were associated with increased stroke volume. 28. 6%!
 Azriel Perel Some of the perioperative goal directed strategies failed to show any outcome benefit because they were based on CO/SV maximization without taking into account fluid responsiveness.
 Fluids should be administered when patients require augmentation of their perfusion and are also volume responsive.
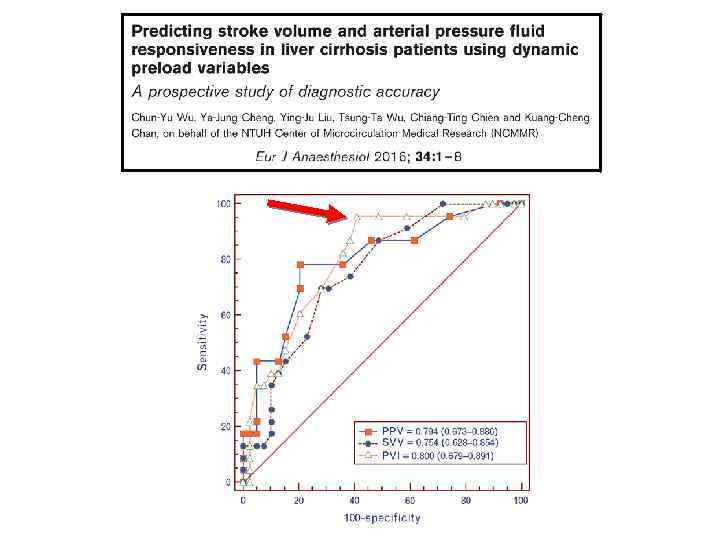
 Dynamic parameters should be used to guide fluid therapy in all surgical patients in whom their use is appropriate, as part of, or independently of, GDT strategies. SPV PPV SVV PVI
 Arterial waveform Pleth waveform PIMAX PIMIN PVI = [(PImax") The Pleth Variability Index (PVI) Arterial waveform Pleth waveform PIMAX PIMIN PVI = [(PImax PImin) / PImax] PVI
The Pleth Variability Index (PVI) Arterial waveform Pleth waveform PIMAX PIMIN PVI = [(PImax PImin) / PImax] PVI
 A higher PVI = More likely to respond to") The Pleth Variability Index (PVI) A higher PVI = More likely to respond to fluid administration
The Pleth Variability Index (PVI) A higher PVI = More likely to respond to fluid administration
 There is a significant relationship between PVI before volume expansion and change in CI after volume expansion.
 The major benefit provided by dynamic parameters is the identification of the “non responders” “Non-Responder” Preload
 The use of PVI based protocols led to a significantly decreased intraoperative net fluid balance
 PVI based protocol decreased intra operative net fluid balance from 2733 to 848 m. L (p < 0. 0001).
 The value of combined Sp. Hb + PVI monitoring Bleeding during orthopedic surgery 3 units RBCs Colloid 500 ml 2 units Plasma 2 units RBCs
 Conclusions 1. Oxygen delivery is a useful concept, but its major components have to be individually managed. 2. The correct way to manage these components is a matter of significant controversy and may occasionally pose a conflict with currently accepted guidelines. 3. The non invasive, continuous and simultaneous monitoring of Sp. O 2, ORI, Sp. Hb and PVI may facilitate timely decisions regarding the optimal management of DO 2 in the individual patient. Thank you for your attention!
 DO 2 = Ca. O 2 X CO Ca. O") The Cardiac Output (CO) DO 2 = Ca. O 2 X CO Ca. O 2 = Hgb X 1. 34 X Sa. O 2 + (Pa. O 2 X 0. 0032) Fluids Inotropes PVI
The Cardiac Output (CO) DO 2 = Ca. O 2 X CO Ca. O 2 = Hgb X 1. 34 X Sa. O 2 + (Pa. O 2 X 0. 0032) Fluids Inotropes PVI