

032cd0321cba3c2bf3394dadd0d62d5e.ppt
- Количество слайдов: 75
 Outlook and Outcomes FY 2010 Alcohol and Drug Abuse Administration Thomas P. Cargiulo, Pharm. D. , Director
 The data in this report reflect admissions to and discharges from publicly-funded treatment in Maryland reported to the Statewide Maryland Automated Record Tracking (SMART) system, a Web-based tool that provides a consentdriven patient-tracking system. Analysis of the accumulated data is a vital component of ADAA’s mission to administer available resources effectively and efficiently so that Maryland citizens in need will have access to quality treatment and recovery services.
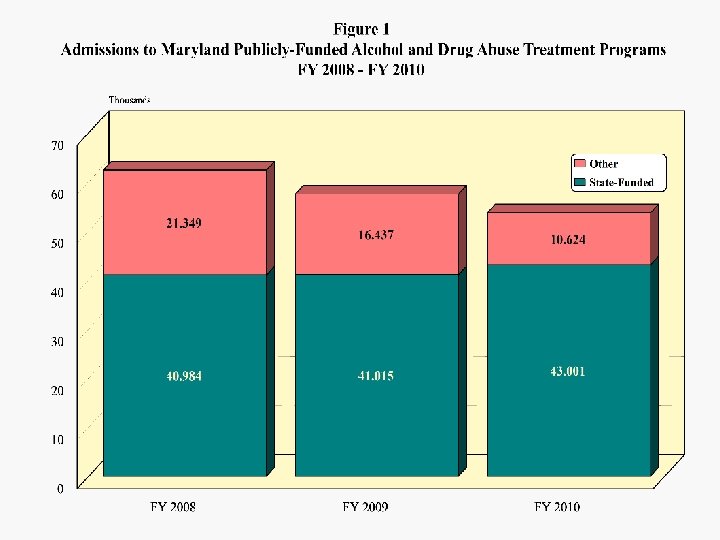
 As shown in Figure 1, State-funded admissions increased 5 percent from FY 2008 to FY 2010 while non-funded admissions were halved. Total treatment admissions fell by about 14 percent. Whereas State-funded admissions made up about two-thirds of the total in FY 2008, they made up 80 percent in FY 2010. This shift is a result of reconciliation and realignment of funding sources, and there has been some erosion of reporting by programs that receive limited or no public dollars. The 43, 001 funded admissions were accounted for by 34, 760 unique individuals (1. 24 admissions per individual).
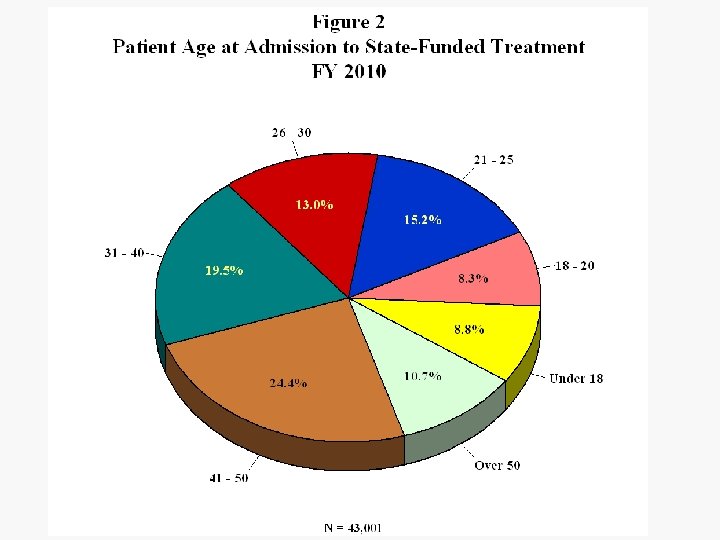
 Demographics The age breakdown of the treatment admission population remained fairly stable in FY 2010 although there was a slight decline in the under-18 group. (Figure 2) Seventeen percent of admissions were under 21 and 35 percent were over 40. Over the past few years there was a gradual trend toward more problem drug and alcohol use by older adults, but during FY 2010 there was a small shift back toward admissions in their twenties.
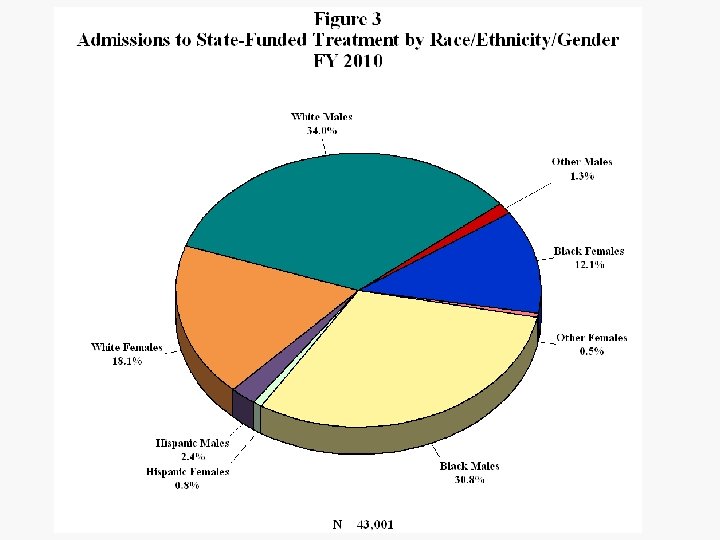
 The race/ethnicity/gender breakdown of admissions is shown in Figure 3. Overall about 32 percent of admissions were female. About 65 percent of admissions were fairly evenly split between black and white males, but the white female total was 50 percent higher than the black female total. Surprisingly the percentage of Hispanic admissions fell from about 4 in FY 2009 to 3. 2 in FY 2010. While the male/female ratio was 1. 88 for whites and 2. 55 for African Americans, it was 2. 87 for Hispanics.
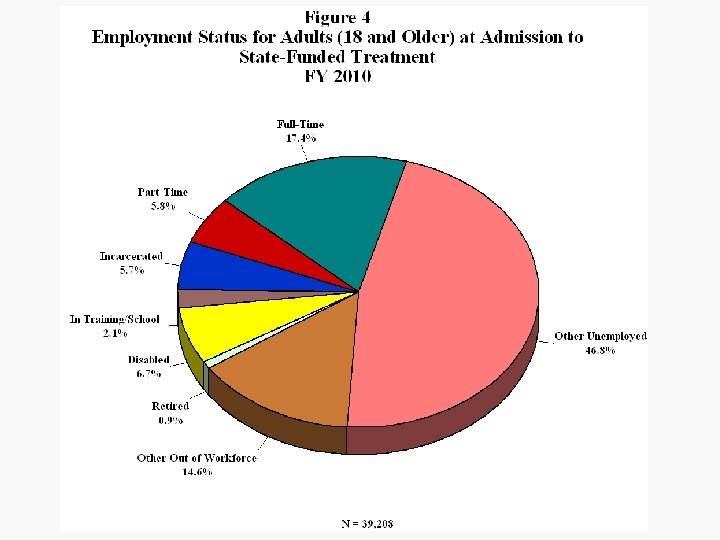
 Employment Status Figure 4 displays the distribution of FY 2010 adult admissions by employment status. Only 17 percent of adult admissions were employed full-time and 6 percent part-time as they entered treatment. Almost a third of adult admissions were employed in FY 2006; the decline is largely due to the economic difficulties facing the state and nation.
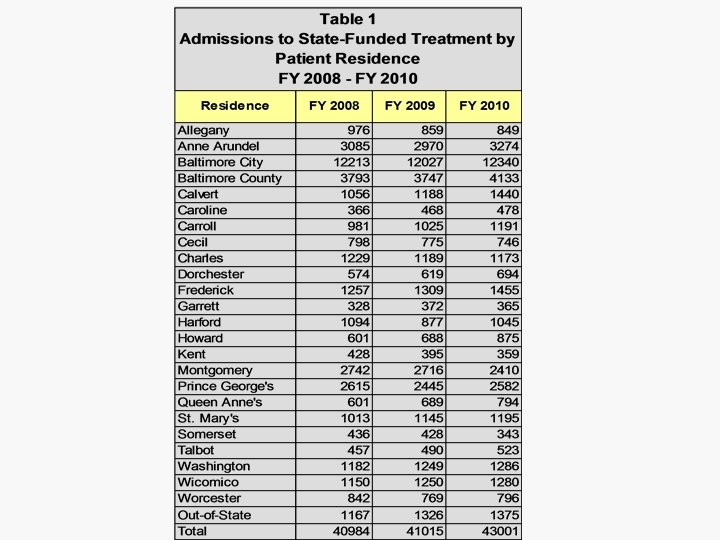
 Residence Admissions are distributed by location of residence from FY 2008 to FY 2010 in Table 1. The largest three-year increases involved residents of Howard, Calvert, Queen Anne’s and Caroline counties. Out-of-State residents increased by 18 percent. Largest declines were in Somerset, Kent, Allegany and Montgomery counties.
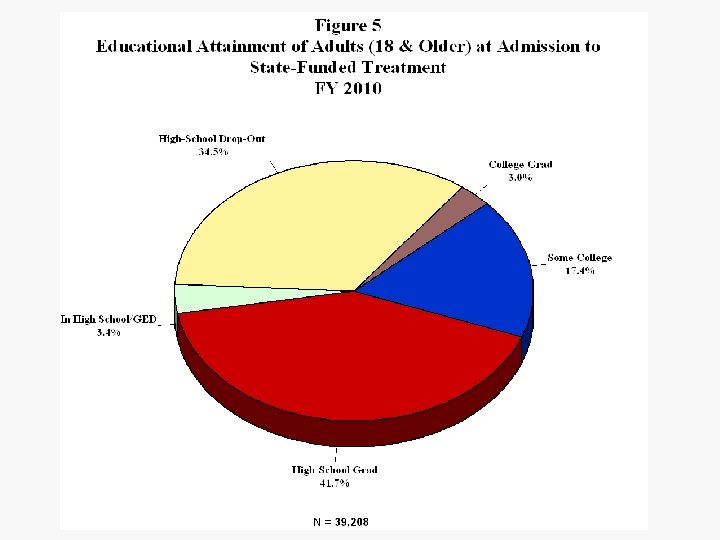
 Educational Status The educational attainment of adult admissions is shown in Figure 5. Only about 62 percent of adult FY 2010 treatment admissions had high school diplomas. Considering jointly the items on highest-school-grade completed, employment and attending grades K through 12 reveals about 35 percent of adults admitted could be classified as high-school drop-outs.
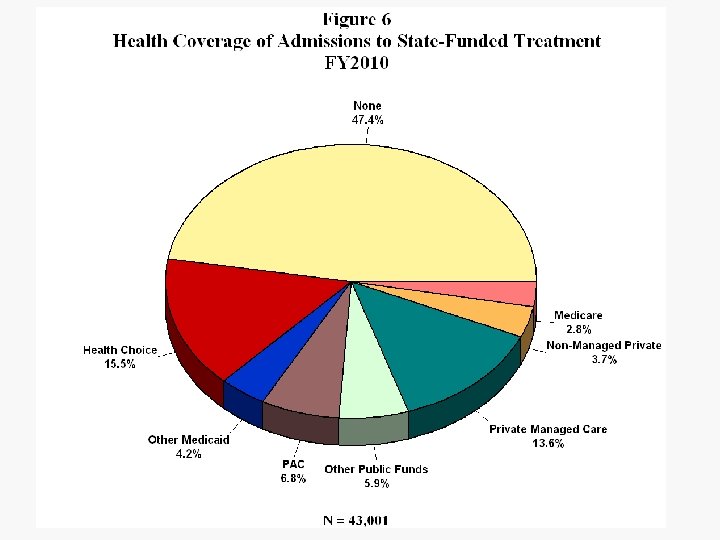
 Health Coverage Health coverage of admissions is shown in Figure 6. Nearly half of admissions reported no health coverage and another 38 percent were under a public health-care plan. The percentage of admissions with Primary Adult Care (PAC) can be anticipated to double in the first half of FY 2011 as ADAA and DHMH expand efforts to maximize coverage by this funding source.
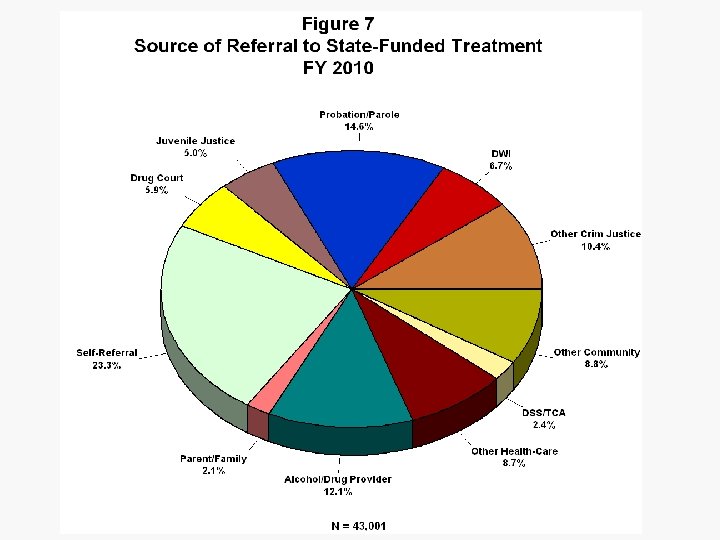
 Source of Referral Figure 7 shows that about a fourth of referrals were self or family and 21 percent were from substance-abuse or other health-care providers. Criminaljustice sources accounted for 43 percent of admissions in FY 2010.
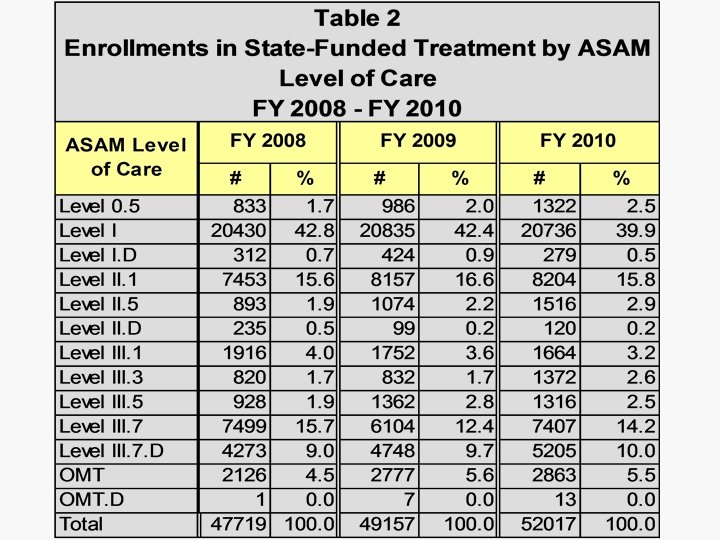
 ASAM Levels Table 2 presents the distributions of funded enrollments in levels of care over the past three years. Admissions reflect the initial enrollments in treatment episodes; subsequent enrollments during the episodes (transfers to other levels of care) are not counted as admissions. The ratio of enrollments to admissions was 1. 21 in FY 2010 compared to 1. 16 in FY 2008, indicating increased reliance on the continuum of care. Enrollments in Level 0. 5 (Early Intervention) went up by 59 percent; Level II. 5 increased by 70 percent, reflecting increased funding for that level of care. Total III. 3 and III. 5 enrollments increased 54 percent while enrollments in III. 7. D increased by 22 percent.
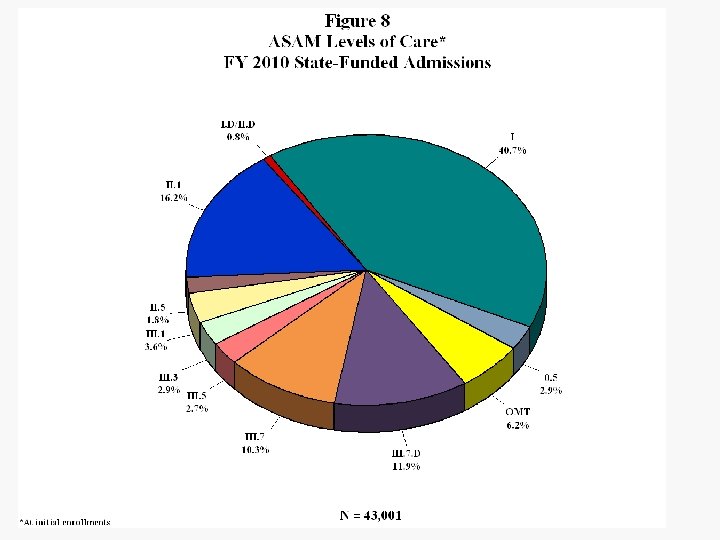
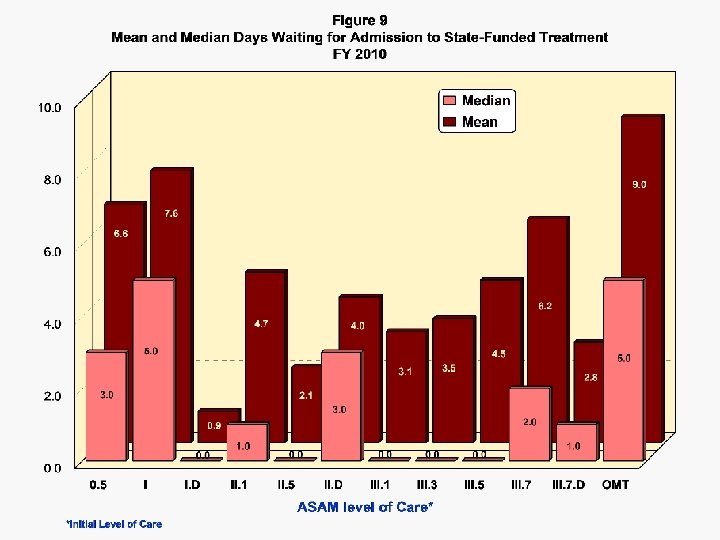
 The distribution of initial ASAM level at FY 2010 admission is shown graphically in Figure 8. Just under 70 percent of admissions were to ambulatory levels of care. Figure 9 shows most of those seeking Statefunded treatment in Maryland had less than five days between their initial request for treatment and the admission date. For Levels I. D, II. 5, III. 1, III. 3 and III. 5 the median wait to enter treatment was zero days, indicating more than half the admissions to those levels involved immediate entry.
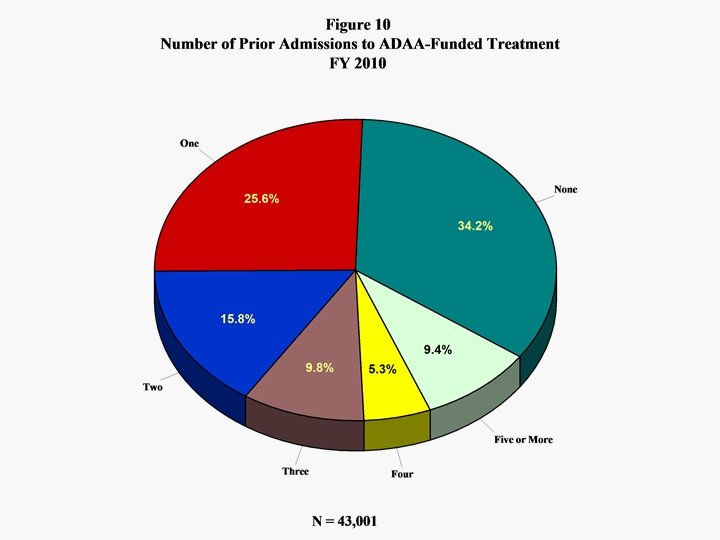
 Prior Admissions The percentage distribution of number of prior admissions is shown in Figure 10. Nearly two-thirds of FY 2010 treatment admissions had prior treatment experience. This reflects greater reliance on a continuum of care as ADAA moves toward a recovery-oriented system of care.
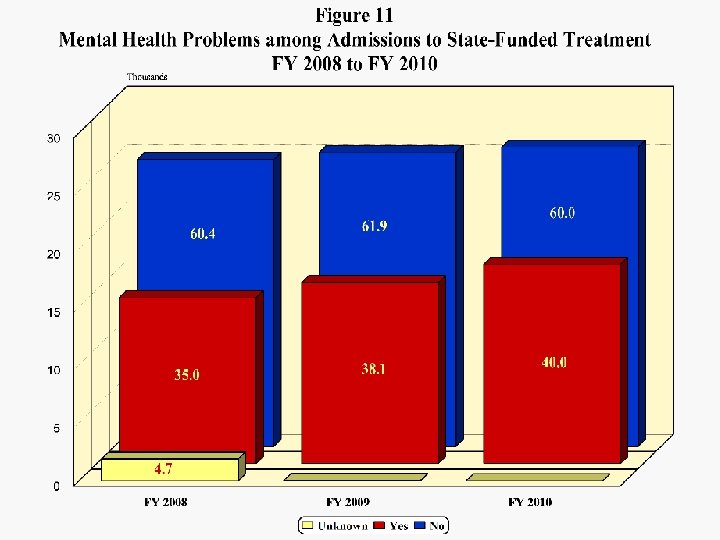
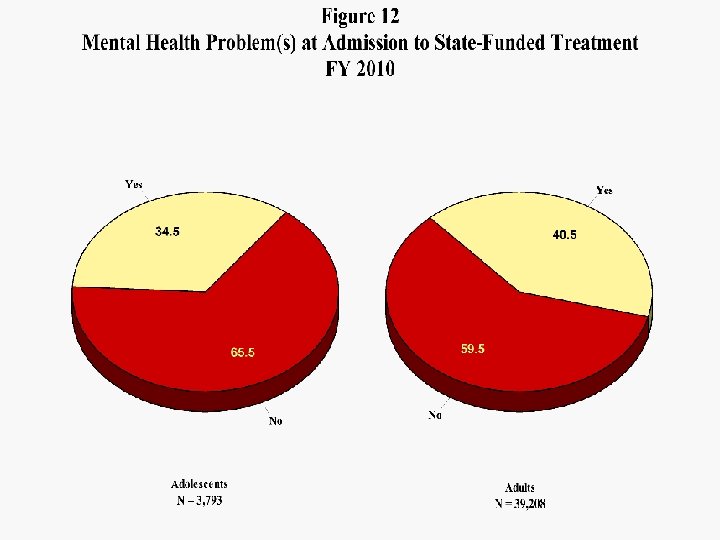
 Mental Health There was a continuing increase in the number and percentage of admissions identified as having mental health problems in FY 2009 and 2010. Figure 11 shows the percentage has gone from 35 in FY 2008 to 40 percent in FY 2010. This reflects greater awareness and increased initiatives focused on the co-occurring population. Figure 12 presents the adolescent and adult distributions of mental health problems for FY 2010, showing more than a third of adolescents and over 40 percent of adults had mental health issues.
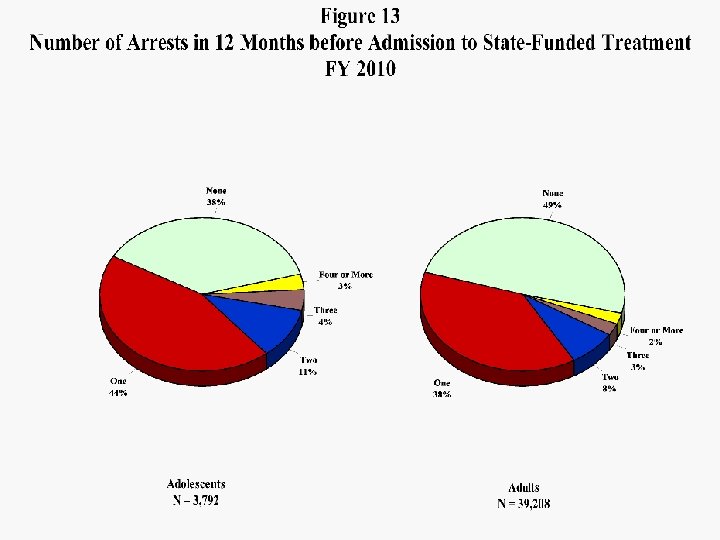
 Arrests Over half of adult and 62 percent of adolescent treatment patients had been arrested in the year preceding admission to treatment (Figure 13). The higher percentage for adolescents is related to the finding that 57 percent of adolescents were referred by the juvenile justice system.
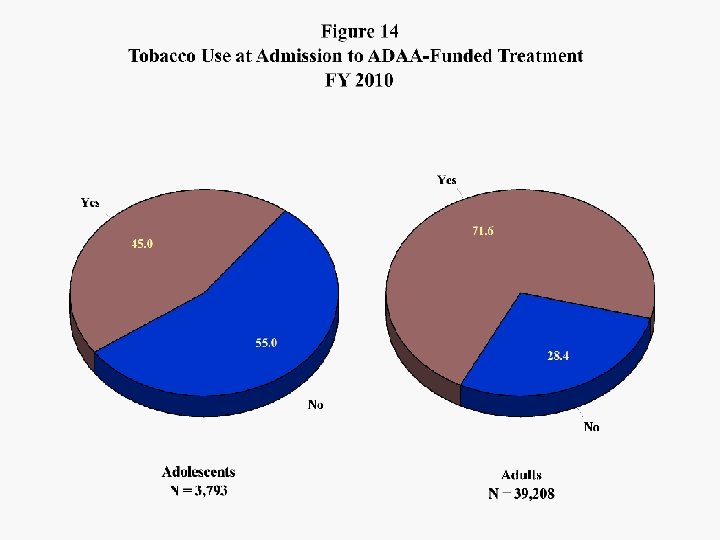
 Tobacco Use Figure 14 shows the percentages of adolescent and adult admissions using tobacco in the month preceding admission. Forty-five percent of the adolescents and over 70 percent of adult admissions were smokers, far exceeding the percentages in the general population. Previous research in Maryland has demonstrated a strong relationship between cigarette smoking and failure to complete substance-abuse treatment.
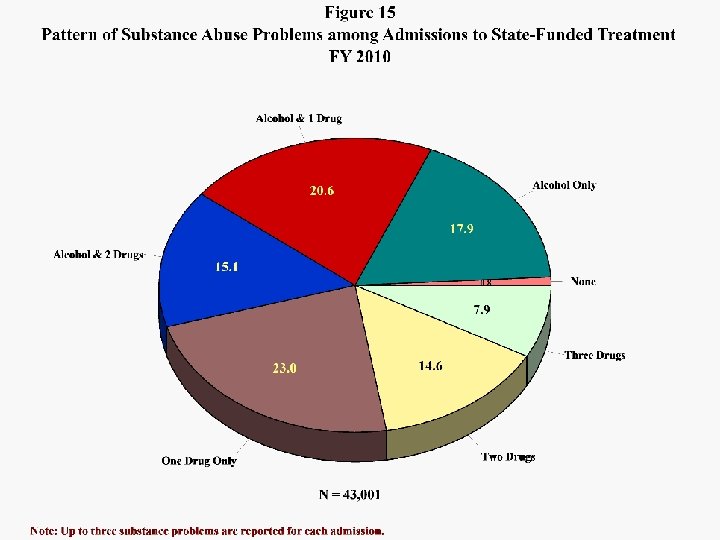
 Substance Abuse The patterns of substance abuse problems among admissions are shown in Figure 15. Alcohol was involved in about 54 percent of all admissions; nearly forty percent involved both alcohol and illicit drugs. Fifty-eight percent of admissions involved problems with multiple substances.
 Note: Up to three substance problems are reported for each admission. Percentages are based on total respondents, so they will not add to 100.
 Table 3 presents detail on the substance problems reported for admissions from FY 2008 to FY 2010. The most significant increases over the three years involved: – – – Oxycodone (91. 7 percent); Other Opiates (62. 0 percent); Benzodiazepines (57. 8 percent); PCP (30. 4 percent); and, Non-Rx Methadone (18. 7 percent). Heroin-related admissions increased by 8. 2 percent and those involving marijuana by 9. 5 percent. The largest decrease occurred among cocaine-related admissions (19. 4 percent). Figure 16 displays the three-year trends for the seven leading categories of substance problems.
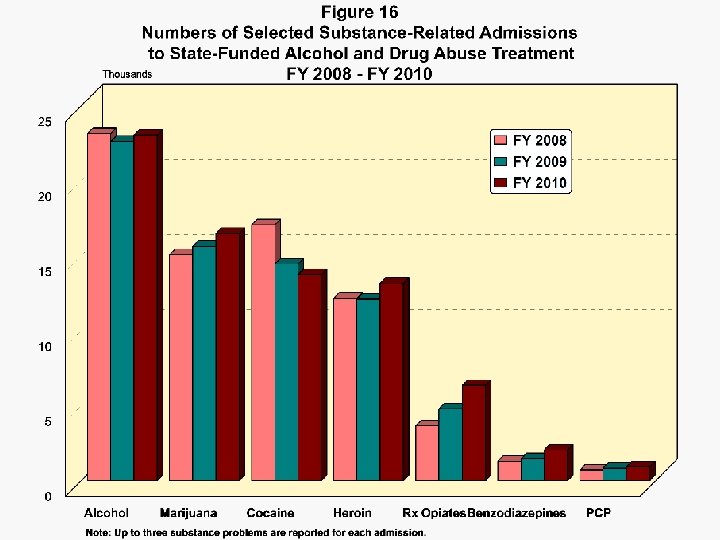
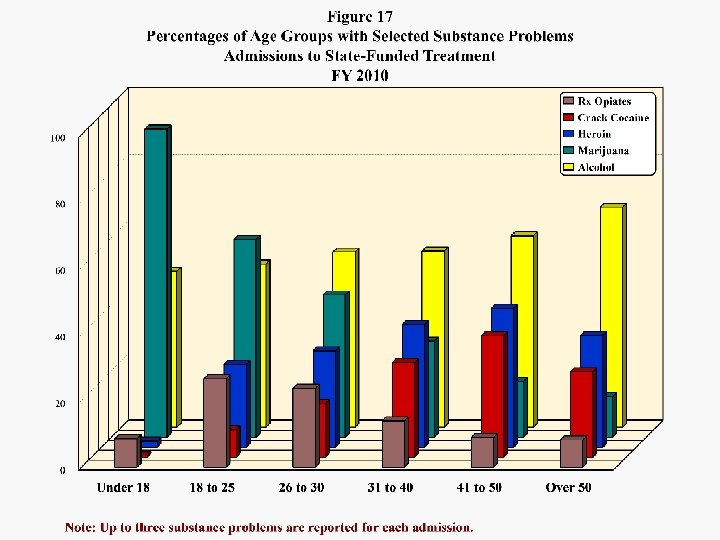
 Figure 17 distributes five leading problem substances by the percentages of each of six age groups reporting the problems, and Figure 18 does the same for each of six race/ethnic/gender groups. Eighty-nine percent of adolescents admitted had problems with marijuana and 45 percent had problems with alcohol; 40 percent had problems with both. With each succeeding age group the prevalence of marijuana problems drops sharply while that of alcohol problems generally increases. Both heroin and crack cocaine problems are most prevalent in the 41 -to-50 age group. Other-opiate problems peak at about 25 percent in the 18 to 30 age range.
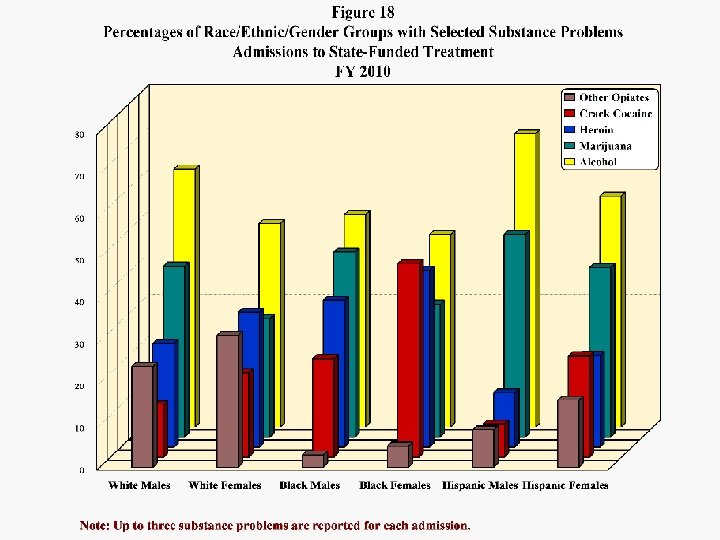
 while black") White females had the highest percentage with other opiate problems (31. 4) while black females had the highest percentages with crack cocaine (46. 2) and/or heroin (42. 2) problems. Previous research in Maryland’s substance-abusetreatment population has revealed that females entering the treatment system tend to have more severe problems with harder drugs than do males. Hispanic males were least likely to present with cocaine and heroin problems and most likely to present with alcohol (69. 9 percent) and/or marijuana problems (48. 3 percent).
White females had the highest percentage with other opiate problems (31. 4) while black females had the highest percentages with crack cocaine (46. 2) and/or heroin (42. 2) problems. Previous research in Maryland’s substance-abusetreatment population has revealed that females entering the treatment system tend to have more severe problems with harder drugs than do males. Hispanic males were least likely to present with cocaine and heroin problems and most likely to present with alcohol (69. 9 percent) and/or marijuana problems (48. 3 percent).
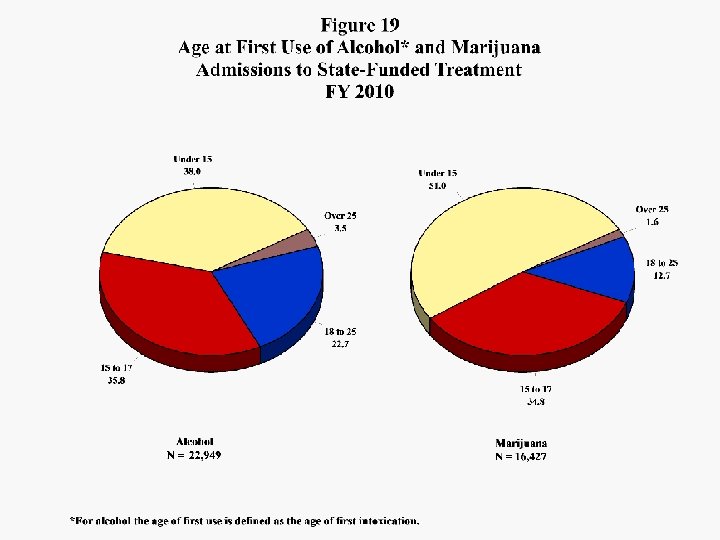
 Figure 19 shows the distributions of alcohol and marijuana-related admissions by reported age of first intoxication for alcohol and age of first use of marijuana. Over half of admissions with marijuana problems first used the drug before turning 15, and nearly forty percent of those with alcohol problems experienced their first intoxication at an earlier age than 15. Over threequarters of alcohol-related admissions experienced their first intoxication before turning 18 and over 85 percent of marijuana-related admissions first used the drug as adolescents.
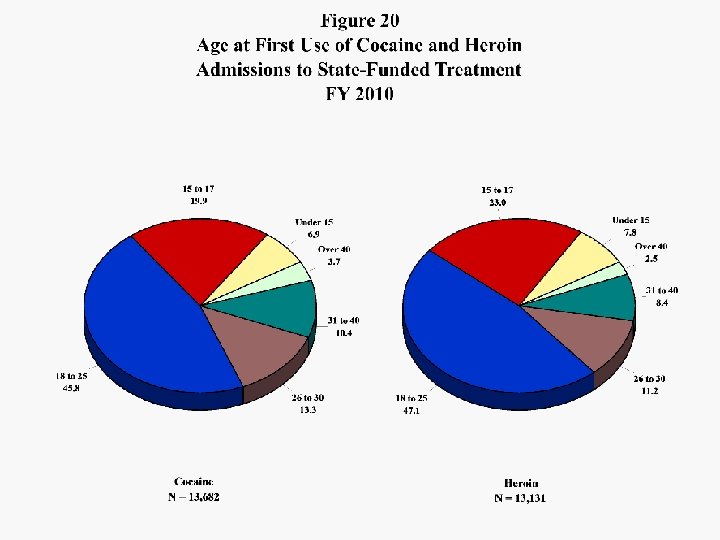
 Ages at first use of cocaine and heroin are shown in Figure 20. The distributions are similar, with 31 percent of heroin and just over one-fourth of cocaine-related cases first using those drugs in adolescence.
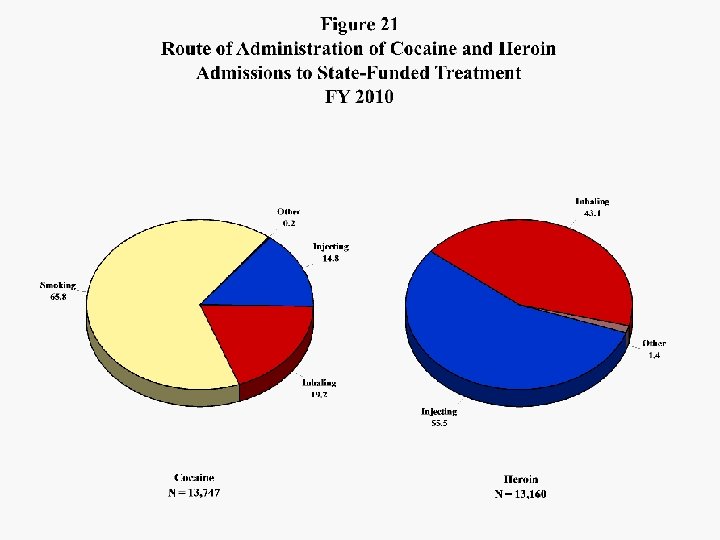
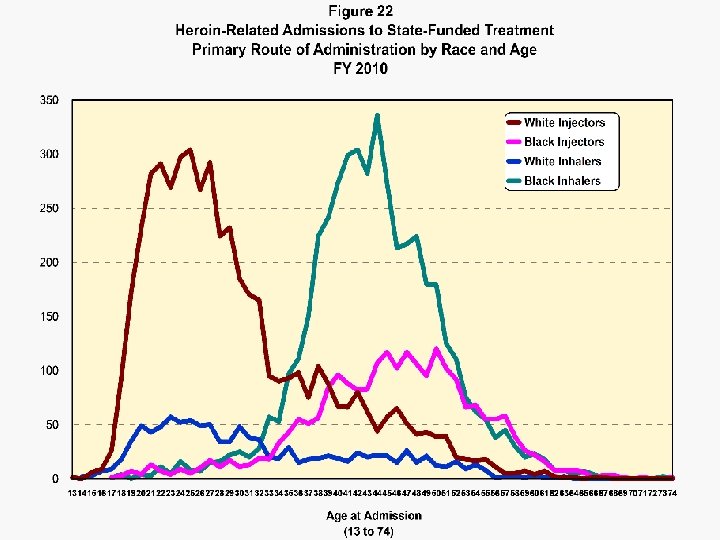
 Figure 21 displays the primary routes of administration of cocaine and heroin among FY 2010 admissions. About two-thirds of the cocaine-related admissions involved crack, or smoking the drug. In FY 2008 heroin-related admissions were evenly split between injectors and inhalers; In FY 2009 and 2010 the balance has shifted toward injection. This trend correlates with a shift toward more white and fewer black heroin-related admissions. In FY 2008 38. 5 percent of heroin cases involved whites and 59. 8 percent blacks. The respective percentages for FY 2010 were 46. 6 and 52. 1. Analysis of the interaction of age, race and route of administration of heroin, shown in Figure 22, revealed the two large components of FY 2010 heroin-related cases were white injectors in their twenties and early thirties and black inhalers in their late thirties, forties and early fifties. Black injectors were the oldest group on average, peaking at age fifty.
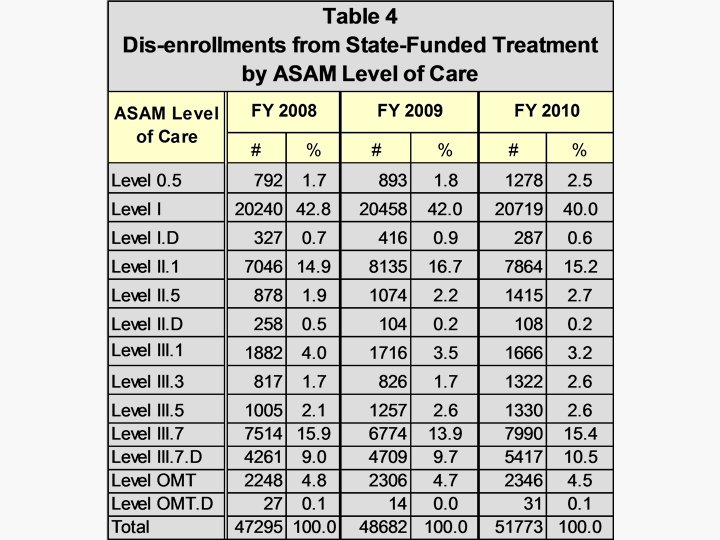
 Dis-enrollments from ADAA-funded treatment during FY 2008 to FY 2010 are distributed by ASAM level of care in Table 4. Dis-enrollments increased nearly 10 percent over the three years, reflecting in part greater reliance on the continuum of care as more patients are served in multiple levels of care. The ratios of admissions to discharges for FY 2008 to FY 2010 were 1. 00, 0. 99 and 0. 99 respectively, reflecting completeness of reporting and stability in the ADAA data system.
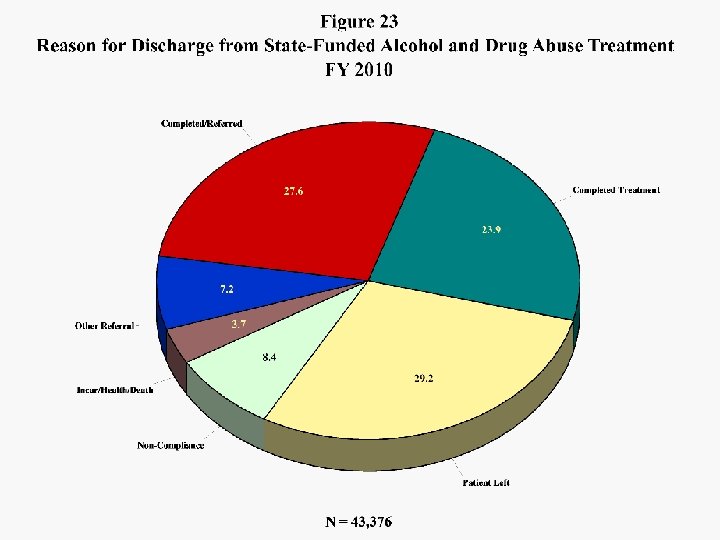
 Reason for Discharge Figure 23 breaks out reasons for discharge from treatment during FY 2010. Fifty-two percent of all discharges involved successful completion of the treatment plan and 28 percent were referred after completion of the immediate treatment plan. Nearly 30 percent left before completing treatment and 8 percent were discharged for noncompliance with program rules.
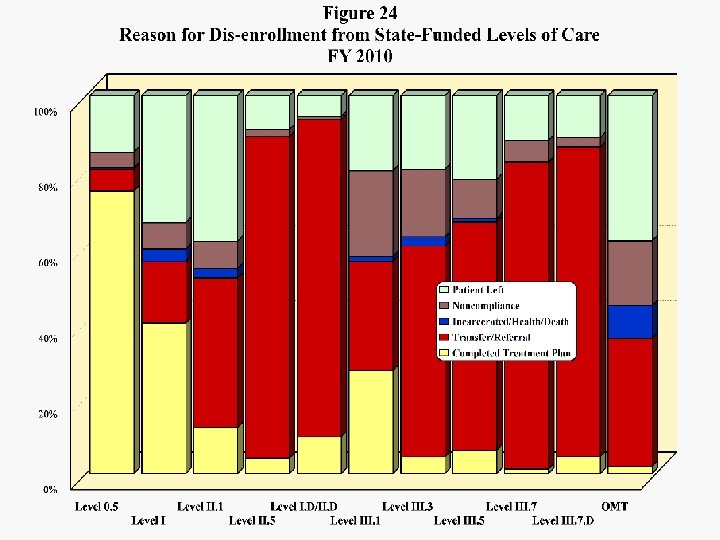
 FY 2010 reasons for dis-enrollment are broken out by levels of care in Figure 24. Successful completion without need for further treatment was most common in Levels 0. 5 (75 percent), I (40 percent) and III. 1 (27 percent). Transfer/Referrals made up over 80 percent of dis-enrollments from Levels II. 5, I. D/II. D, III. 7 and III. 7. D. The levels of care with the greatest percentages of dis-enrollments for non-compliance were III. 1 at 23 percent, III. 3 at 18 and OMT at 17 percent. Also in OMT, 38 percent of the dis-enrollments involved patients leaving treatment early, which was also fairly common in Level II. 1 (39 percent) and Level I (34 percent). OMT discharges tend to be weighted with many of the less successful cases, as those achieving stability remain in treatment for extended time periods.
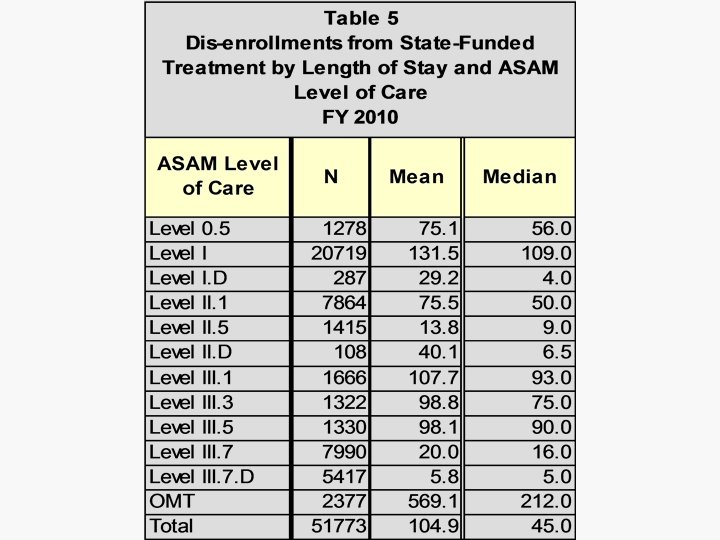
 Length of Stay Table 5 shows the mean and median lengths of stay by level of care for FY 2010. On average Level I treatment lasted over four months, although detention center patients stayed a mean 98 days. The residential levels III. 1, III. 3 and III. 5 lasted between 98 and 108 days on average. The average OMT discharged patient spent about 19 months in their programs. OMT patients active in treatment on the last day of FY 2010 averaged 4. 7 years in treatment, and 14 percent had been in treatment ten years or more. During FY 2010, 58 percent of Level I and 56 percent of Level III. 1 patients discharged stayed in those levels of care at least 90 days; Tables A 4 and A 5 in the appendix distribute 90 -day retention rates for FY 2010 dis-enrollments from Level I and Level III. 1 by Maryland subdivisions.
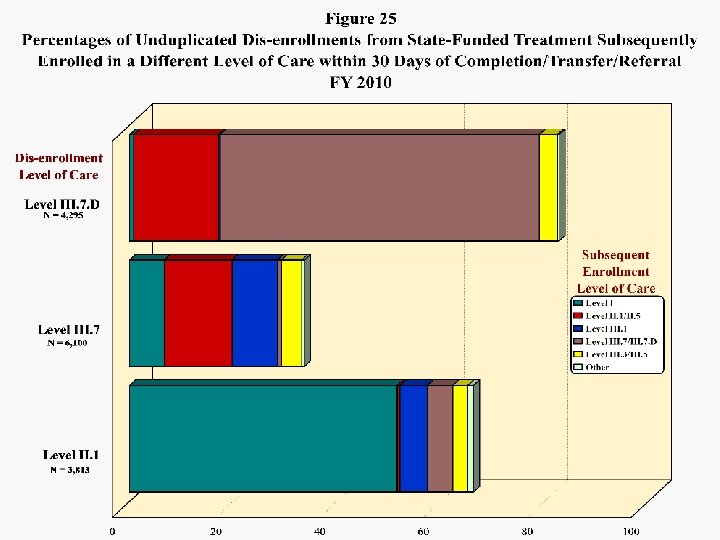
 Continuation in Treatment Figure 25 provides the percentages of unduplicated disenrollments from selected levels of care that entered different levels of care within thirty days. About 62 percent of those patients leaving short-term residential detox due to completion, transfer or referral during FY 2010 entered Level III. 7 within 30 days, and another 21 percent entered intensive outpatient or some other type of service. Dis-enrollments from III. 7 were most likely to enter intensive outpatient (16 percent) and III. 1 halfway house (9 percent). Over half of completers, transfers and referrals from intensive outpatient entered Level I within 30 days; about 15 percent entered another level of care. Appendix Tables A 6 and A 7 present the provider subdivision breakdown of Level II. 1 and III. 7 dis-enrollments by the percentages entering another level of care within 30 days.
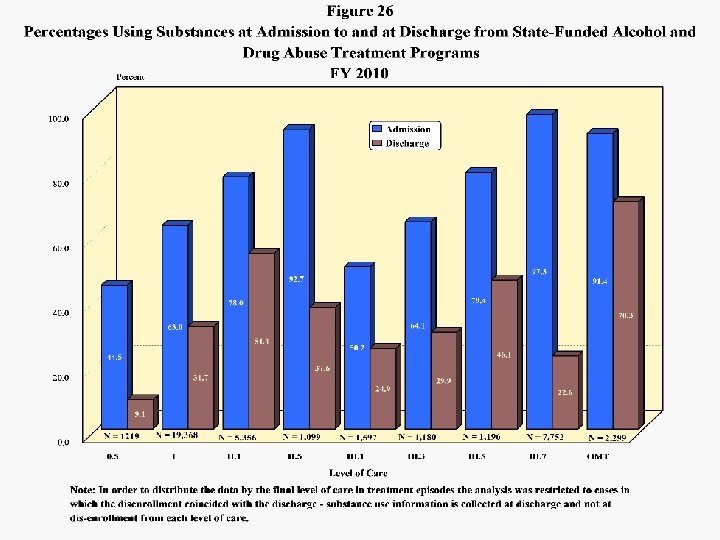
 Substance Use Outcome Figure 26 presents the percentages of discharged patients that were using substances at admission and the percentages using at discharge. The reduction in patients using substances was 50 percent among patients admitted to Level I, 30 percent in II. 1, 59 percent in II. 5, 50 percent in III. 1, 53 percent in Level III. 3, 42 percent in III. 5, 77 percent in III. 7 and 23 percent in OMT. Table A 1 in the appendix provides substance use performance measures by provider subdivision.
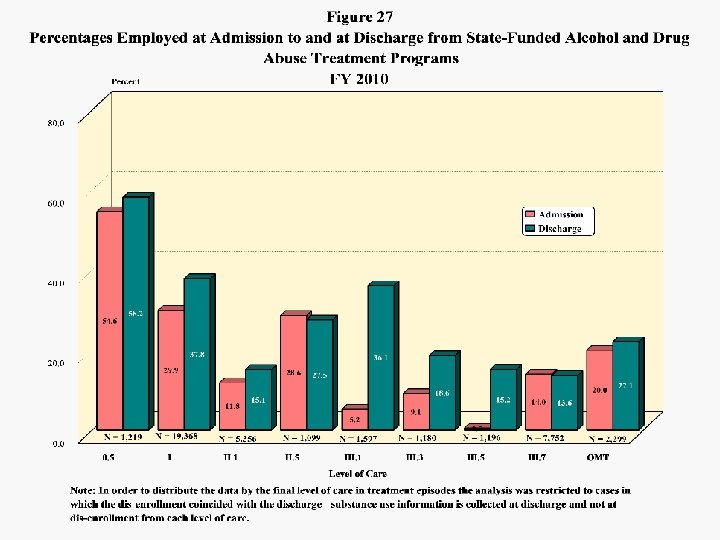
 Employment Outcome Employment at admission and employment at discharge are presented by level of care in Figure 27. The largest increases in percentages of patients employed occurred among patients admitted to the long-term residential levels, III. 1 (86 percent), III. 3 (52 percent) and III. 5 (97 percent). Employment increased 21 percent in Levels I and II. 1, and 10 percent in OMT. The percentage of patients employed declined slightly in levels II. 5 and III. 7, which involved short-term stays. Table A 2 in the appendix provides employment performance measures by provider subdivision.
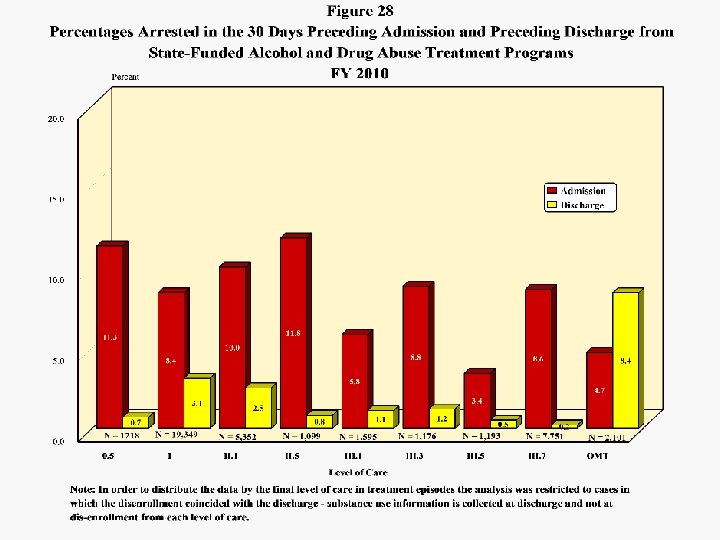
 Arrest Outcome • Comparisons of percentages arrested in the thirty days before admission and the percentages arrested in the thirty days before discharge are presented by level of care in Figure 28. Reductions in percentages arrested were substantial in every level except OMT, where the percentage at discharge was higher than at admission. This reflects the above-noted finding that OMT discharges tend to be biased toward treatment failure. • Appendix Table A 3 provides 30 -day arrest performance measures by provider subdivision.
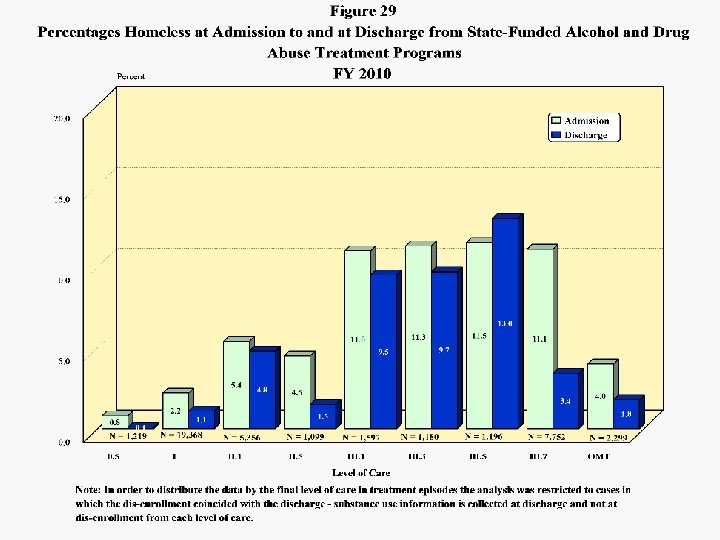
 Homelessness Outcome Figure 29 presents the percentages of discharged patient who were homeless at admission compared to the percentages homeless at discharge. About 11 percent of admissions to every residential level of care were homeless. Reductions in homelessness were achieved in every level of care except III. 5, where there were more patients homeless at discharge than at admission.
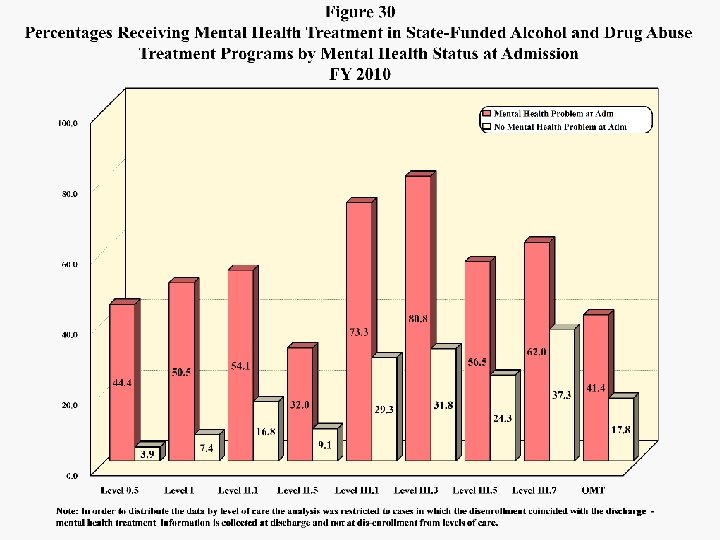
 Mental Health Treatment Figure 30 presents the percentages of discharges that received mental health treatment either within or outside the substance abuse program during the substance abuse treatment episode, distributed by the assessment of a mental health problem at admission and levels of care. Levels III. 3, III. 1 and III. 7 were the modalities most likely to involve mental health treatment. In III. 3, 32 percent of those considered to have no mental health problem and 81 percent of those with mental health problems at admission received mental health treatment. Least likely to involve mental health treatment for those believed to have problems at admission were Level II. 5 and OMT.
 A 1 Use of Substances at Admission and at Discharge from State-Funded Treatment Programs by Provider Location FY 2010 Subdivision Allegany Anne Arundel Baltimore City Baltimore County Calvert Caroline Carroll Cecil Charles Dorchester Frederick Garrett Harford Howard Kent Montgomery Prince George’s Queen Anne's St. Mary’s Somerset Talbot Washington Wicomico Worcester Statewide Total Discharges 1407 3827 10053 3599 1576 280 1087 487 1040 2213 1928 342 789 607 629 2194 2285 453 1365 302 446 1299 1398 772 73 40451 Use at Admission Use at Discharge Percentage Change N % 997 70. 9 221 15. 7 -77. 8 3032 79. 2 960 25. 1 -68. 3 8140 81. 0 5351 53. 2 -34. 3 2706 75. 2 1116 31. 0 -58. 8 1126 71. 4 537 34. 1 -52. 3 173 61. 8 88 31. 4 -49. 1 802 73. 8 358 32. 9 -55. 4 290 59. 5 96 19. 7 -66. 9 505 48. 6 179 17. 2 -64. 6 2023 91. 4 352 15. 9 -82. 6 1424 73. 9 303 15. 7 -78. 7 206 60. 2 100 29. 2 -51. 5 522 66. 2 298 37. 8 -42. 9 323 53. 2 160 26. 4 -50. 5 533 84. 7 197 31. 3 -63. 0 1652 75. 3 1016 46. 3 -38. 5 1589 69. 5 901 39. 4 -43. 3 305 67. 3 167 36. 9 -45. 2 851 62. 3 435 31. 9 -48. 9 217 71. 9 98 32. 5 -54. 8 271 60. 8 107 24. 0 -60. 5 543 41. 8 132 10. 2 -75. 7 1088 77. 8 592 42. 3 -45. 6 507 65. 7 284 36. 8 -44. 0 61 83. 6 10 13. 7 -83. 6 29886 73. 9 14058 34. 8 -53. 0 Note: Detoxification and non-primary patients are excluded.
 A 2 Employment at Admission and at Discharge from State-Funded Treatment Programs by Provider Location FY 2010 Subdivision Allegany Anne Arundel Baltimore City Baltimore County Calvert Caroline Carroll Cecil Charles Dorchester Frederick Garrett Harford Howard Kent Montgomery Prince George’s Queen Anne's St. Mary’s Somerset Talbot Washington Wicomico Worcester Statewide Total Discharges 798 3258 9104 2713 1576 280 734 487 1040 782 1120 342 789 607 266 1408 2029 453 949 302 446 1299 1137 772 73 32764 Employed at Admission N 170 1217 996 830 622 83 195 169 356 154 173 116 236 209 98 312 447 149 291 93 219 316 251 239 2 7943 % 21. 3 37. 4 10. 9 30. 6 39. 5 29. 6 26. 6 34. 7 34. 2 19. 7 15. 4 33. 9 29. 9 34. 4 36. 8 22. 2 22. 0 32. 9 30. 7 30. 8 49. 1 24. 3 22. 1 31. 0 2. 7 24. 2 Employed at Discharge N 216 1440 1639 1013 668 87 267 211 471 230 382 149 274 287 137 377 605 191 403 126 254 427 312 321 5 10492 % 27. 1 44. 2 18. 0 37. 3 42. 4 31. 1 36. 4 43. 3 45. 3 29. 4 34. 1 43. 6 34. 7 47. 3 51. 5 26. 8 29. 8 42. 2 42. 5 41. 7 57. 0 32. 9 27. 4 41. 6 6. 8 32. 0 Percentage Change 27. 1 18. 3 64. 6 22. 0 7. 4 4. 8 36. 9 24. 9 32. 3 49. 4 120. 8 28. 4 16. 1 37. 3 39. 8 20. 8 35. 3 28. 2 38. 5 35. 5 16. 0 35. 1 24. 3 34. 3 150. 0 32. 1 Note: Detoxification and short-term residential levels of care non-primary patients are excluded.
 A 3 Arrested in the 30 Days before Admission and before Discharge from State-Funded Treatment Programs by Provider Location FY 2010 Subdivision Discharges Arrested before Admission Arrested before Discharge N Allegany Anne Arundel Baltimore City Baltimore County Calvert Caroline Carroll Cecil Charles Dorchester Frederick Garrett Harford Howard Kent Montgomery Prince George’s Queen Anne's St. Mary’s Somerset Talbot Washington Wicomico Worcester Statewide Total 1407 3824 9935 3588 1576 280 1087 487 1040 2213 1926 342 787 607 629 2193 2280 453 1365 302 446 1299 1398 772 72 40308 % N % 205 346 689 141 248 11 99 39 50 207 206 41 75 47 41 264 164 38 78 20 81 87 131 62 0 3370 14. 6 9. 0 6. 9 3. 9 15. 7 3. 9 9. 1 8. 0 4. 8 9. 4 10. 7 12. 0 9. 5 7. 7 6. 5 12. 0 7. 2 8. 4 5. 7 6. 6 18. 2 6. 7 9. 4 8. 0 0. 0 8. 4 42 42 291 68 60 2 31 7 16 39 36 13 29 16 18 21 56 30 18 22 8 35 30 26 0 956 3. 0 1. 1 2. 9 1. 9 3. 8 0. 7 2. 9 1. 4 1. 5 1. 8 1. 9 3. 8 3. 7 2. 6 2. 9 1. 0 2. 5 6. 6 1. 3 7. 3 1. 8 2. 7 2. 1 3. 4 0. 0 2. 4 Percentage Change Note: Detoxification levels of care and non-primary patients are excluded. -79. 5 -87. 9 -57. 8 -51. 8 -75. 8 -81. 8 -68. 7 -82. 1 -68. 0 -81. 2 -82. 5 -68. 3 -61. 3 -66. 0 -56. 1 -92. 0 -65. 9 -21. 1 -76. 9 10. 0 -90. 1 -59. 8 -77. 1 -58. 1 ― -71. 6
 A 4 Level I Retention Rates for State-Funded Treatment Programs by Provider Location FY 2010 Subdivision Allegany Anne Arundel Baltimore City Baltimore County Calvert Caroline Carroll Cecil Charles Dorchester Frederick Garrett Harford Howard Kent Montgomery Prince George’s Queen Anne's St. Mary's Somerset Talbot Washington Wicomico Worcester Statewide Total Less than 90 Dis-enrollments Days 479 1235 4192 1794 1306 283 554 394 835 393 737 291 647 362 272 572 1543 648 713 292 371 1051 684 657 16 20321 Note: Non-primary patients are excluded. 173 558 1982 605 671 98 181 147 251 174 301 133 288 137 52 260 728 390 361 49 112 246 239 326 1 8463 90 Days or More 306 677 2210 1189 635 185 373 247 584 219 436 158 359 225 220 312 815 258 352 243 259 805 445 331 15 11858 Percentage Retained 90 Days or More 63. 9 54. 8 52. 7 66. 3 48. 6 65. 4 67. 3 62. 7 69. 9 55. 7 59. 2 54. 3 55. 5 62. 2 80. 9 54. 5 52. 8 39. 8 49. 4 83. 2 69. 8 76. 6 65. 1 50. 4 93. 8 58. 4
 A 5 Level III. 1 Retention Rates for State-Funded Treatment Programs by Provider Location FY 2010 Dis-enrollments Less than 90 Days or More Percentage Retained 90 Days or More Allegany 28 9 19 67. 9 Anne Arundel 155 78 77 49. 7 Baltimore City 741 290 451 60. 9 Baltimore Co. 16 12 4 25. 0 Carroll 57 29 28 49. 1 Cecil 18 13 5 27. 8 Frederick 109 63 46 42. 2 Howard 44 28 16 36. 4 Montgomery 72 27 45 62. 5 Prince George's 39 21 18 46. 2 St. Mary's 132 62 70 53. 0 Washington 116 37 79 68. 1 Wicomico 21 13 8 38. 1 Worcester 6 3 3 50. 0 1554 685 869 55. 9 Subdivision Total
 A 6 Subsequent Enrollment in Another Treatment Level within 30 Days of Completion/Transfer/Referral from Level II. 1 for State-Funded Treatment Programs FY 2010 Subsequent Enrollment Level of Care Unduplicated Level II. 1 Completion/ Transfer/ Referrals # % # % Allegany 144 33 22. 9 12 8. 3 45 31. 3 Anne Arundel Baltimore City Baltimore Co. Calvert Carroll Cecil Charles Dorchester Frederick Garrett Harford Howard Montgomery Prince George's St. Mary's Somerset Talbot Washington Wicomico Worcester Total 308 1686 156 124 78 5 93 170 200 5 1 51 163 225 135 20 8 71 95 78 3816 154 905 30 107 7 0 55 75 95 5 0 43 72 153 60 16 2 48 61 48 1969 50. 0 53. 7 19. 2 86. 3 9. 0 0. 0 59. 1 44. 1 47. 5 100. 0 84. 3 44. 2 68. 0 44. 4 80. 0 25. 0 67. 6 64. 2 61. 5 51. 6 37 272 23 4 15 0 18 29 33 0 1 3 21 23 33 1 0 17 4 14 560 12. 0 16. 1 14. 7 3. 2 19. 2 0. 0 19. 4 17. 1 16. 5 0. 0 100. 0 5. 9 12. 9 10. 2 24. 4 5. 0 0. 0 23. 9 4. 2 17. 9 14. 7 191 1177 53 111 22 0 73 104 128 5 1 46 93 17 2 65 65 62 2529 62. 0 69. 8 34. 0 89. 5 28. 2 0. 0 78. 5 61. 2 64. 0 100. 0 90. 2 57. 1 78. 2 68. 9 85. 0 25. 0 91. 5 68. 4 79. 5 66. 3 Subdivision Level I Other Total
 A 7 Subsequent Enrollment in Another Treatment Level within 30 Days of Completion/Transfer/Referral from Level III. 7. D for State-Funded Treatment Programs FY 2010 Subsequent Enrollment Level of Care Subdivision Unduplicated Level III. 7. D Completion/ Transfer/ Referrals Level III. 7 Level II. 1/II. 5 Other Total # % # % Anne Arundel 483 4 0. 8 447 92. 5 2 0. 4 453 93. 8 Baltimore City 853 372 43. 6 37 4. 3 141 16. 5 550 64. 5 Baltimore Co. 311 156 50. 2 8 2. 6 35 11. 3 199 64. 0 Carroll 201 192 95. 5 1 0. 5 2 1. 0 195 97. 0 Dorchester 119 1 0. 8 25 21. 0 2 1. 7 28 23. 5 Frederick 555 472 85. 0 20 3. 6 7 1. 3 499 89. 9 Kent 221 196 88. 7 1 0. 5 3 1. 4 200 90. 5 Montgomery 805 709 88. 1 10 1. 2 11 1. 4 730 90. 7 St. Mary's 133 119 89. 5 2 1. 5 1 0. 8 122 91. 7 Wicomico 316 98 31. 0 173 54. 7 4 1. 3 275 87. 0 Total 3997 2319 58. 0 724 18. 1 208 5. 2 3, 251 81. 3