

9255518345c8f22fc9df92111ea04ca7.ppt
- Количество слайдов: 19
 OUR VISION ……A Mid-Maryland where everyone has the opportunity to maximize his or her career potential and employers have access to the workforce resources they need to grow and prosper. CARROLL AND HOWARD COUNTIES October 21, 2015 Mid-Maryland Workforce Investment Board- Workforce Centers Howard County Office of Workforce Development 7161 Columbia Gateway Drive, Ste. D Columbia, MD 21046 PHONE: (410) 290 -2620 FAX: (410) 290 -2626 Email: owd@howardcountymd. gov Carroll County Business & Employment Resource Center 224 N. Center Street Westminster, MD 21157 Phone: 410. 386. 2820 Fax: 410. 876. 2977 Email: info@carrollworks. com Web: www. carrollworks. org Laurel Regional Workforce Center 312 Marshall Avenue, 6 th Floor Laurel, MD 20707 PHONE: (301) 362 -9708 ESPAÑOL: (301) 362 -9709
 AGENDA MEETING DATE: October 21, 2015 TIME: 9 AM-10: 30 AM Approx. LOCATION: Gary J. Arthur Community Center Located at the Glenwood Complex 2400 Route 97 Cooksville, MD 21723 PH: 410 -313 -4840 WDB CONTACT INFO: 410 -290 -2620 -PH 410 -290 -2626 -FX BOARD CHAIR Wallace Brown MID-MARYLAND WDB DIRECTOR Francine Trout I. Introductions II. Approval of Minutes III. Open Meeting Act Presentation IV. Regionalism V. Center Updates I. Conflict of Interest/Board Appointments
 Presenter: James Vannoy, Howard County Government
 Region Update
 Delineating Regions of Economic Activity & Regional Planning Source: DLLR
 Subcommittee Background ■Subcommittee of the LMI and Sector Strategies WIOA Work Group ■Group of 14 individuals with diverse backgrounds ranging from economics to planning ■Subcommittee is designed to: ➢ Determine appropriate data that can inform decision-making pertaining to delineating regions ➢ Develop proposed methodology for utilizing the specified data ➢ Listen to the ideas, insights, and concerns ➢ Collaborative effort to delineate regions using proposed methodology and associated map(s) 6
 Additional Background ■Governor must develop a policy for designation of a region prior to submission of the State Unified or Combined Plan (March 2016), in order to receive WIOA title I–B adult, dislocated worker, and youth allotments ■In consultation with the Local Boards and chief local elected officials in the local area(s) ■Regions must consist of: (1) One local area; (2) Two or more contiguous local areas in a single State; or (3) Two or more contiguous local areas in two or more States 7
 ■Consideration of the extent to which the local areas") Text from NPRM (Draft Regulations) ■Consideration of the extent to which the local areas in a proposed region: ➢ Share a single labor market ➢ Share a common economic development area ➢ Possess the Federal and non. Federal resources, including appropriate education and training institutions ➢ In addition may also consider : Population centers Commuting patterns Land ownership Industrial composition Location quotients- (measures a region’s industrial specialization relative to a larger geographic unit) ➢ Labor force conditions ➢ Geographic boundaries ➢ Additional factors as determined by the Secretary ➢ ➢ ➢ 8
Text from NPRM (Draft Regulations) ■Consideration of the extent to which the local areas in a proposed region: ➢ Share a single labor market ➢ Share a common economic development area ➢ Possess the Federal and non. Federal resources, including appropriate education and training institutions ➢ In addition may also consider : Population centers Commuting patterns Land ownership Industrial composition Location quotients- (measures a region’s industrial specialization relative to a larger geographic unit) ➢ Labor force conditions ➢ Geographic boundaries ➢ Additional factors as determined by the Secretary ➢ ➢ ➢ 8
 Resources-Commuting Patterns 12
 WIOA Regional Planning Area Designation Notice of Proposed Rulemaking: Pages 605 -607 ■§ 679. 510 What are the requirements for regional planning? ■(a) Local Boards and chief elected officials within an identified planning region (as defined in WIOA secs. 106(a)(2)(B)-(C) and § 679. 200 of this part) must: ■(1) Participate in a regional planning process that results in: (i) The preparation of a regional plan, as described in paragraph (a)(2) of this section and consistent with any guidance issued by the Department; (ii) The establishment of regional service strategies, including use of cooperative service delivery agreements; (iii) The development and implementation of sector initiatives for in-demand industry sectors or occupations for the planning region; (iv) The collection and analysis of regional labor market data (in conjunction with the State) which must include the local planning requirements at § 679. 560(a)(1)(i) and (ii); (v) The coordination of administrative cost arrangements, including the pooling of funds for administrative costs, as appropriate; (vi) The coordination of transportation and other supportive services as appropriate; (vii) The coordination of services with regional economic development services and providers; and (viii) The establishment of an agreement concerning how the planning region will collectively negotiate and reach agreement with the Governor on local levels of performance for, and report on, the performance accountability measures described in WIOA sec. 116(c) for local areas or the planning region. ■(2) Prepare, submit, and obtain (i)Includes a description (ii) Incorporates approval of a single regional plan that: of the activities described in paragraph (a)(1) of this section; and local plans for each of the local areas in the planning region, consistent with § 679. 540(a).
 Center Updates
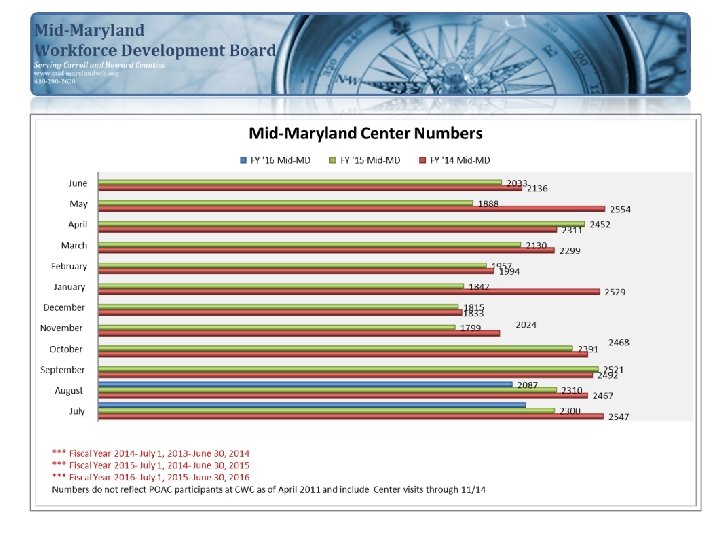
 Center Performance Updates Mid-Maryland Performance
 2015 Unemployment Rates AUG 4 JUL 5. 1 4. 3 5. 4 4. 3 JUN 4. 6 4. 5 MAY 4. 2 APR 4. 8 5. 3 FEB 5. 4 4 4 JAN 4. 7 5. 6 4. 8 5. 9 4. 3 2 3 Data available through August 2015 Carroll 4. 4 4. 0 MAR 1 Howard 4. 9 3. 7 0 Maryland 5. 6 4 5. 1 5 6
 WIA and Labor Exchange Title I Performance - Maryland Local Workforce Investment Areas - PY 2014 QTR 4 ROLLING 4 QUARTERS Performance Measure Adults Entered Employment Dislocated Workers Rate Labor Exchange Adults Retention Rate Dislocated Workers Labor Exchange Standard State Perform. Average Earnings BCI FR LS MG MM PG SM SQ US WM VO Standard Perf. 78. 6% 68. 4% 80. 0% 65. 9% 80. 2% 69. 0% 89. 2% 72. 2% 84. 1% 82. 3% 80. 2% 95. 5% 86. 8% 82% 87% 82. 2% 75. 3% 70. 1% 69. 9% 80. 6% 95. 5% 90. 2% 86. 4% 88. 3% 84. 1% 81. 1% 97. 0% 86. 0% 87% 55% 53. 2% 52. 9% 52. 5% 48. 4% 57. 2% 56. 9% 52. 4% 55. 7% 52. 8% 51. 2% 57. 6% 56. 7% 55. 0% 54. 6% 55% 89% 90. 8% 93. 9% 96. 8% 81. 5% 88. 2% 87. 5% 100. 0% 90. 6% 88. 1% 93. 9% 89. 9% 78. 1% 91. 7% 89% 91% 92. 2% 93. 0% 93. 7% 82. 3% 91. 2% 100. 0% 92. 9% 88. 5% 92. 9% 92. 4% 90. 9% 89. 7% 91% 82. 9% 84. 3% 83. 6% 79. 8% 86. 2% 80. 7% 84. 1% 85. 1% 82. 2% 82. 9% 82. 7% 82. 2% 81. 4% 86. 2% 81% $21, 879 $22, 620 $12, 316 $20, 002 $10, 048 $18, 156 $17, 997 $16, 081 $12, 819 $17, 309 $10, 252 $14, 938 $18, 807 $22, 919 $12, 764 $18, 331 $10, 961 $16, 797 $18, 544 $17, 322 $11, 314 $18, 093 $11, 786 $13, 964 $16, 500 $24, 784 $19, 747 $14, 203 $21, 975 $16, 181 $21, 081 $22, 157 $26, 040 $18, 808 $17, 839 $12, 421 $16, 126 $23, 638 $21, 469 $15, 595 $20, 278 $12, 347 $21, 802 $22, 482 $25, 438 $17, 949 $20, 131 $13, 129 $16, 587 $19, 500 $16, 500 $17, 289 Local Adjusted Average Earnings Standard DW Dislocated Workers BCO 82% Local Adjusted Average Earnings Standard Adults AA $19, 500 $21, 204 Local Adjusted Average Earnings Standard LX $15, 897 $15, 691 $11, 431 $17, 770 $10, 889 $17, 919 $20, 115 $17, 011 $16, 022 $15, 262 $12, 180 $11, 718 $15, 000 $15, 062 $16, 880 $14, 096 $11, 728 $17, 436 $10, 850 $18, 864 $20, 172 $16, 089 $15, 065 $14, 776 $11, 908 $11, 925 $21, 498 $15, 000 Youth Attainment of Degree or Certificate 76% 77. 6% 79. 6% 63. 0% 92. 1% 68. 2% 85. 5% 78. 8% 76. 7% 91. 8% 44. 8% 61. 7% 83. 3% 84. 4% 76% Youth Placement in Employment or Education 73% 78. 3% 69. 0% 79. 6% 76. 5% 94. 4% 74. 3% 89. 2% 73. 8% 86. 1% 68. 3% 98. 0% 94. 1% 63. 0% 73% Youth Literacy/Numeracy 70% 74. 1% 85. 7% 71. 9% 63. 6% 77. 8% 16. 7% 71. 4% 92. 9% 57. 1% 12. 0% 88. 2% 57. 1% 79. 2% 70% Labor Exchange Performance = Exceeded Standard = Meeting Standard (at least 80% of standard) = Failing Standard (Performed below 80% of standard) = No Participants in Measure
 Percent of Performance Standard ROLLING 4 QUARTERS State Standard Performance Measure AA BCO BCI FR LS MG MM PG SM SQ US WM Perf. Perf. 82% 95. 9% 83. 4% 97. 6% 80. 4% 97. 8% 84. 1% 108. 8% 88. 0% 102. 5% 100. 3% 97. 8% 116. 4% 105. 9% 87% 94. 4% 86. 6% 80. 3% 92. 6% 109. 7% 103. 6% 99. 3% 101. 5% 96. 6% 93. 2% 111. 5% 55% 96. 8% 96. 2% 95. 5% 88. 1% 104. 1% 103. 4% 95. 2% 101. 3% 95. 9% 93. 1% 104. 7% 103. 1% 100. 0% 89% 102. 0% 105. 5% 108. 8% 91. 6% 99. 1% 98. 3% 112. 4% 101. 8% 99. 0% 105. 5% 101. 0% 87. 8% 103. 0% 91% 101. 3% 102. 2% 103. 0% 90. 4% 100. 2% 109. 9% 102. 0% 97. 3% 102. 1% 101. 5% 99. 9% 98. 6% 81% 102. 3% 104. 0% 103. 3% 98. 5% 106. 4% 99. 6% 103. 9% 105. 0% 101. 5% 102. 4% 102. 1% 101. 4% 100. 5% $16, 500 104. 8% 86. 0% 101. 3% 103. 6% 91. 6% 109. 1% 92. 5% $19, 500 108. 7% 95. 4% 108. 7% 109. 8% 92. 3% 76. 3% 103. 4% 101. 5% $15, 000 100. 4% 106. 2% 89. 8% 102. 6% 98. 1% 99. 6% 105. 3% 100. 3% Youth Attainment of Degree or Certificate 76% 102. 1% 104. 7% 82. 9% 121. 2% Youth Placement in Employment or Education 73% 107. 3% 94. 6% 109. 1% Youth Literacy/Numeracy 70% 105. 9% 122. 4% 102. 8% Adults Entered Employment Rate Dislocated Workers LX Adults Retention Rate Dislocated Workers LX Adults * Average Earnings Dislocated Workers* LX * * Based on the locally adjusted standard. 103. 0% 107. 7% 98. 9% 88. 3% 104. 5% 115. 0% 97. 7% 95. 4% 112. 9% 105. 7% 102. 9% 94. 6% 94. 0% 96. 8% 97. 8% 89. 7% 112. 5% 103. 7% 100. 9% 120. 8% 59. 0% 81. 1% 109. 6% 111. 1% 104. 8% 129. 4% 101. 8% 122. 1% 101. 2% 118. 0% 93. 6% 134. 3% 128. 9% 86. 3% 90. 9% 111. 1% 23. 8% 17. 1% 126. 0% 113. 1% 102. 0% 132. 7% 81. 6% 93. 5% 101. 8%
 WIA and Labor Exchange Title I Performance - Maryland Local Workforce Investment Areas - PY 2014 QTR 4 ROLLING 4 QUARTERS Timeframe Performance Measure Adults 10/01/13 -9/30/14 Calculation Basis Local Workforce Investment Area AA State Perform. BCO BCI FR LS MG MM PG SM SQ US WM VO 153 51 194 21 66 1, 436 133 80 129 182 29 130 169 182 62 242 22 76 Numerator 1, 930 116 298 58 112 21 174 514 227 58 159 64 129 2, 349 154 425 83 139 22 193 595 257 69 196 66 150 Numerator 59, 474 4, 830 10, 219 6, 591 2, 248 3, 217 4, 854 3, 674 8, 269 3, 894 3, 589 2, 556 4, 722 811 111, 724 9, 126 19, 458 13, 607 3, 927 5, 658 9, 268 6, 595 15, 674 7, 603 6, 231 4, 508 8, 583 1, 486 Numerator 1, 354 108 152 119 157 35 142 155 111 46 205 25 99 1, 492 115 157 146 178 40 142 171 126 49 228 32 108 Numerator 1, 786 120 209 79 114 5 169 507 193 79 158 40 113 1, 937 129 223 96 125 5 169 546 218 85 171 44 126 Numerator 72, 377 6, 080 12, 387 6, 912 2, 963 3, 903 5, 979 4, 622 9, 539 4, 531 4, 817 2, 887 6, 451 1, 306 87, 352 7, 216 14, 809 8, 660 3, 439 4, 836 7, 106 5, 434 11, 605 5, 464 5, 826 3, 514 7, 928 1, 515 21, 645, 643 1, 824, 265 3, 369, 134 1, 506, 167 2, 877, 955 372, 657 1, 881, 232 2, 484, 947 1, 697, 554 395, 986 3, 600, 527 294, 644 1, 340, 575 1, 252 97 147 118 157 34 112 134 98 35 199 25 96 34, 731, 554 2, 694, 725 4, 036, 250 1, 216, 433 2, 311, 667 61, 733 3, 117, 627 10, 072, 134 4, 680, 550 1, 256, 401 3, 100, 201 525, 147 1, 658, 686 1, 638 114 188 78 114 5 143 448 184 70 154 40 100 Average 15, 062 16, 880 14, 096 11, 728 17, 436 10, 850 18, 864 20, 172 16, 089 15, 065 14, 776 11, 908 11, 925 21, 498 Numerator 682 39 75 140 15 53 67 46 67 26 37 25 92 879 49 119 152 22 62 85 60 73 58 60 30 109 Numerator 664 29 90 101 17 52 74 48 62 41 50 32 68 Denominator 4/01/13 -03/31/14 122 Denominator Adults 4/01/13 -03/31/14 116 Denominator Labor Exchange 4/01/13 -03/31/14 20 Denominator Dislocated Workers 146 Denominator Retention Rate 4/01/13 -03/31/14 85 Denominator Adults 10/01/13 -9/30/14 64 Denominator Labor Exchange 91 Denominator 10/01/13 -9/30/14 1, 129 Denominator Entered Dislocated Workers Employment Rate Numerator 848 42 113 132 18 70 83 65 72 60 51 34 108 Numerator 335 12 100 7 14 1 35 39 4 3 97 4 19 Denominator 452 14 139 11 18 6 49 42 7 25 110 7 24 Numerator Denominator Average Earnings Dislocated Workers 4/01/13 -03/31/14 Labor Exchange 4/01/13 -03/31/14 Youth Attainment of Degree or Certificate Youth Placement in Employment or Education Youth Literacy/Numeracy 10/01/13 -9/30/14 7/01/14 -6/30/15 Numerator
 Meeting Schedule Future Meeting Dates: Meeting Location: December 16, 2015 February 17, 2016 April 20, 2016 June 15, 2016 September 21, 2016 Gary J. Arthur Community Center Located at the Glenwood Complex 2400 Route 97 Cooksville, MD 21723 PH: 410 -313 -4840 Or visit: www. mid-marylandwib. org
 Next WDB Meeting December 16, 2015 Meeting Location: Gary J. Arthur Community Center Located at the Glenwood Complex 2400 Route 97 Cooksville, MD 21723 PH: 410 -313 -4840 **If you are unable to attend our regularly scheduled WIB meeting, we encourage you to send a representative in your place.