

Our first model.pptx
- Количество слайдов: 8
 Our first model: The circular-flow diagram It’s a visual model of the economy that shows how dollars flow through markets among households and firms.
 The circular flow diagram also illustrates the flow of money. Household spend money to buy the goods and services from the firms. In turn, the firms use the revenue from that transaction to buy the factors of production from the household , such as labour. The diagram includes taxes which are paid by both households and firms to the government and returned in the form of subsidies and transfer payments.
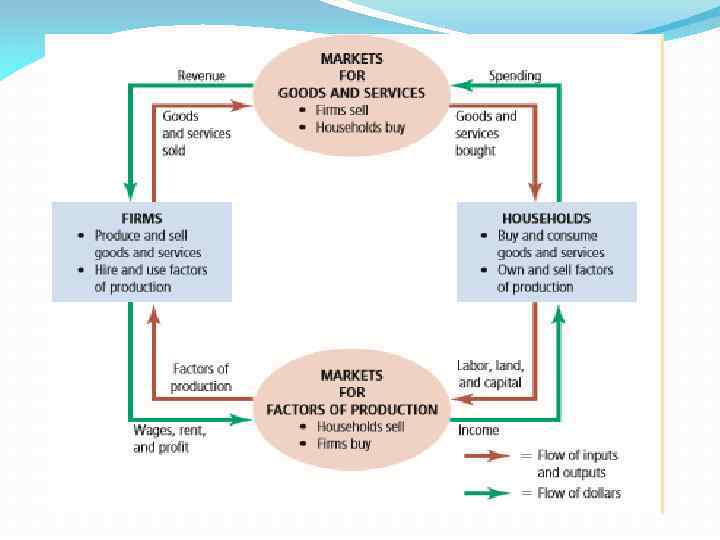
 Goods and services are bought and sold in two markets , the market for the factors of production (where households sell their time to firms to create the goods and services). The market for goods and services (where firms sell the goods and services to households).
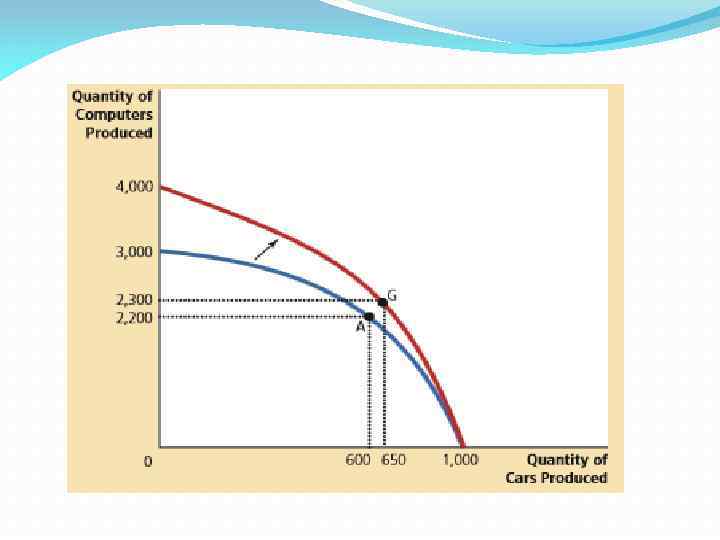
 Our second model: The production possibilities frontier It is a graph which shows the combinations of output that the economy can possibly produce given the available factors of production and the available production technology.
 Microeconomics The stydy of how households and firms make decisions and how they interact in markets.
 Macroeconomics The stydy of economwide phenomena, including inflation, unemployment , and economic growth.