61b457b7f4acb450dd4cd54820ed3300.ppt
- Количество слайдов: 47
 Oracle on Open. VMS Guy Peleg President Maklee Engineering guy. peleg@maklee. com
 Disclaimer Ich hatte eine großartige Präsentation geplant für heute. . Aber, leider die meisten von Ihnen haben bereits gesehen. Dies ist das zweite Mal, dass Herr Kriebel zwingt mich zu Schreiben Sie eine neue Präsentation. . . Was gibt's Freunde sind für ; -)
 Agenda Characteristics of an Oracle workload on Open. VMS • Open. VMS Optimization Techniques • General Optimization Techniques • Statspack / AWR reports •
 Who we are? Pledge to provide the highest level of technical consulting • No Results, no payment. – Our staff contains former members of Open. VMS engineering • Specialize in: • Performance Tuning (focusing on applications not only the – operating system) Oracle & Oracle tuning (Oracle Partner) – Platform migration (Alpha to Integrity) – Custom engineering –
 Who we are? Serving mission critical customers all over the world, • including the US, France, Germany, Switzerland, Israel, Belgium, Argentina, Italy & Sweden. Strong presence in Europe • Germany is our #1 country in Europe • Read some of our success stories: • http: //www. maklee. com/news. html
 Oracle on Open. VMS Oracle is “just another” user mode application • (Almost) O/S agnostic – Data files compatible between platforms – Does not rely on Open. VMS specific mechanism (locking, – ASTs, etc. ) Well tuned Oracle server would scale up nicely •
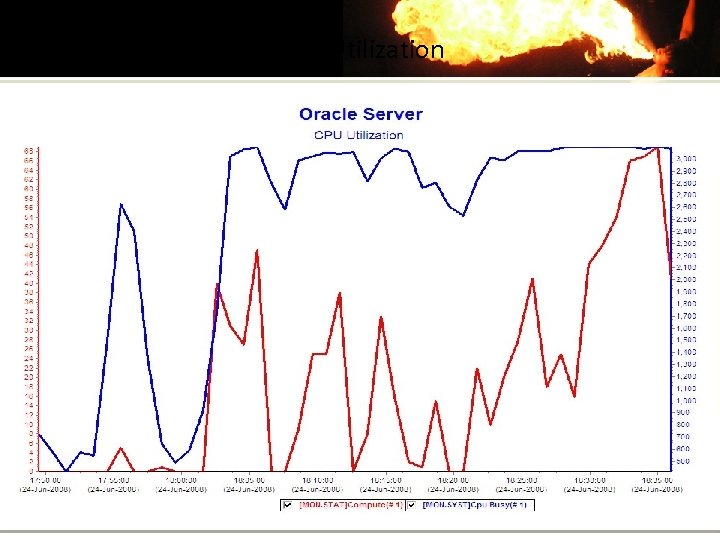
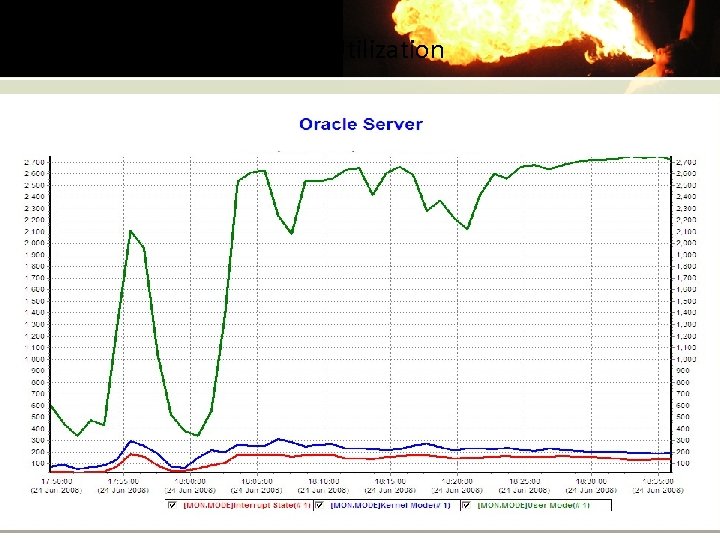
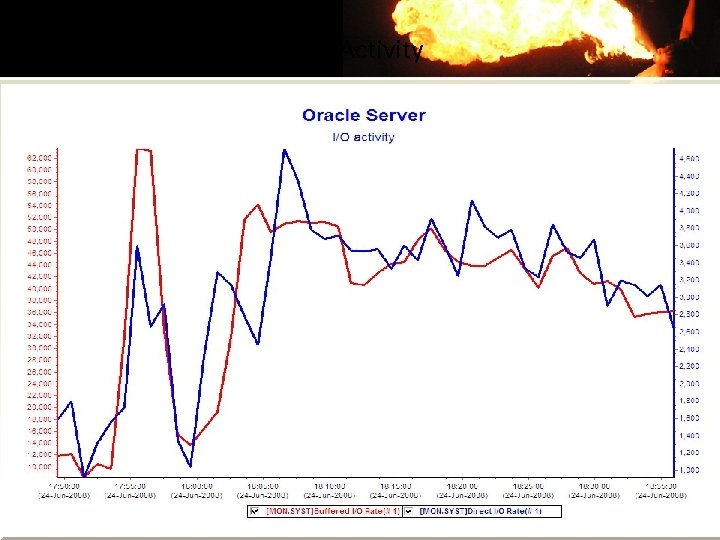
 Oracle on Open. VMS The following slides demonstrate the behavior of an Oracle • server from an Open. VMS perspective. Alpha Server 32 P GS 1280 7/1300 • Open. VMS V 8. 3 • 128 GB RAM – 40 GB SGA – Server is running at 100% utilization • End of day processing –
 CPU Utilization
 CPU Utilization
 I/O Activity
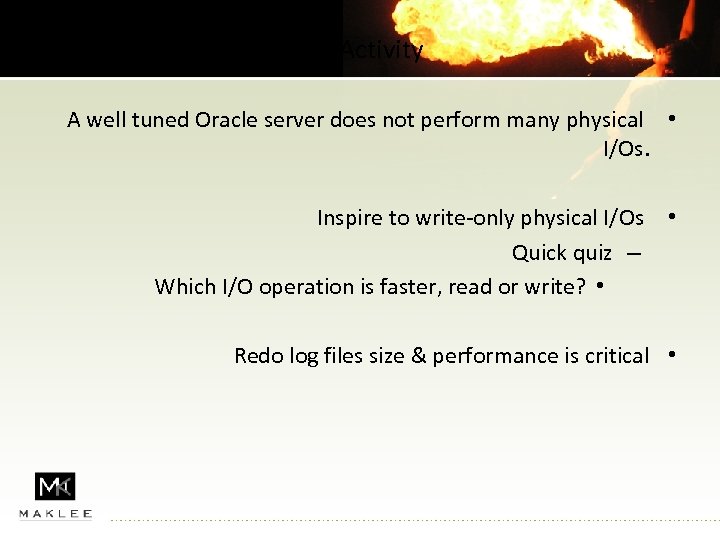 I/O Activity A well tuned Oracle server does not perform many physical • I/Os. Inspire to write-only physical I/Os Quick quiz – Which I/O operation is faster, read or write? • • Redo log files size & performance is critical •
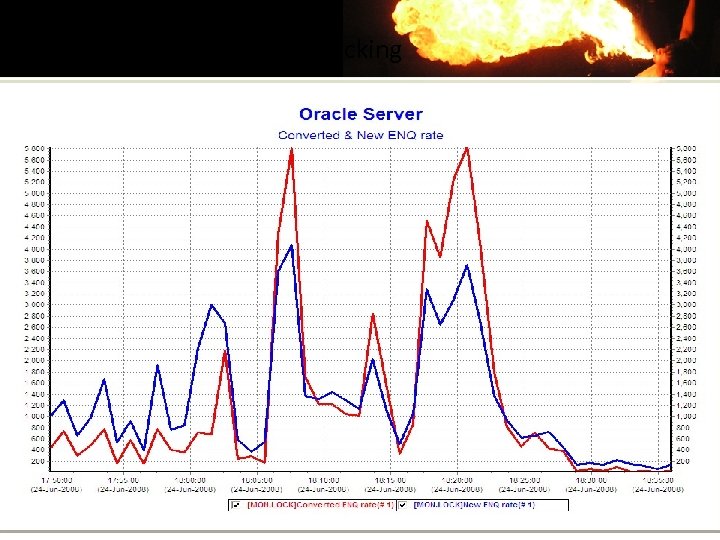 Locking
 Locking Oracle implements it’s own locking mechanism. • Locks are done in user mode. • Dedicated lock manager is not required for an Oracle server. •
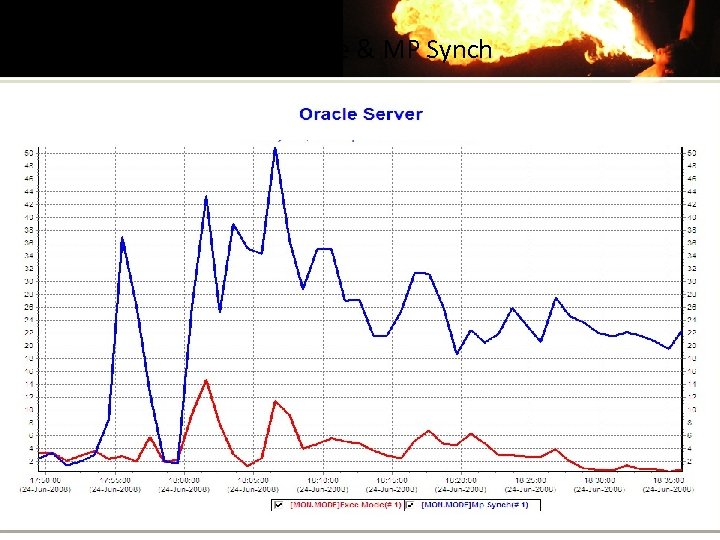 Exec mode & MP Synch
 MP Synch time is lost processor time • CPU A holding a spinlock while CPU B is forced to wait for – the same spinlock. MP Synch significantly impacts scaling • (in a bad way of course ; -) – Oracle implements spinlocks in user mode as latches. • A process spins or sleeps when a latch is not available – Typically a sign for: • Hot block in the database – One of the areas in the SGA is too small –
 Open. VMS Optimization Techniques
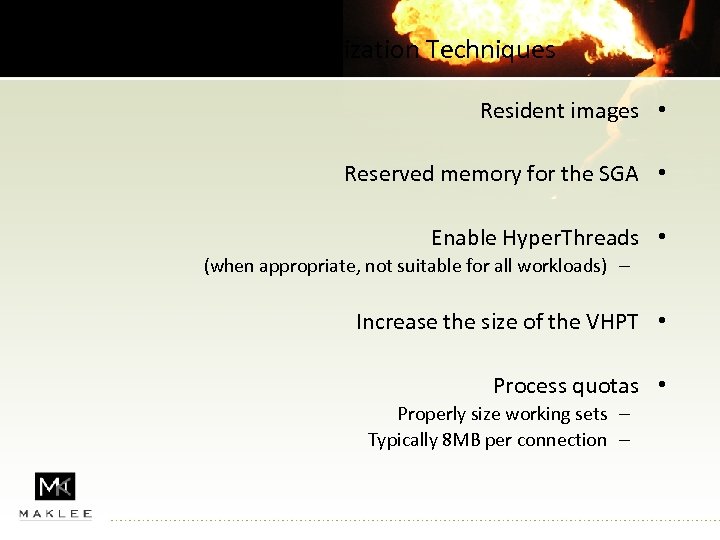 Open. VMS Optimization Techniques Resident images • Reserved memory for the SGA • Enable Hyper. Threads • (when appropriate, not suitable for all workloads) – Increase the size of the VHPT • Process quotas • Properly size working sets – Typically 8 MB per connection –
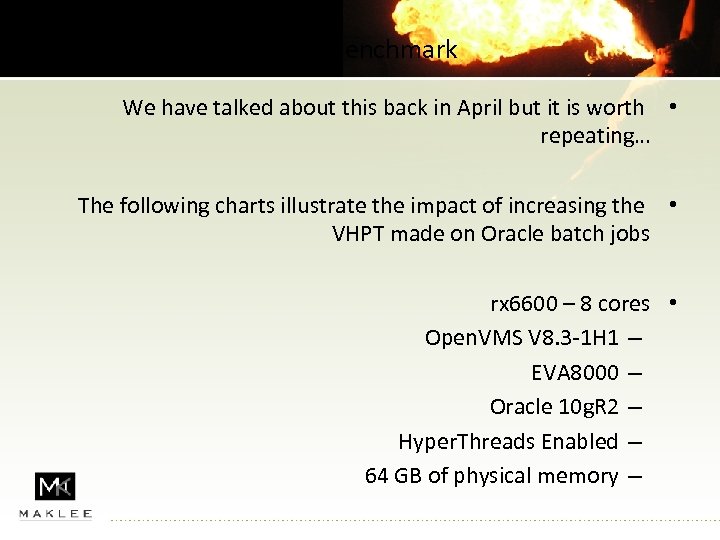 VHPT Benchmark We have talked about this back in April but it is worth • repeating… The following charts illustrate the impact of increasing the • VHPT made on Oracle batch jobs rx 6600 – 8 cores • Open. VMS V 8. 3 -1 H 1 – EVA 8000 – Oracle 10 g. R 2 – Hyper. Threads Enabled – 64 GB of physical memory –
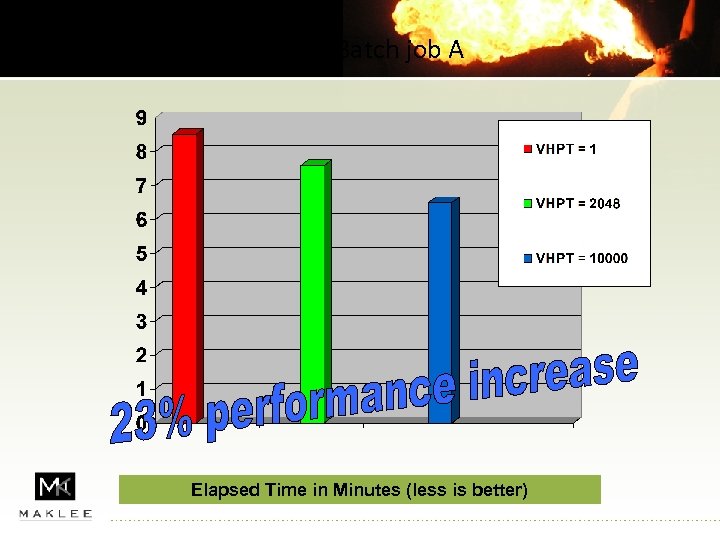 Oracle Batch job A Elapsed Time in Minutes (less is better)
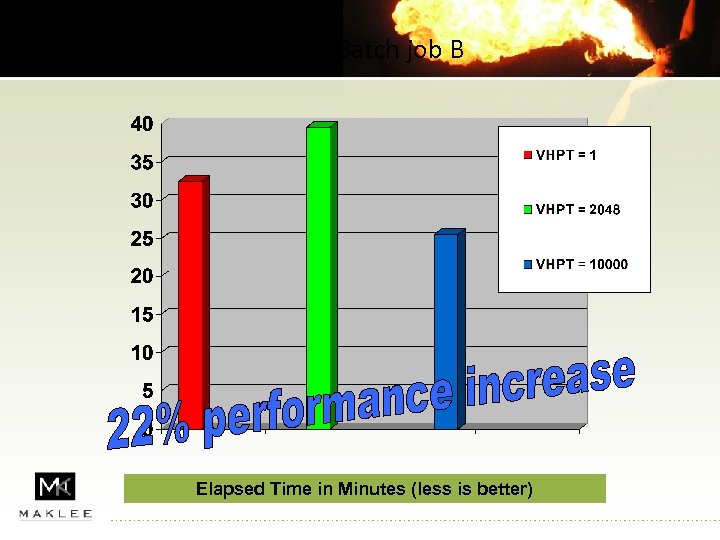 Oracle Batch job B Elapsed Time in Minutes (less is better)
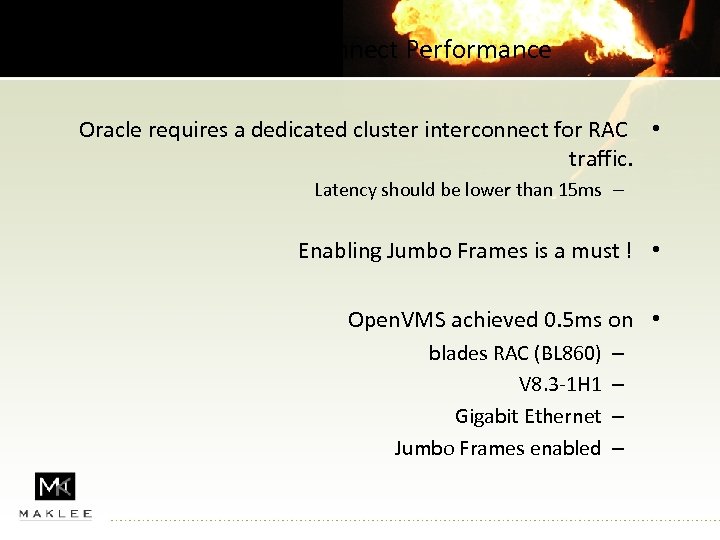 Cluster interconnect Performance Oracle requires a dedicated cluster interconnect for RAC • traffic. Latency should be lower than 15 ms – Enabling Jumbo Frames is a must ! • Open. VMS achieved 0. 5 ms on • blades RAC (BL 860) V 8. 3 -1 H 1 Gigabit Ethernet Jumbo Frames enabled – –
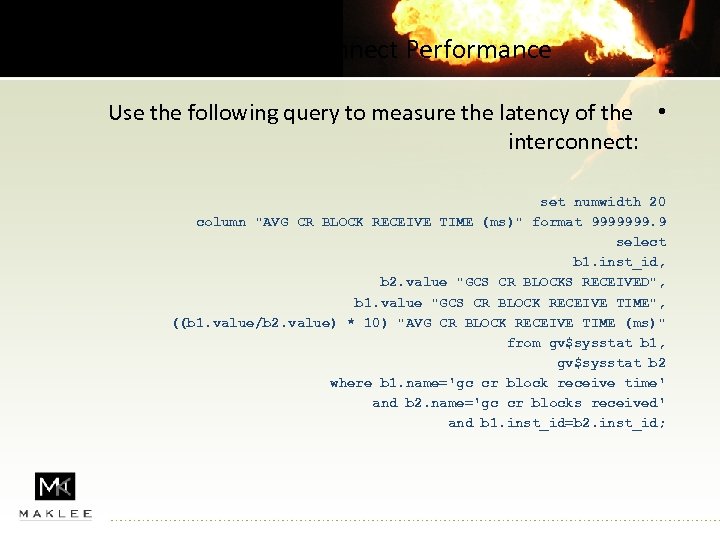 Cluster interconnect Performance Use the following query to measure the latency of the • interconnect: set numwidth 20 column "AVG CR BLOCK RECEIVE TIME (ms)" format 9999999. 9 select b 1. inst_id, b 2. value "GCS CR BLOCKS RECEIVED", b 1. value "GCS CR BLOCK RECEIVE TIME", ((b 1. value/b 2. value) * 10) "AVG CR BLOCK RECEIVE TIME (ms)" from gv$sysstat b 1, gv$sysstat b 2 where b 1. name='gc cr block receive time' and b 2. name='gc cr blocks received' and b 1. inst_id=b 2. inst_id;
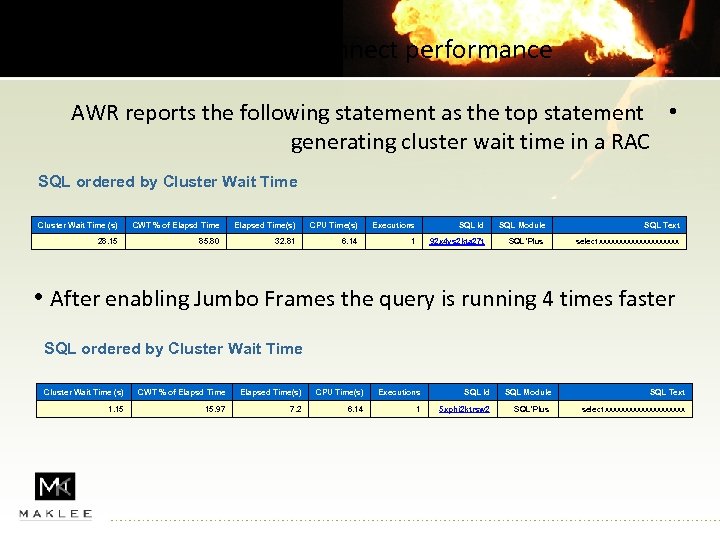 Cluster Interconnect performance AWR reports the following statement as the top statement • generating cluster wait time in a RAC SQL ordered by Cluster Wait Time (s) CWT % of Elapsd Time Elapsed Time(s) CPU Time(s) Executions SQL Id SQL Module SQL Text 28. 15 85. 80 32. 81 6. 14 1 92 x 4 ys 2 kta 27 t SQL*Plus select xxxxxxxxxx • After enabling Jumbo Frames the query is running 4 times faster SQL ordered by Cluster Wait Time (s) CWT % of Elapsd Time Elapsed Time(s) CPU Time(s) Executions SQL Id SQL Module SQL Text 1. 15 15. 97 7. 2 6. 14 1 5 xphi 2 ktrsw 2 SQL*Plus select xxxxxxxxxx
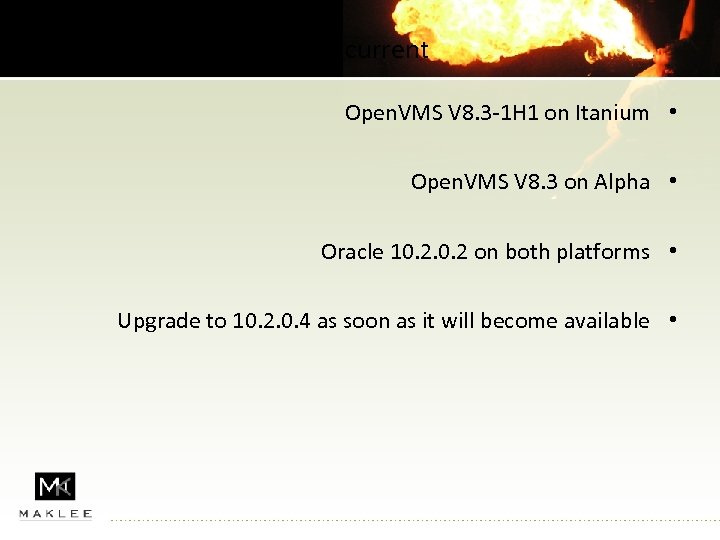 Stay current Open. VMS V 8. 3 -1 H 1 on Itanium • Open. VMS V 8. 3 on Alpha • Oracle 10. 2 on both platforms • Upgrade to 10. 2. 0. 4 as soon as it will become available •
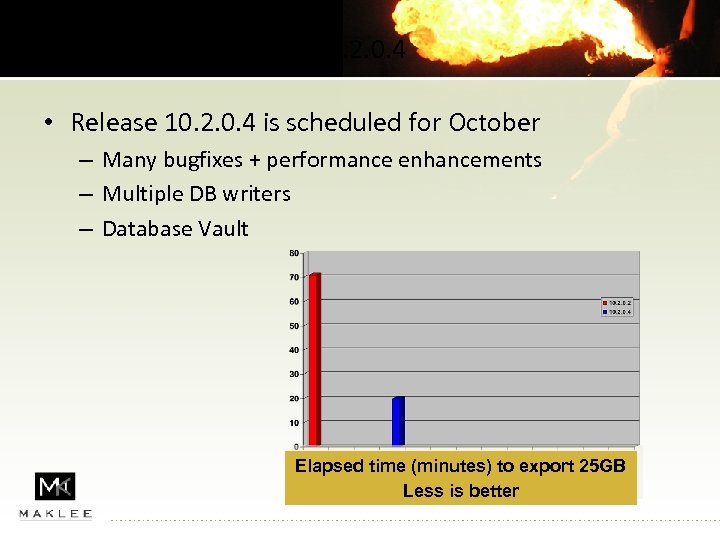 10. 2. 0. 4 • Release 10. 2. 0. 4 is scheduled for October – Many bugfixes + performance enhancements – Multiple DB writers – Database Vault Elapsed time (minutes) to export 25 GB Less is better
 General Optimization Techniques (not VMS specific)
 System statistics Gathering schema statistics is a must. System statistics is equally • important. Prior to 9 i the CBO based it’s calculations on the number of I/O requests that would needed to satisfy a query. • Starting with 9 i, CPU cost has been added to the algorithm Turned off by default unless system statistics available – • In Oracle 10 g system statistics collects more information about I/O New CPU speed – Seek time – Throughput – • Critical!! for certain optimization options in 10 g •
 System statistics is common for all the nodes in the RAC • Do not collect system statistics if you are using a non – symmetrical hardware configuration. The information will be used by the CBO to produce better • execution plans.
 Missing Indexes It is a common knowledge that indexes are key to good • database performance. With complex SQL statements, finding a missing index is not • always trivial. Oracle DBMS_ADVISOR (introduced with Oracle 10. 1) can • assist in finding a missing index. May be used with a representative workload or a single – statement. Recommends indexes or materialized views. –
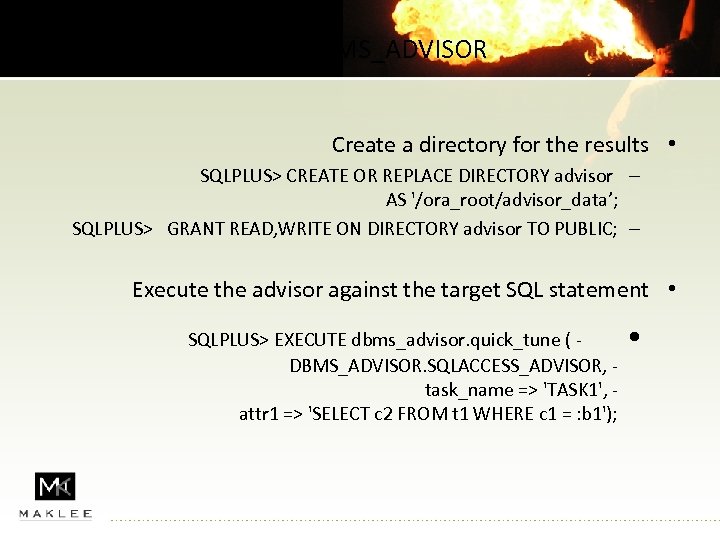 Using DBMS_ADVISOR Create a directory for the results • SQLPLUS> CREATE OR REPLACE DIRECTORY advisor – AS '/ora_root/advisor_data’; SQLPLUS> GRANT READ, WRITE ON DIRECTORY advisor TO PUBLIC; – Execute the advisor against the target SQL statement • SQLPLUS> EXECUTE dbms_advisor. quick_tune ( DBMS_ADVISOR. SQLACCESS_ADVISOR, task_name => 'TASK 1', attr 1 => 'SELECT c 2 FROM t 1 WHERE c 1 = : b 1'); •
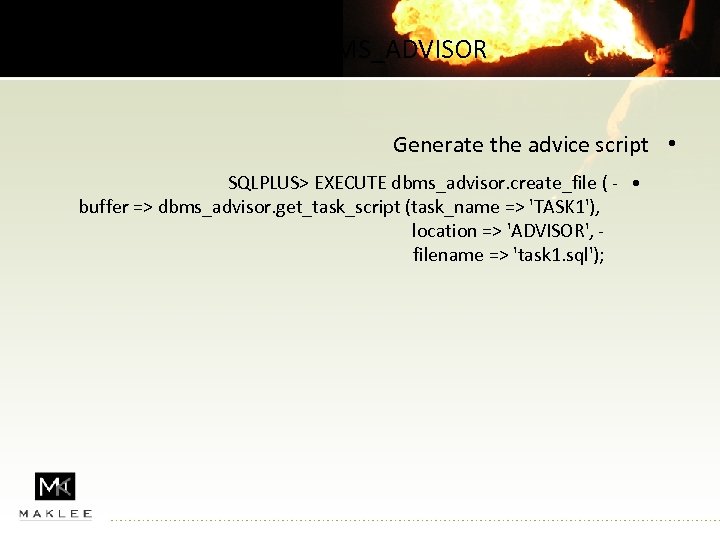 Using DBMS_ADVISOR Generate the advice script • SQLPLUS> EXECUTE dbms_advisor. create_file ( - • buffer => dbms_advisor. get_task_script (task_name => 'TASK 1'), location => 'ADVISOR', filename => 'task 1. sql');
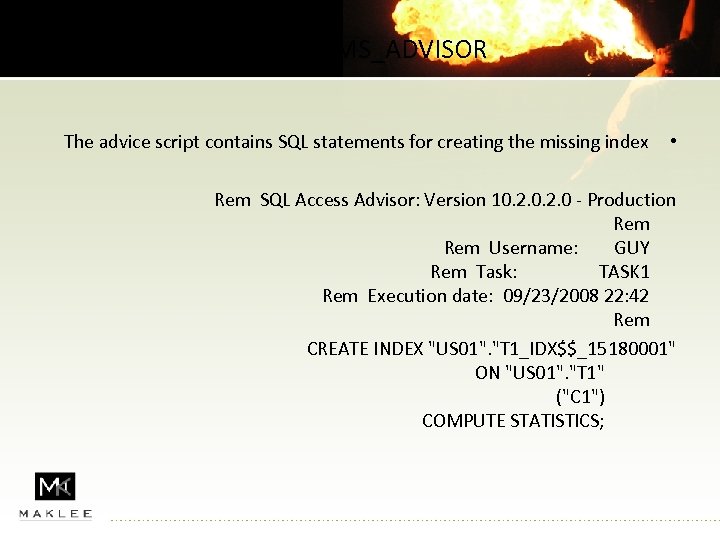 Using DBMS_ADVISOR The advice script contains SQL statements for creating the missing index • Rem SQL Access Advisor: Version 10. 2. 0 - Production Rem Username: GUY Rem Task: TASK 1 Rem Execution date: 09/23/2008 22: 42 Rem CREATE INDEX "US 01". "T 1_IDX$$_15180001" ON "US 01". "T 1" ("C 1") COMPUTE STATISTICS;
 Unused Indexes Oracle allows monitoring index usage • SQLPLUS> ALTER INDEX my. Idx MONITORING USAGE; – To check which indexes have been used by the optimizer: • SQLPLUS> SELECT index_name, used FROM v$object_usage; – To disable index monitoring • SQLPLUS> ALTER INDEX my. Idex NOMONITORING USAGE; –
 Statspack / AWR reports
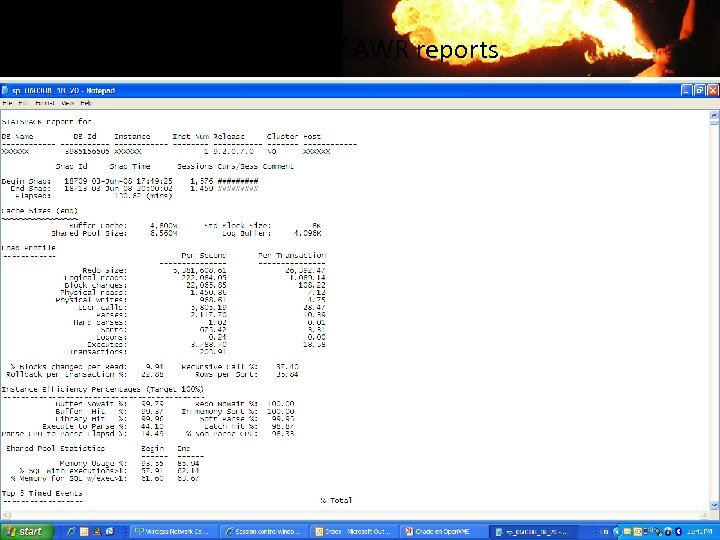
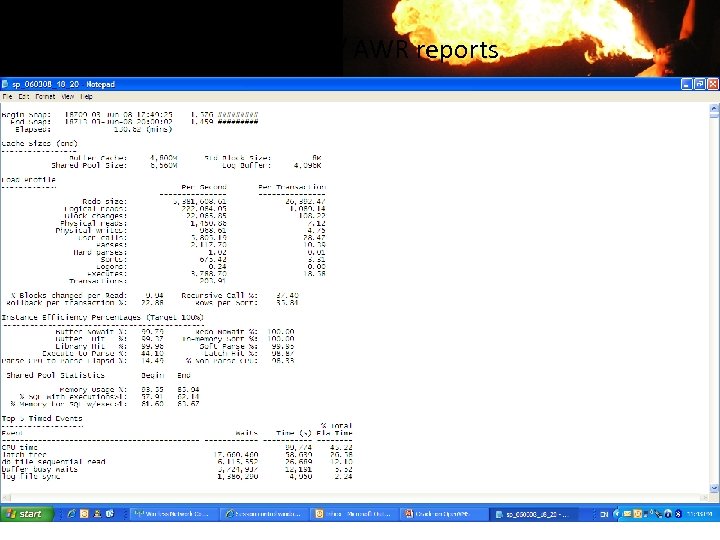
 Statspack / AWR reports The statspack and AWR reports provide all the information required for • performance analysis. Typical usage: • Create a snapshot Run workload Create another snapshot Generate a report – – The first 2 pages provide an overview of performance, highlighting areas • require attention Followed by detailed information on all aspects of the database – Look at the results at least once a month The database keeps changing – Small tables grow large… – •
 Statspack / AWR reports
 Statspack / AWR reports
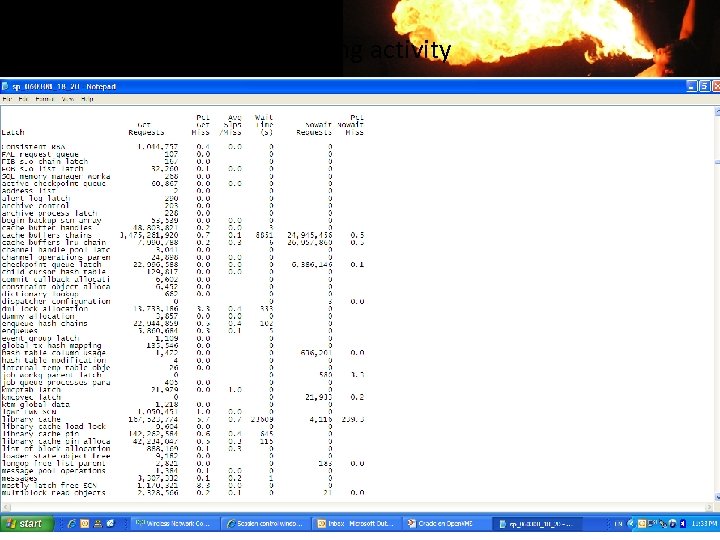
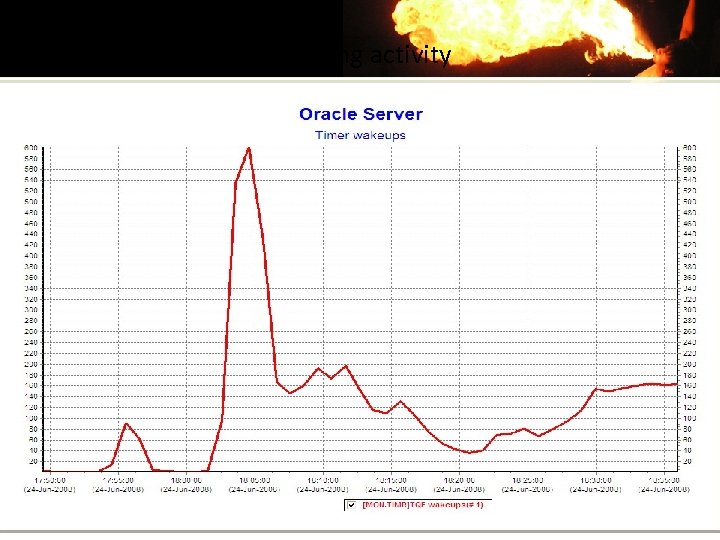
 Statspack / AWR reports A well tuned database should report high hit rates • In our example Latch hit rate was lower than 99% • The accumulated wait time for the latch free event was – 16 hours !! 58, 639 seconds – 0. 5 hour per CPU in a 2. 25 hours period –
 Latching activity
 Latching activity
 Statspack / AWR reports Once the latching problem has been resolved performance of • the database improved significantly Updates are 10 times ! faster – Overall performance improved 5 times –
 Long Connect Time Watch out for long connect time to the database • Monitor CPU utilization of the BEQ listener • Utilization > 60% consider adding more BEQ listeners – Possible solutions for long connection time: • Add BEQ listeners – Add listeners – Properly size the Flash recovery area –
 Automatic Memory Management of the SGA is a new feature • shipping with Oracle 10 g Oracle attempts to manage available SGA memory to meet • the application’s requirements Maklee recommends disabling automatic memory • management Oracle may fail to respond to a sudden change in the workload – No good deed goes unpunished…. guarantee enough memory to all – areas of the SGA To disable automatic memory management: – SGA_MAXSIZE = X • SGA_TARGET = 0 •
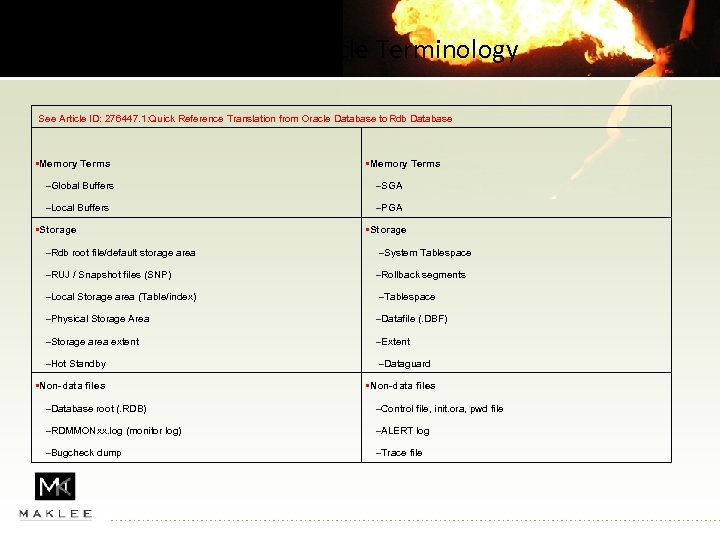 RDB Vs. Oracle Terminology See Article ID: 276447. 1: Quick Reference Translation from Oracle Database to Rdb Database • Memory Terms –Global Buffers –SGA –Local Buffers –PGA • Storage –Rdb root file/default storage area –System Tablespace –RUJ / Snapshot files (SNP) –Rollback segments –Local Storage area (Table/index) –Tablespace –Physical Storage Area –Datafile (. DBF) –Storage area extent –Extent –Hot Standby –Dataguard • Non-data files –Database root (. RDB) –Control file, init. ora, pwd file –RDMMONxx. log (monitor log) –ALERT log –Bugcheck dump –Trace file
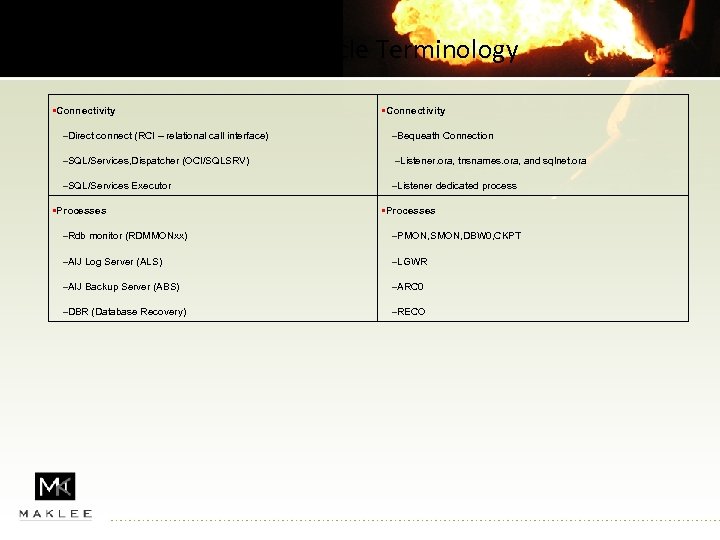 RDB Vs. Oracle Terminology • Connectivity –Direct connect (RCI – relational call interface) –Bequeath Connection –SQL/Services, Dispatcher (OCI/SQLSRV) –Listener. ora, tnsnames. ora, and sqlnet. ora –SQL/Services Executor –Listener dedicated process • Processes –Rdb monitor (RDMMONxx) –PMON, SMON, DBW 0, CKPT –AIJ Log Server (ALS) –LGWR –AIJ Backup Server (ABS) –ARC 0 –DBR (Database Recovery) –RECO
 Adabas Maklee acknowledge that there are other database solutions • available on Open. VMS. Starting November 2008 Maklee would offer wide range of • services, for Software AG Adabas, focusing on performance tuning. Maklee continues to expand it’s offering in response to • customer needs.
 Questions? See us at www. maklee. com for: • Oracle Tuning • DBA services • Oracle RAC installations …. . Bis bald


