7a5c524312ca3b70c00ce53bcbb5764a.ppt
- Количество слайдов: 22
 Oracle Grid Computing: Trending for Capacity Planning Ashish Rege SEI Session # S 307772
 What DBA’s, SYS admin’s need • Database Administrators, Sys Administrators are called on everyday to make decisions on capacity planning. – Which database has trended high for CPU, Memory, I/O etc. over the last year, month, week, day versus other databases on the same server? – Do these trends have some unique cyclical patterns based on year, month, week, day for different applications? – Do we see new functionality, additional users, increased concurrency with time? – Do we have the capacity to add one or more database to existing servers? – Where do we re-allocate databases at the next opportunity and where do we see capacity? – Do we need to buy new servers and factor this into next year’s budget?
 Approach and Toolset • Top down and Bottom up approach & edge at the this sideways too. . • SA-DBA-Middleware cross functional analysis • Toolset that can help trend CPU/Memory/Elapsed Time – OS extended stats – OEM repository DB/Host performance metrics – Oracle Services stats – App-DB-Integration-elapsed time/time-out metrics – Apache Logs fact-dimensional model – Batch Job-stream runtime metrics – Business measures e. g. positions, txn counts, tax lots, fees etc • Fill in the gaps with data points to construct a complete picture
 Requirements summary Database administrators and sys administrators need consolidated data points to provide holistic "Capacity Trend Analysis" from an intraday to multiyear via a web interface for the databases and their host servers from CPU, Memory, I/O, wait bottlenecks, throughput, and efficiencies perspective. • Stack up trends for different database per server on the same graph to enable side-by-side comparison and a better awareness of percentage usage by database/application and its alignment with the business cycle. • Help trend uptick or downward spiral of business measures and find correlation of those with database and server statistics to model what if analysis • end-to-end trending for • UI response times • Batch jobs • Processed Business measures
 Now to the details • OEM grid captures at a 15 minutes interval, write PERL scripts to transfer this to a trending utility that graphs those on the web with reporting • At the grain of intraday to multiyear for performance counters like consumption of CPU, memory, I/O, throughput, efficiency, wait stats etc. for the different databases. • Capture metadata into flat files (1) Details per database (2) Comparative numbers across different databases on the same or different servers (3) Supplement the above with details from stats pack
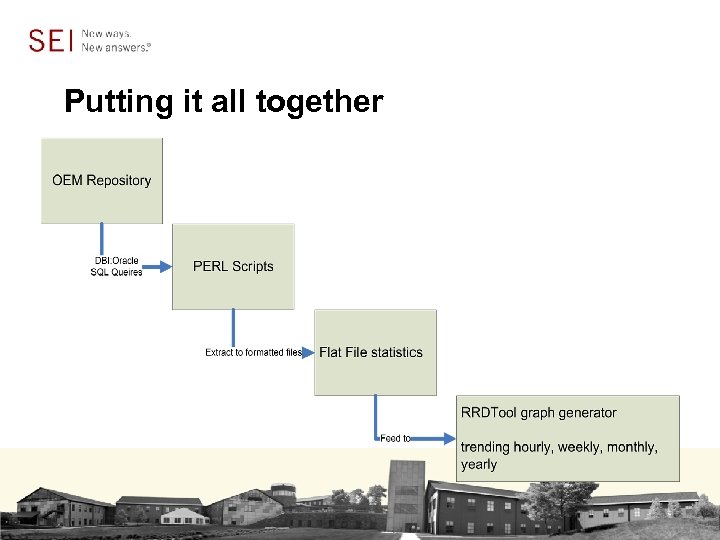 Putting it all together
 Reporting Classifications. . • Thus the reporting that comes out of the OEM is at two levels – Database statistics – Host statistics, this also includes side-by-side Oracle comparison for databases on that host • The above statistics have associated flat files extracted out of OEM to feed this data to Orca/RRDTool to generate the graphs/trend. • Have found these graphs very useful in 1. Re-alignment decisions 2. Budget discussions around shared infrastructure resources for different cost centers
 Orca/RRD Tool is a tool useful for plotting arbitrary data from text files onto a directory on a Web server. It has the following features: 1. files into the same or different plots. Creates an HTML tree of HTML and image (PNG or GIF) files. 2. Creates an index of URL links listing all available targets. 3. Creates an index of URL links listing all different plot types. 4. No separate CGI set up required. 5. Can be run under cron or it can sleep itself waiting for file updates based on when the file was last updated. 6. Configuration file based. 7. Reads arbitrarily formatted text or binary data files. 8. Watches data files for updates and sleeps between reads. 9. Finds new files at specified times. 10. Remembers the last modification times for files so they do not have to be reread continuously. 11. Allows arbitrary grouping of data from different sources 12. Allows arbitrary math performed on data read from one file
 Orca architecture • Out of the box Orca statistics for the host – On clients, orcallator. se, a component of the SE Toolkit, collects data every 5 minutes and dumps the data in orca's home directory. Orcallator. se has a startup script in /etc/init. d. This data is dumped in /home/orca/data/
 Out of box OS performance Statistics • The Orca server app which simply checks a directory tree (/apps/orcallator) every five minutes and graphs any new data which has appeared there • Then, as orca on the orca server does an ssh to the new client ssh
 OEM Custom statistics • Extract performance data out of OEM repository into flat files, via a custom script running at an hourly frequency. These flat files are dropped into the same directory which Orca checks and processes data from to plot graphs (/apps/orcallator). Thus data is generated right off the Orca server connecting remotely to the OEM repository. • Thus any data can be plotted including business measures. It is that simple • Using the DBI: : Oracle library to query the OEM GRID Repository; joining tables like sysman. MGMT_TARGETS, sysman. MGMT_METRICS, sysman. MGMT_METRICS _1 HOUR extracting data out of into files. • A timestamp is written to a snapfile that tracks time intervals already queried and reported on; the next run is based on querying the sysman repository table to find snapshots with rollup_timestamp greater than the last run e. g. 2008 -11 -12_19: 00
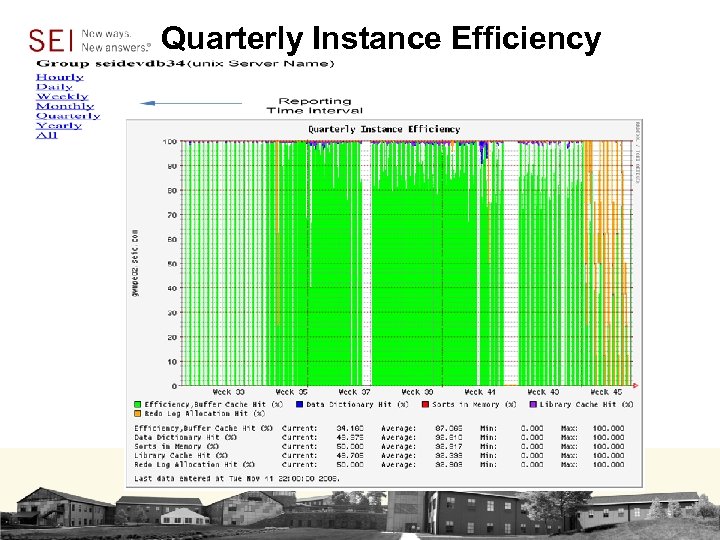 Quarterly Instance Efficiency
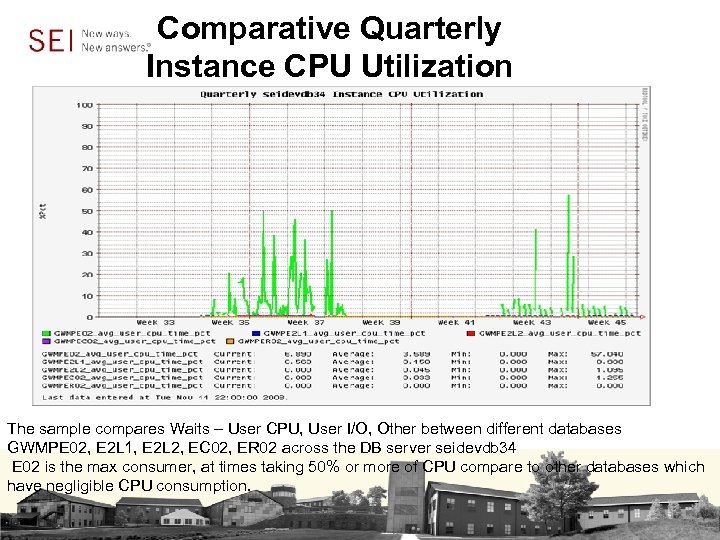 Comparative Quarterly Instance CPU Utilization The sample compares Waits – User CPU, User I/O, Other between different databases GWMPE 02, E 2 L 1, E 2 L 2, EC 02, ER 02 across the DB server seidevdb 34 E 02 is the max consumer, at times taking 50% or more of CPU compare to other databases which have negligible CPU consumption.
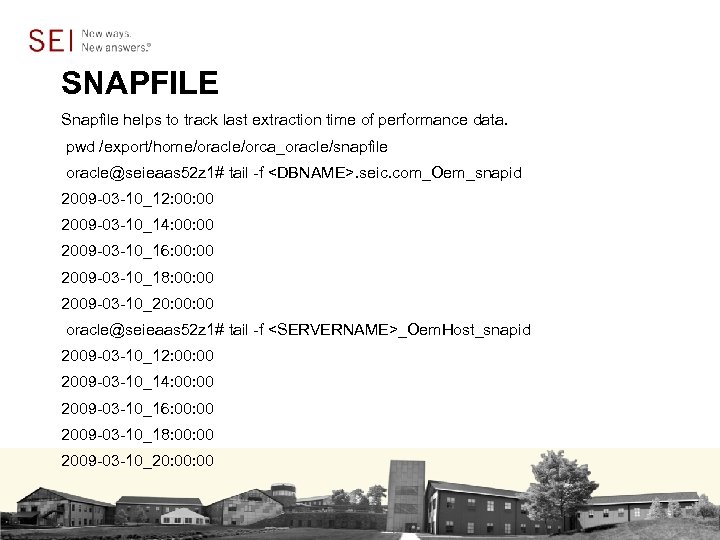 SNAPFILE Snapfile helps to track last extraction time of performance data. pwd /export/home/oracle/orca_oracle/snapfile oracle@seieaas 52 z 1# tail -f
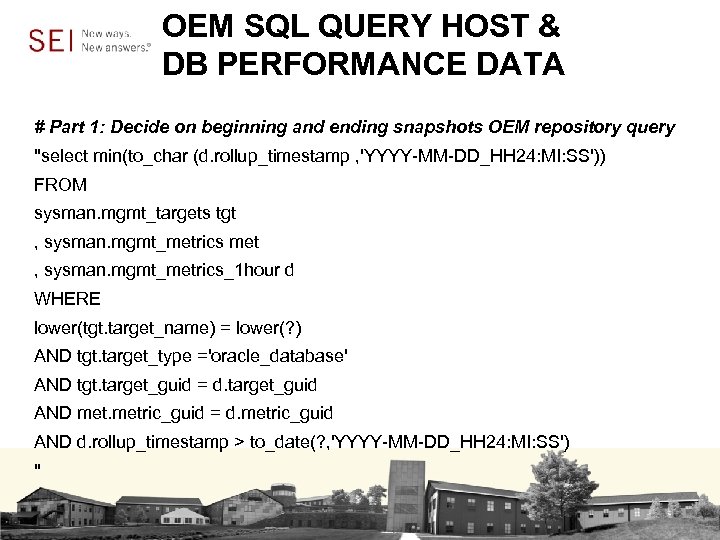 OEM SQL QUERY HOST & DB PERFORMANCE DATA # Part 1: Decide on beginning and ending snapshots OEM repository query "select min(to_char (d. rollup_timestamp , 'YYYY-MM-DD_HH 24: MI: SS')) FROM sysman. mgmt_targets tgt , sysman. mgmt_metrics met , sysman. mgmt_metrics_1 hour d WHERE lower(tgt. target_name) = lower(? ) AND tgt. target_type ='oracle_database' AND tgt. target_guid = d. target_guid AND metric_guid = d. metric_guid AND d. rollup_timestamp > to_date(? , 'YYYY-MM-DD_HH 24: MI: SS') "
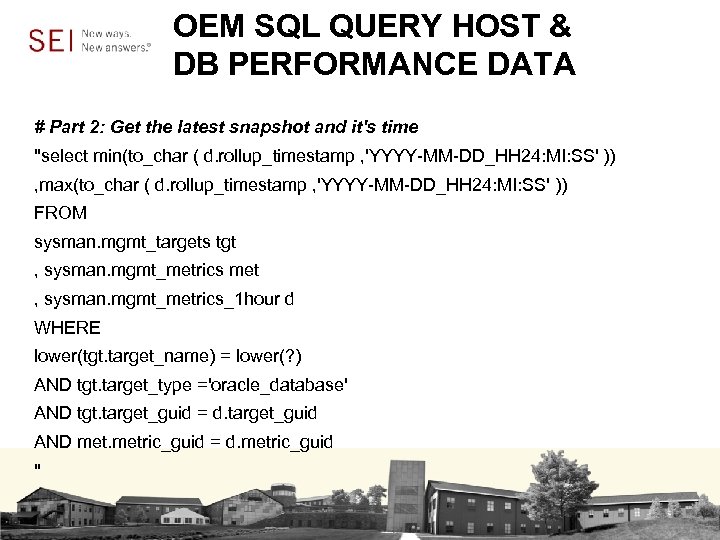 OEM SQL QUERY HOST & DB PERFORMANCE DATA # Part 2: Get the latest snapshot and it's time "select min(to_char ( d. rollup_timestamp , 'YYYY-MM-DD_HH 24: MI: SS' )) , max(to_char ( d. rollup_timestamp , 'YYYY-MM-DD_HH 24: MI: SS' )) FROM sysman. mgmt_targets tgt , sysman. mgmt_metrics met , sysman. mgmt_metrics_1 hour d WHERE lower(tgt. target_name) = lower(? ) AND tgt. target_type ='oracle_database' AND tgt. target_guid = d. target_guid AND metric_guid = d. metric_guid "
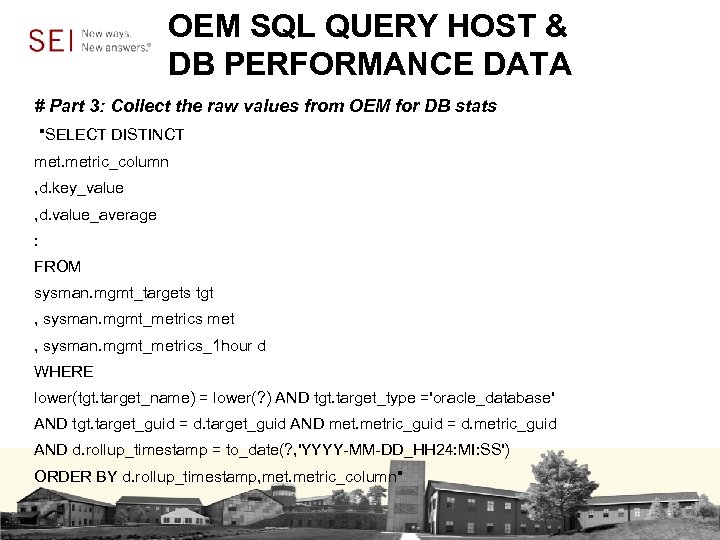 OEM SQL QUERY HOST & DB PERFORMANCE DATA # Part 3: Collect the raw values from OEM for DB stats "SELECT DISTINCT metric_column , d. key_value , d. value_average : FROM sysman. mgmt_targets tgt , sysman. mgmt_metrics met , sysman. mgmt_metrics_1 hour d WHERE lower(tgt. target_name) = lower(? ) AND tgt. target_type ='oracle_database' AND tgt. target_guid = d. target_guid AND metric_guid = d. metric_guid AND d. rollup_timestamp = to_date(? , 'YYYY-MM-DD_HH 24: MI: SS') ORDER BY d. rollup_timestamp, metric_column"
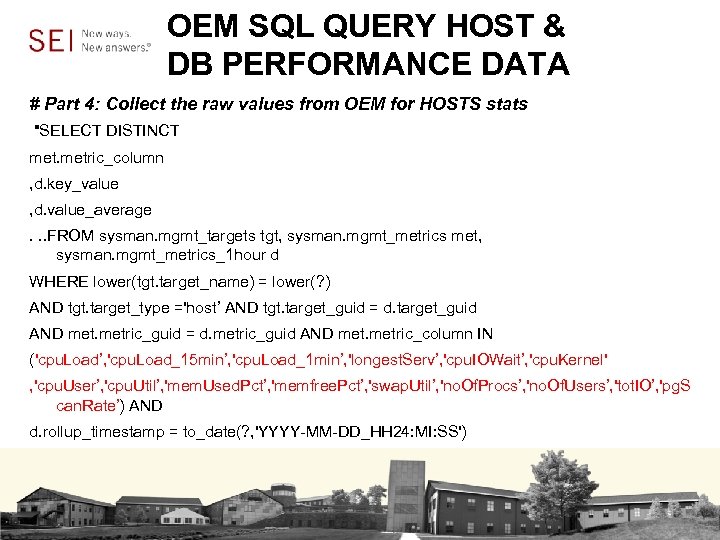 OEM SQL QUERY HOST & DB PERFORMANCE DATA # Part 4: Collect the raw values from OEM for HOSTS stats "SELECT DISTINCT metric_column , d. key_value , d. value_average. . . FROM sysman. mgmt_targets tgt, sysman. mgmt_metrics met, sysman. mgmt_metrics_1 hour d WHERE lower(tgt. target_name) = lower(? ) AND tgt. target_type ='host’ AND tgt. target_guid = d. target_guid AND metric_guid = d. metric_guid AND metric_column IN ('cpu. Load’, 'cpu. Load_15 min’, 'cpu. Load_1 min’, 'longest. Serv’, 'cpu. IOWait’, 'cpu. Kernel' , 'cpu. User’, 'cpu. Util’, 'mem. Used. Pct’, 'memfree. Pct’, 'swap. Util’, 'no. Of. Procs’, 'no. Of. Users’, 'tot. IO’, 'pg. S can. Rate’) AND d. rollup_timestamp = to_date(? , 'YYYY-MM-DD_HH 24: MI: SS')
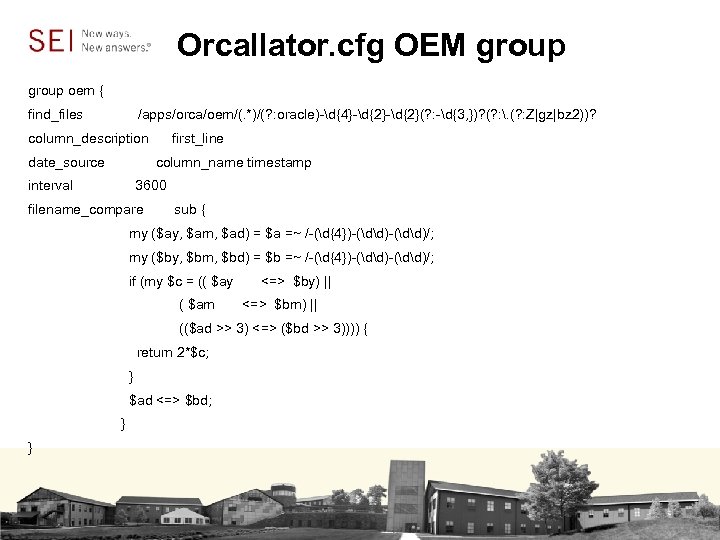 Orcallator. cfg OEM group oem { find_files /apps/orca/oem/(. *)/(? : oracle)-d{4}-d{2}(? : -d{3, })? (? : . (? : Z|gz|bz 2))? column_description first_line date_source column_name timestamp interval 3600 filename_compare sub { my ($ay, $am, $ad) = $a =~ /-(d{4})-(dd)/; my ($by, $bm, $bd) = $b =~ /-(d{4})-(dd)/; if (my $c = (( $ay <=> $by) || ( $am <=> $bm) || (($ad >> 3) <=> ($bd >> 3)))) { return 2*$c; } $ad <=> $bd; } }
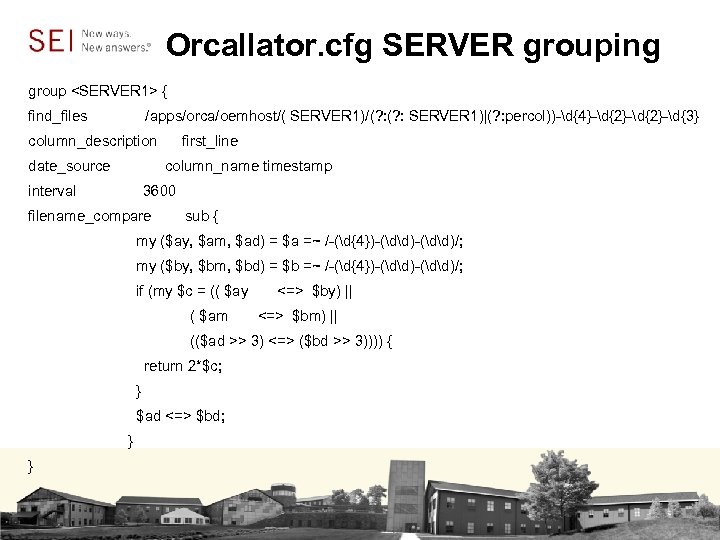 Orcallator. cfg SERVER grouping group
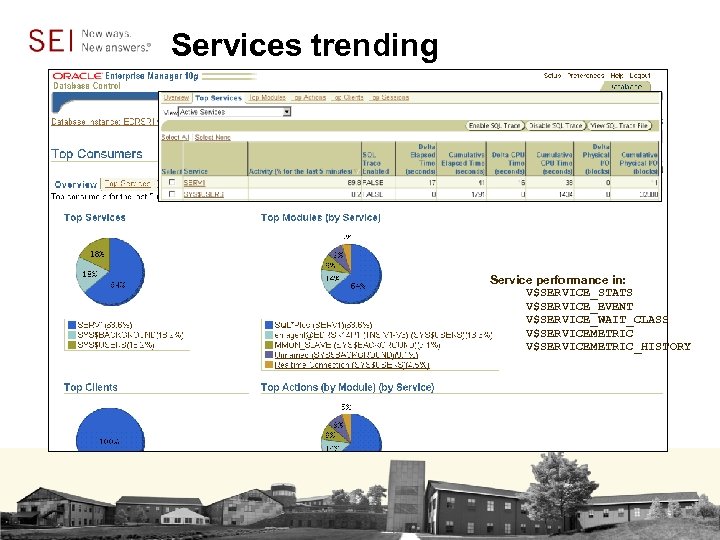 Services trending Service performance in: V$SERVICE_STATS V$SERVICE_EVENT V$SERVICE_WAIT_CLASS V$SERVICEMETRIC_HISTORY
 Items Learned in this Session • Database administrators and sys administrators need consolidated data points to provide holistic "Capacity analysis" for the databases and their host servers from CPU, Memory, I/O, wait bottlenecks, throughput, and efficiencies perspective. • This presentation outlined a methodology that helps with "Capacity Trend Analysis" from an intraday to multiyear via a web interface; the key theme here is the ability to stack up trends for different databases per server on the same graph to enable side-by-side comparison and a better awareness of percentage usage by database/application and its alignment with the business cycle.


