937383eb77040c3405ef2fd7a9cb4643.ppt
- Количество слайдов: 180

Oracle and Essbase Building a Data Warehouse © Copyright 2006 www. bravesoft. com 1 - 1

Agenda • • Oracle’s Fusion Essbase OLAP, ROLAP, run laps Dimensional Modeling The Integration Console Metadata Creating a Cube Hierarchies © Copyright 2006 • OLAP Metaoutline • Dense and Sparse • Creating the Essbase Application • The Administrative Console • OBIEE Integration • What is OBIEE? • An OBIEE Dashboard www. bravesoft. com 1 - 2

Oracle’s Fusion • Oracle has acquired a number of companies • A link between acquired technologies often creates synergies • This is especially true in the Business Intelligence (BI) space • Oracle’s Fusion is approach to middleware that creates the links and synergies • Example: Essbase now includes the Integration Console – A full GUI development Environment – Data from Relational Sources to OLAP © Copyright 2006 www. bravesoft. com 1 - 3

Relational and OLAP • The Relational Model is very powerful way to abstract and solve business problems – Objects in the world of business: invoices, orders and so forth can be captured using relational tables – The business object could be understood as a table, and the business rules as the relationship – Very powerful in supporting transactions and single entries: Online Transaction Processing (OLTP) – Reporting, however, had it’s problems • Executives want to analyze summaries • The enterprise view © Copyright 2006 www. bravesoft. com 1 - 4

OLAP • Online Analytical Processing – New approach to thinking • What are the ways we want to slice and dice (dimensions) • What the measures that are important to the business (facts) • Also can use the subject based approach to analysis • This talk is based on the dimensional modeling approach – Use transaction or operational data and create a data warehouse © Copyright 2006 www. bravesoft. com 1 - 5

Definition According to Wikipedia A data warehouse is a repository of an organization's electronically stored data. Data warehouses are designed to facilitate reporting and analysis [1] 1. Inmon, W. H. Tech Topic: What is a Data Warehouse? Prism Solutions. Volume 1. 1995 © Copyright 2006 www. bravesoft. com 1 - 6

Two Leaders Bill Inmon is universally recognized as the "father of the data warehouse. " He has over 26 years of database technology management experience and data warehouse design expertise, and has published 36 books and more than 350 articles in major computer journals. His books have been translated into nine languages. He is known globally for his seminars on developing data warehouses and has been a keynote speaker for every major computing association. Before founding Pine Cone Systems, Bill was a co-founder of Prism Solutions, Inc. Ralph Kimball was co-inventor of the Xerox Star workstation, the first commercial product to use mice, icons, and windows. He was vice president of applications at Metaphor Computer Systems, and founder and CEO of Red Brick Systems. He has a Ph. D. from Stanford in electrical engineering, specializing in man-machine systems. Ralph is a leading proponent of the dimensional approach to designing large data warehouses. He currently teaches data warehousing design skills to IT groups, and helps selected clients with specific data warehouse designs. Ralph is a columnist for Intelligent Enterprise magazine and has a relationship with Sagent Technology, Inc. , a data warehouse tool vendor. His book "The Data Warehouse Toolkit" is widely recognized as the seminal work on the subject. © Copyright 2006 www. bravesoft. com 1 - 7

Kimball’s Definition A data warehouse is "a copy of transaction data specifically structured for query and analysis". © Copyright 2006 www. bravesoft. com 1 - 8

Kimball’s Rules • The data warehouse must make an organization’s information easily accessible • The data warehouse must present the organization’s information consistently • The data warehouse must be adaptive and resilient to change • The data warehouse must be a secure bastion that protects our information • The data warehouse must serve as a foundation for improved decision making • The business community must accept the data warehouse if it is to be deemed successful © Copyright 2006 www. bravesoft. com 1 - 9

Differences? • Kimball and Inmon are very close in their definitions of a data warehouse and the functions it provides. So how do they differ? – Inmon believes a data warehouse should be based on a relational database using 3 NF. – Kimball designs a data warehouse with intentional de-normalization with ease of use for the business person as a key criteria © Copyright 2006 www. bravesoft. com 1 - 10

Kimball’s Four Step Method 1. Identify the business process 2. Identify the grain 3. Choose dimensions 4. Identify numeric facts © Copyright 2006 www. bravesoft. com 1 - 11

Identify the Business Process • Natural business process • Supported by a data gathering activity • NOT a department or division – it is a process – – – Multiple departments may contribute to a process Forces use of consistent vocabulary and labels Departmental approach results in duplicate data flows in a single process • “Economical” Data Usage © Copyright 2006 www. bravesoft. com 1 - 12

Identify the Grain • This is the level of detail that will be associated measurements in the model • This is an extremely important step • Will impact the selection of dimensions • You may find in analysis for steps 3 and 4 that the original selection was wrong. Don’t hesitate to go back to step 2 and start over as soon as you find the problem. ples? Exam © Copyright 2006 www. bravesoft. com 1 - 13

Identify the Grain ples! Exam © Copyright 2006 www. bravesoft. com 1 - 14

Dimension Tables • Dimensions are the “by” words in business intelligence – Count Customers by Region – Order Sales by Product – Shipments by Quarter • They are the entry point for business intelligence • They are textual – Words and terms business users understand • They are discrete • Often represent hierarchies • Typically highly de-normalized © Copyright 2006 www. bravesoft. com 1 - 15

Dimensions • Nearly every BI application includes some type of time or date dimension – Include attributes in the date dimension for all units of time measurements – Don’t break time into separate measures, month dimension, day dimension, etc. • Always include a dimension total attribute • Don’t be afraid to include all of the attributes of a dimension – 50 attributes is not uncommon – Think about the drill down • Use surrogate keys for dimension – Smart keys are never smart enough – Natural Keys change • Resist “Snowflaking” • Be careful of too many dimensions, use dimension attributes in a denormalized fashion © Copyright 2006 www. bravesoft. com 1 - 16

Fs P Fact Tables Fs P K K A row in a fact table corresponds to a measurement • – A measurement is a row in a fact table – All measurements must have the same grain • The most useful facts are numeric and additive • Generally, we do not enter zeros when something has not happened • Three types are – Transaction – Periodic Snapshot – Accumulating Snapshot Fs P K • Percentages and ratios are non-additive Fs P K – Store the numerator and denominator – Remember to calculate the ratio of the sums, not the sum of the ratio © Copyright 2006 www. bravesoft. com 1 - 17

Star Schema • The result is refereed to as a star schema, as the dimensions arranged around the fact table resemble a star! From Wikipedia © Copyright 2006 www. bravesoft. com 1 - 18

Cube • Star Schema is also called a Cube or a Multidimensional Cube. The fundamental structure for data in a multidimensional (OLAP) system. • A cube contains dimensions, hierarchies, levels, and measures. Each individual point in a cube is referred to as a cell. Source: http: //www. sdgcomputing. com/glossary. htm © Copyright 2006 www. bravesoft. com 1 - 19

Degenerate Dimensions • Control numbers which are never added, only used to count or group are candidates for degenerate dimensions • These are dimensions, but the descriptive information has been pulled into other dimensions – Consider an order • Customer • Ship to • Order date – All pulled into other dimensions, only the order number remains • In fact table, identified with prefix dd_ • Degenerate Dimensions are often the grain of the fact table © Copyright 2006 www. bravesoft. com 1 - 20

What is OLAP • An approach to business intelligence very similar to dimensional modeling • Facts and Dimensions are identified • Then, multi dimensional cubes are built – Each fact is associated with all appropriate dimensions – This where term multi-dimensional arises • Data is gathered and aggregated from operational systems © Copyright 2006 www. bravesoft. com 1 - 21

OLAP Database Architectures • There are several options for the physical structure of an OLAP database • The key is supporting data in cubes for user interactions © Copyright 2006 www. bravesoft. com 1 - 22

Simplest OLAP example May 2008 June 2008 July 2008 August 2008 Online Sales 23456234 5235 45 2345345 Offline Sales 2345234 3434 2345234 Introduce Hierarchies May 2008 Online Sales June 2008 July 2008 August 2008 23456234 5235 45 2345345 Internet 21110611 3403 18 2110811 Text Message 234623 1832 27 234535 2345234 3434 2345234 Catalog 2110711 1524402 1374 2110711 In Store 234523 820832 2060 234523 Offline Sales © Copyright 2006 www. bravesoft. com 1 - 23

More Dimensions And Hierarchies Product Group A Apparel Type 1 SKU 3490857 Online Sales SKU 2389057 Internet Apparel Type 2 Text Message SKU 934785 Offline Sales SKU 90348 Catalog SKU 348907 In Store Year 1 Quarter 1 Month 2 Month 3 © Copyright 2006 www. bravesoft. com Quarter 2 Month 4 1 - 24

Logical View Fact Table Sales Cube • • We add dimensions as appropriate Date Key Facts are sliced and diced as need Each entry is a cell Product Key Not every cell will have a fact – eg. Channel Key Sunday sales in a B 2 B environment Sales Fact 1 in cube with a daily grain Sales Fact 2 • The percentage of populated cubes is called the sparsely or density of the cube as n think of cubes ofte ting background coun eople with an ac P big pivot tables © Copyright 2006 www. bravesoft. com 1 - 25

Query Language for an OLAP database • Unlike relational databases, which had SQL there is no equivalent in the OLAP world • The first real standard API was OLE DB for OLAP specification from Microsoft – Appeared in 1997 – The MDX query language – Adopted by most server and client OLAP vendors • In 2001 Microsoft and Hyperion announced the XML for Analysis specification, • XML for Analysis also uses MDX © Copyright 2006 www. bravesoft. com 1 - 26

The Exploding Database • Exploding multidimensional databases are a common – Happens when a Multidimensional database gets so large query performance degrades – The amount of actual data is small, yet the database is huge • How does this happen? – In part, because people are unfamiliar with multidimensional databases, so the phenomenon is widely misunderstood – multidimensional geometry can be counterintuitive © Copyright 2006 www. bravesoft. com 1 - 27

Some Facts You Need to Understand • • Multidimensional databases usually take data from other sources, such as legacy systems, relational databases or desktop tools, such as spreadsheets. A few slides back we saw some of the common approaches to building a multidimensional database – ROLAP -- the data is still physically stored in an RDBMS, usually in some form of star or snowflake schema – MDB (multidimensional database), the data is physically stored in a different file structure, optimized for multidimensional processing and fast retrieval. – Hybrid OLAP products, which allow both direct access to relational data for multidimensional processing, as well as having their own optimized multidimensional disk storage for aggregates and pre-calculated results. Data is stored in an MDB will normally take much less space than it did in the source system, even if it is not summarized • Multidimensional storage takes between a tenth and a half of the space taken to store exactly the same information in a relational database. – This is mainly because the keys, indexes and dimensional structures are either not required at all or take far less space. – Also, the sparsity is often better suppressed and the data may even be compressed © Copyright 2006 www. bravesoft. com 1 - 28

Then, your database gets huge… What happens next? • OLAP applications are intended for interactive use, people expect to get a fast response to queries — ideally, not more than a few seconds – Queries get slower and more complicated if a significant amount of calculations have to be done – hierarchical consolidations – calculations of variances – analyzing trends – deriving computed measures • In order to get a fast response, large multidimensional applications need to pre-calculate some of the information for analysis. This might include high level consolidations • In MDBs, the storage of pre-calculated data is usually automatic and transparent • In ROLAPs, summary tables are normally used © Copyright 2006 www. bravesoft. com 1 - 29

Queries die and never come back The details of the implementation differ, there is no difference in principle between MOLAP and ROLAP products in this. • • • Multidimensional cross relationships exist in all OLAP applications The data is usually very sparse -- the vast majority of possible cells, combinations of dimension members, contain no data. Thinly distributed data values may have hundreds of computed dependent cells hierarchies in each dimension. The ‘computed space’ is much denser than the original data While it is hard to predict the exact value in advance, adding an extra dimension to a multidimensional object with no increase in the amount of input data will at least double the size of the fully computed database. © Copyright 2006 www. bravesoft. com 1 - 30

What to Do? • Avoid fully pre-calculating any multidimensional object with more than five sparse dimensions – – Ratios Variances simple time series conversions rarely viewed consolidations may all be computed on-the-fly • Many products classify data using a concept variously called attributes, properties or characteristics • These are used for on-the-fly groupings, selections and aggregations, without requiring the full overhead of a dimension • Reduce the sparsity of individual data objects by good application design • Use a multicube rather than a hypercube approach • so each object has the minimum number of necessary dimensions © Copyright 2006 www. bravesoft. com 1 - 31

Essbase: An OLAP Product • Essbase is a multidimensional database management system (MDBMS) – A platform to build analytic applications. Essbase, – Its derives from "Extended Spread Sheet data. BASE“ • Originally developed by Arbor Software • Arbor merged with Hyperion Software in 1998 • Hyperion Solutions Corporation was acquired by Oracle Corporation in 2007 © Copyright 2006 www. bravesoft. com 1 - 32

Multidimensional • Essbase is a general-purpose multidimensional database • Developed to address the scalability issues associated with spreadsheets • Consider financial data in spreadsheet format: Jan Feb Mar Apr Sales 232, 234 342, 342 1, 234, 345 Expenses 131, 345 193618 691, 233 20, 607 Profit 100, 889 148, 724 543, 112 13, 738 Units 343 505 1, 822 50 © Copyright 2006 www. bravesoft. com 1 - 33

Looks Like a Cube Already… • Ask a question: How does it break down by region? Now we have multiple spreadsheets © Copyright 2006 www. bravesoft. com 1 - 34

How about a customer breakdown? © Copyright 2006 www. bravesoft. com 1 - 35

Spreadsheet Nightmare, or… • Apply our knowledge of dimensional modeling – What is the business process? • Sales – What is the grain? • Monthly – What are the dimensions? • • Time Region Customer What else? !? !? – What are the facts? • Sales Amounts • Expenses Pro fit i • Units Sold s ca lcul ated © Copyright 2006 www. bravesoft. com 1 - 36

Create a Hierarchy • Essbase includes an administrative tool which allows the analyst to define the dimensions and their hierarchies • • There are two "storage options“ Block Storage Option (Essbase BSO) or Essbase Analytics – – • Dense blocks allocate space for every potential cell in that block Sparse dimensions only create blocks when required. This implementation is hidden from front-end tools Block storage effectively minimizes storage requirements without impacting retrieval time, but it is limited by its treatment of aggregate data in large applications The second storage option is Aggregate Storage Option (Essbase ASO) or Enterprise Analytics – Essbase ASO does not store any aggregate values, but instead calculates them on demand. – Where runtime generation of these values is inconvenient, the database materializes one or more aggregate "views“ – One aggregate level from each dimension – This process can be partially automated © Copyright 2006 www. bravesoft. com 1 - 37

And the Front End is familiar • The front end tools for Essbase are familiar to users – An Excel plug-in is the basic tool – Users pull in data from a cube and Excel it as rolled-up totals on dimension hierarchies – Uses can then drill down or across to investigate the cube • Smart. View is a new product that allows user to employ any Microsoft Office product as their front end © Copyright 2006 www. bravesoft. com 1 - 38

Dashboards and Essbase • Oracle’s acquisition of Hyperion and Oracle’s Fusion efforts means Essbase can be integrated with many of Oracle’s other BI tools – A star schema cube in an Oracle database can be a data source for Essbase – BI Publisher reports can connect to an Essbase database – An OBIEE dashboard can use an Essbase cube as its data source © Copyright 2006 www. bravesoft. com 1 - 39

Migration • So, what about data stored in a Star Schema in a relational data base – How do we move it to an Essbase database? © Copyright 2006 www. bravesoft. com 1 - 40

The Data Warehouse © Copyright 2006 www. bravesoft. com 1 - 41

Configure and Use the Integration Services Console • Oracle has built a tool which allows you to map objects in a relational database to an Essbase cube • It is included as a component in Essbase System – 9. • Confirm that your Integration Server is up and configured properly. • Start the Integration Console, you should see this dialogue • Although there are drop down boxes, you will have to type each of the entries. © Copyright 2006 www. bravesoft. com 1 - 42

Attach to the Star Schema • • • The Server is the name of the server on which your Oracle database is running. The Catalog ODBS DSN in this case is an entry in the tnsname. ora file. The prefix Oracle: identifies it as a tnsnames entry to Essbase. BSORCL is the identifier for this tnsnames entry. The Code Page is the language. User Name here refers to the database schema in which you would like an OLAP Metadata catalog created. – Here the catalog is being installed in Scott/Tiger (bad practice) • Finally, press the Create button to create the catalog and you are ready to log on. © Copyright 2006 www. bravesoft. com 1 - 43

The next dialogue facilitates the connection between your newly created metadata catalog and the Essbase Server © Copyright 2006 www. bravesoft. com 1 - 44

OLAP Model or an OLAP Metaoutline? Create the OLAP model first. © Copyright 2006 www. bravesoft. com 1 - 45

Data Source? • For simplicity in this demo, the same database that was used to store the metadata catalog is also used to as the data source. © Copyright 2006 www. bravesoft. com 1 - 46

Build the OLAP Model © Copyright 2006 www. bravesoft. com 1 - 47

Add Facts Start by creating a fact table. You can select Tools/Create Fact Table from the main menu and select the table to use from the list of tables. Or simply highlight the table name you want to use for your fact table and drag it to diagram. © Copyright 2006 www. bravesoft. com 1 - 48

Time? You will then be asked if you want to create a time dimension. Press No – this demo will use the Transaction Date table for its time dimension. © Copyright 2006 www. bravesoft. com 1 - 49

Accounts are Our Metrics Finally, you will be asked if you want to create an Accounts dimensions. Answer Yes, this is where the measures are stored in a multidimensional model. © Copyright 2006 www. bravesoft. com 1 - 50

Link our Transaction Facts to Accounts Highlight the Transactions, right click and use the tear-off menu to display the columns You can move and re-size objects with standard GUI functionality, grabbing focus, sizing arrows, etc. © Copyright 2006 www. bravesoft. com 1 - 51

Add Dimensions Select Tools/Create Dimensions © Copyright 2006 www. bravesoft. com 1 - 52

Next… © Copyright 2006 www. bravesoft. com 1 - 53

Answer Yes and the Model is Nearly Complete © Copyright 2006 www. bravesoft. com 1 - 54

One table at a Time Offers More Control Drag and drop adds tables to the model and lets you navigate to the dialogue to create links and properties © Copyright 2006 www. bravesoft. com 1 - 55

Now it is Time! Finally, this model needs a time dimension. Transaction Date will work, just double click on the table object in the diagram and a properties dialogue will be displayed. Change the type to Time: © Copyright 2006 www. bravesoft. com 1 - 56

Your Time Dimension will now show a red title bar when selected. © Copyright 2006 www. bravesoft. com 1 - 57

Give the Model a Name and… Save Your Work!! © Copyright 2006 www. bravesoft. com 1 - 58

Create Hierarchies The meat of Business Intelligence are the hierarchies – the ability to accumulate and drill down on dimensions to spot trends, correlations and relationships. © Copyright 2006 www. bravesoft. com 1 - 59

Retailers and the Other Dimensions © Copyright 2006 www. bravesoft. com 1 - 60

OLAP Metaoutline • An Essbase installation is organized into applications. • An application is a data set and a set of business rules that forms a unit of interest to an analyst. • There are several components, one of the chief elements being a database to contain and organize the cubes in the application. • The next is a Metaouline that is used by the Essbase application to organize and describe data and its relationships. © Copyright 2006 www. bravesoft. com 1 - 61

Point and Click… • Begin by selecting File/Open and then in the New tab, selecting OLAP Metaouline while the model selection is the OLAP Model just created. © Copyright 2006 www. bravesoft. com 1 - 62

…And Let the Tool do the Work. . © Copyright 2006 www. bravesoft. com 1 - 63

Nice, eh? © Copyright 2006 www. bravesoft. com 1 - 64

Drill Down © Copyright 2006 www. bravesoft. com 1 - 65

Time to Think – are You Dense? • There are two types of storage available in Essbase applications – Aggregate – Block. According to Edward Roske and Tracy Mc. Mullen compare the two storage options in their book Look Smarter than You Are with Hyperion Essbase (inter. Rel Press, 2007). Block Storage Option (BSO) databases utilize…member formulas, blocks, dense and sparse dimensions, and page and index files. Unfortunately, the block storage architecture…starts to have performance issues as dimensionality and outline sizes grow… Aggregate storage option (ASO) databases were created to deal with … very large sparse data sets with a high number and potentially millions of members. ASO utilizes a new kind of storage mechanism that allows for improved calculation times…the calculations just aren’t as complex. ” • • “Use BSO for applications that require complex calculations and write back capabilities. Use ASO for applications that require a large number of dimensions and members that simply ‘roll up’ (i. e. minimal complex calculations are required). ” ding And Beware the explo © Copyright 2006 database!! www. bravesoft. com 1 - 66

This Cube is Dense © Copyright 2006 www. bravesoft. com 1 - 67

Create an Essbase Application and Database • Time has come to use the Model and Metaoutline you have created to generate an Essbase application and database. • Select OutlineMember Load. • A dialogue will appear. • Tell Essbase what to name the new Essbase application © Copyright 2006 www. bravesoft. com 1 - 68

In the Calc Scripts section… This insures that when the new application is created, the loader calculates aggregates as well as adding the detail level data to the new application. make sure “Use default calc script” is selected. © Copyright 2006 www. bravesoft. com 1 - 69

Essbase creates a database with approximately a million and half records in about one minute © Copyright 2006 www. bravesoft. com 1 - 70

Operations from Essbase’s Administration Console • We will want to access the Essbase Outline • The outline is the organization of the cube • Clean up Essbase assigned names to make them more user friendly • Create Generations • All done from the Essbase Administration Console © Copyright 2006 www. bravesoft. com 1 - 71

We can Review Data © Copyright 2006 www. bravesoft. com 1 - 72

You can also view hierarchies in the outline © Copyright 2006 www. bravesoft. com 1 - 73

Prepare for Integration with OBIEE • Most of the work before you make the actual connection between Essbase and OBIEE has to do with supplying meaningful names and descriptive information for the entries in your outline. Start with the Retailers dimension. A right click, select Generations Enter the labels that are to appear in the dashboard © Copyright 2006 www. bravesoft. com 1 - 74

Working in OBIEE • OBIEE stands for Oracle Business Intelligence Enterprise edition • Formerly known as Siebel Analytics • When Oracle Corp. has acquired Siebel System and decided to make Siebel Analytics their flagship analytic engine and renamed it OBIEE – A reporting component DASHBOARD – Metadata Layer – A repository © Copyright 2006 www. bravesoft. com 1 - 75

Creating a New Repository © Copyright 2006 www. bravesoft. com 1 - 76

Map it to Essbase is a Multidimensional database © Copyright 2006 www. bravesoft. com 1 - 77

The login is the Essbase owner. Select Example 1 Application © Copyright 2006 www. bravesoft. com 1 - 78

Drag and Drop to Create… The Physical layer © Copyright 2006 www. bravesoft. com 1 - 79

Drag and Drop to Create… The Physical layer The Metadata layer © Copyright 2006 www. bravesoft. com 1 - 80

Drag and Drop to Create… The Physical layer The Metadata layer The Presentation layer © Copyright 2006 www. bravesoft. com 1 - 81

Building a Dashboard • The interface and reports are a system to users. • Careful design of an interface is one of the critical success factors in a BI project. • OBIEE’s two main user facing components are Dashboards and BI Publisher. • Our valid repository is Example 1. rpd 1 • This step covers making that. rpd available to an OBIEE dashboard • Then, we will examine generation of a display. © Copyright 2006 www. bravesoft. com 1 - 82

Step by Step • Start by shutting down your BI servers © Copyright 2006 www. bravesoft. com 1 - 83

by step • Now create a folder for Example 1 in your OBIEE catalog © Copyright 2006 www. bravesoft. com 1 - 84

Configuration Settings YOUR_ORACLEBI_HOMEOracle. BIDatawebconfiginstanceconfig. xml © Copyright 2006 www. bravesoft. com 1 - 85

No Worries YOUR_ORACLEBI_HOME Oracle. BIserverConfig NQSConfig. INI © Copyright 2006 www. bravesoft. com 1 - 86

Restart the Servers, then… We have Data!!!! © Copyright 2006 www. bravesoft. com 1 - 87

Oracle Answers Click on column names to build an Answer © Copyright 2006 www. bravesoft. com 1 - 88

Check Your Answer And Save © Copyright 2006 www. bravesoft. com 1 - 89

Navigate to Dashboards Select Edit Dashboard © Copyright 2006 www. bravesoft. com 1 - 90

Add a page, a section, and your saved answer to the new page. Then Save. © Copyright 2006 www. bravesoft. com 1 - 91

A dashboard with full functionality © Copyright 2006 www. bravesoft. com 1 - 92

Conclusions • Clearly, this dashboard is first step. • The plumbing is in place, now you must complete the rest of the house. – Prompts, – Meaningful displays – pivot tables • Small features add up to a big BI experience • There are many other fine tutorials and online papers that will help you refine your dashboard – now that you have a multidimensional database supplying the cube with the data. © Copyright 2006 www. bravesoft. com 1 - 93

Thank You! Bravesoft. TECH. www. bravesoft. com 3131 South State Street Suite 307 Ann Arbor MI 48108 877 -734 -2780 Fax: 734 -786 -8476 © Copyright 2006 www. bravesoft. com 1 - 94

Essbase Tips N Tricks Sep 30 th, 2005 Charles Chatman Solutions Consultant

Webcast Agenda £ Overview of EAS £ Discuss Migration £ Discuss Unicode £ Triggers £ Overview of Visual Explorer £ Demo of EAS £ Demo of Visual Explorer Copyright © 2005, Hyperion. All rights reserved. 96

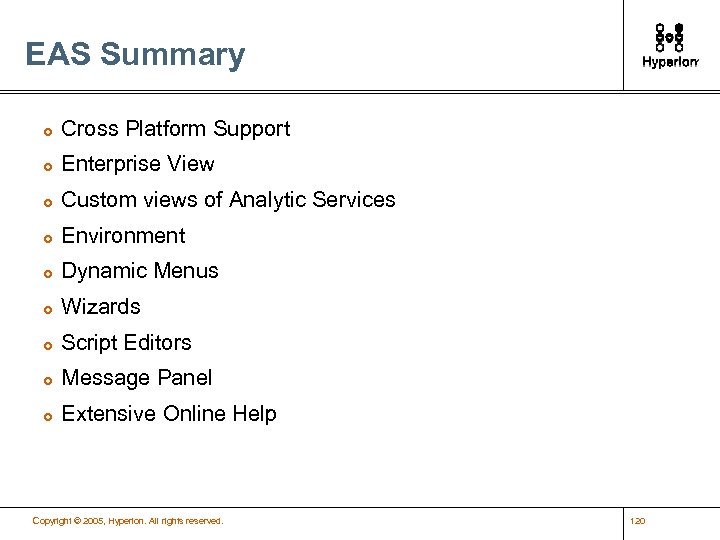
EAS Overview Administration Services Console makes Analytic Services administration tasks easy to perform. The console provides wizards, editors, dynamic menus, and other tools to help you implement, monitor, and maintain Analytic Services. Copyright © 2005, Hyperion. All rights reserved. 97

EAS Features £ Cross Platform Support £ Enterprise View £ Custom views of Analytic Services £ Dynamic Menus £ Wizards £ Script Editors £ Message Panel £ Extensive Online Help Copyright © 2005, Hyperion. All rights reserved. 98

EAS Architecture Overview £ £ Administrative Services works with Essbase in a three tier system that consists of a client user interface, and middle tier server and one or more database servers. The Middle Tier coordinates interaction and resources between the User interface and the Analytic Server. Copyright © 2005, Hyperion. All rights reserved. 99

EAS Architecture Client Tier £ Java Console Middle Tier £ Administration Server Database Tier £ One or more Analytic Servers Copyright © 2005, Hyperion. All rights reserved. 100

EAS Additional Components £ Essbase Deployment Services £ HUB Copyright © 2005, Hyperion. All rights reserved. 101

EAS Third Party Components £ An Application Server £ Application RDBMS £ Java Runtime Environment Copyright © 2005, Hyperion. All rights reserved. 102

Upgrading to EAS best practices £ Verify that you have all documentation and software required for installation. £ Decide how you want to deploy Admin Services. £ Ensure that youv’e met all prerequisets. £ Confirm that your’e platform is supported by EAS £ Export User information (optional) £ Backup the Directory used to store Objects. Copyright © 2005, Hyperion. All rights reserved. 103

Aggregate Storage Copyright © 2005, Hyperion. All rights reserved. 104

What Is Aggregate Storage? £ A new storage kernel £ Aggregate-intensive cubes £ £ Larger numbers of dimensions and members Optimized for sparser data sets, operational analytics Significantly reduces calculation times and disk footprint Designed to work seamlessly with existing interfaces and user skills Copyright © 2005, Hyperion. All rights reserved. 105

Accessing a Wider Application Set Dense data sets Hyperion Essbase is well suited for block storage ROLAP Dual Storage (Block Storage/ Aggregate Storage) Aggregate Storage Sparse data sets ROLAP technologies are well suited for aggregate storage Simple calc (high aggregation) Copyright © 2005, Hyperion. All rights reserved. Block Storage Aggregate Storage Complex calc (complex analytics) 106

Delivering End-to-End Support Analysis Query & Reporting Dashboards 3 rd Party Integration Hyperion Essbase Budgeting & Financial Consolidations Forecasting & Profitability Analysis Procurement & Logistics Analysis Customer Analysis Block Storage Aggregate Storage Copyright © 2005, Hyperion. All rights reserved. 107

Combined Solution To maximize functionality, combine Historical and Forecast Federated View Aggregate or Block Storage SKU Product Profitability Aggregate Storage Option Product Profitability Forecast Dense/Sparse Storage Option Highly additive and dimensional Transparent Partition High write back and analytical Copyright © 2005, Hyperion. All rights reserved. Multi user write back 108

Calculating Aggregate Storage Databases £ To improve retrieval performance, Analytic Services can aggregate values and store them ahead of time. Aggregating and storing all values requires disk space for storage. Analytic Services provides an intelligent aggregation process that balances time and storage resources. Copyright © 2005, Hyperion. All rights reserved. 109
Unicode Copyright © 2005, Hyperion. All rights reserved. 110
Unicode £ Through its Unicode implementation, Essbase Analytic Services enables employees of global businesses to view, in their own languages, company information stored in their Analytic Services databases. Copyright © 2005, Hyperion. All rights reserved. 111
Unicode £ Analytic Services users whose computers are set up in different languages can work with the same database. Copyright © 2005, Hyperion. All rights reserved. 112
Example – member names £ Not Unicode-enabled Essbase — Max member name is 80 bytes — Multibyte languages get fewer characters — Japanese gets 40 -80 chars, Chinese fewer £ Unicode-enabled Essbase — Max member name is 80 characters — Can be up to 320 bytes Copyright © 2005, Hyperion. All rights reserved. 113
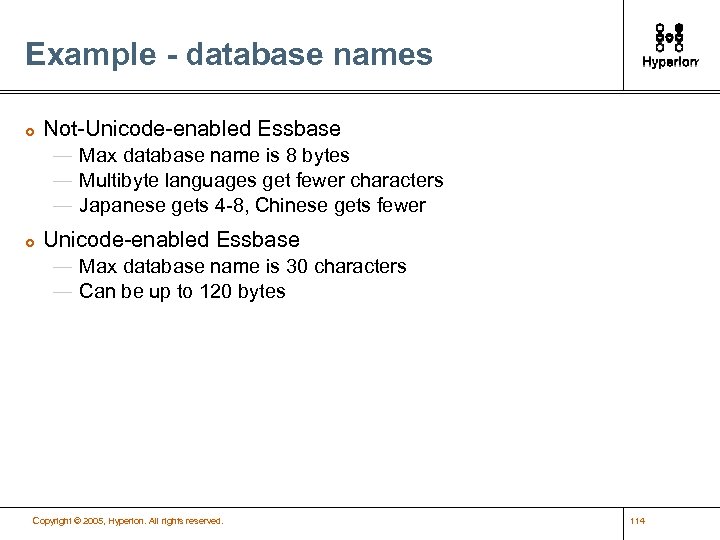
Example - database names £ Not-Unicode-enabled Essbase — Max database name is 8 bytes — Multibyte languages get fewer characters — Japanese gets 4 -8, Chinese gets fewer £ Unicode-enabled Essbase — Max database name is 30 characters — Can be up to 120 bytes Copyright © 2005, Hyperion. All rights reserved. 114
Triggers Copyright © 2005, Hyperion. All rights reserved. 115
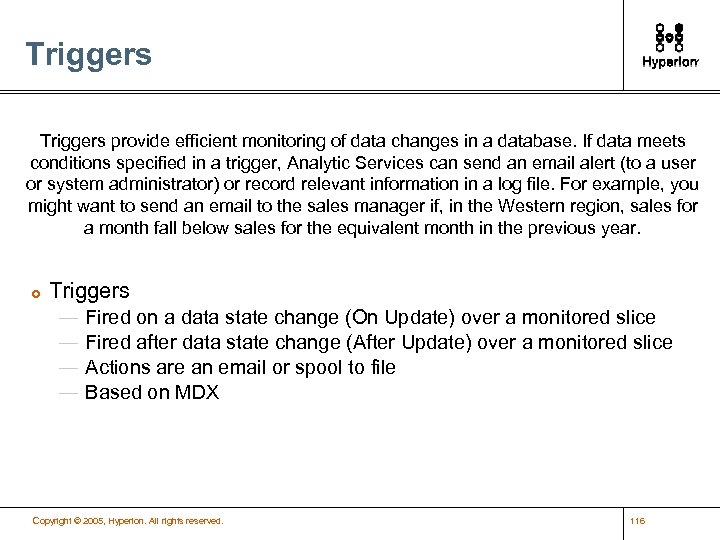
Triggers provide efficient monitoring of data changes in a database. If data meets conditions specified in a trigger, Analytic Services can send an email alert (to a user or system administrator) or record relevant information in a log file. For example, you might want to send an email to the sales manager if, in the Western region, sales for a month fall below sales for the equivalent month in the previous year. £ Triggers — — Fired on a data state change (On Update) over a monitored slice Fired after data state change (After Update) over a monitored slice Actions are an email or spool to file Based on MDX Copyright © 2005, Hyperion. All rights reserved. 116
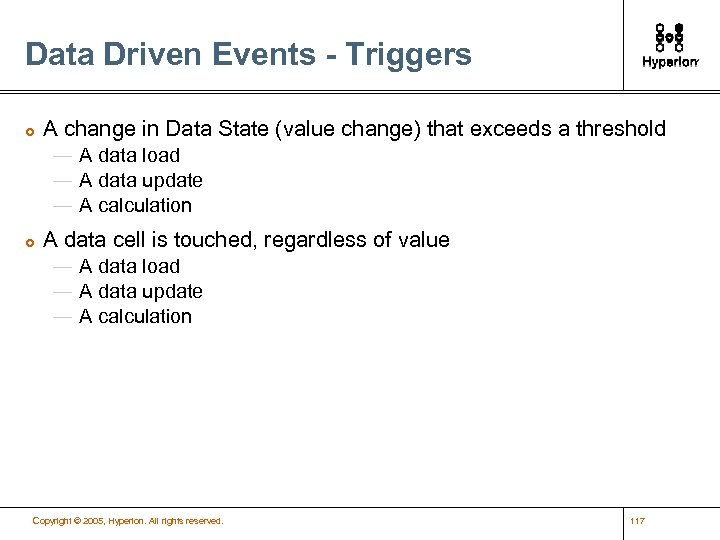
Data Driven Events - Triggers £ A change in Data State (value change) that exceeds a threshold — A data load — A data update — A calculation £ A data cell is touched, regardless of value — A data load — A data update — A calculation Copyright © 2005, Hyperion. All rights reserved. 117
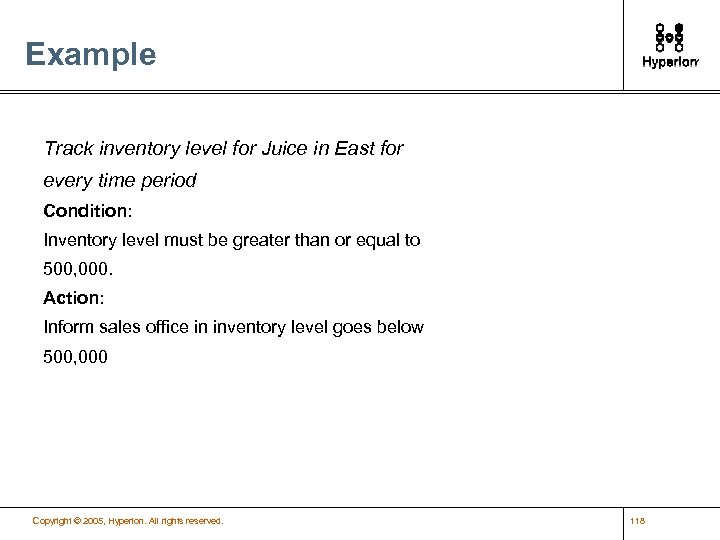
Example Track inventory level for Juice in East for every time period Condition: Inventory level must be greater than or equal to 500, 000. Action: Inform sales office in inventory level goes below 500, 000 Copyright © 2005, Hyperion. All rights reserved. 118
![Example CREATE OR REPLACE TRIGGER Inventory_East WHERE CROSSJOIN ({ DESCENDANTS ([YEAR])}, {([MARKET]. [EAST], [PRODUCT]. Example CREATE OR REPLACE TRIGGER Inventory_East WHERE CROSSJOIN ({ DESCENDANTS ([YEAR])}, {([MARKET]. [EAST], [PRODUCT].](https://present5.com/presentation/937383eb77040c3405ef2fd7a9cb4643/image-119.jpg)
Example CREATE OR REPLACE TRIGGER Inventory_East WHERE CROSSJOIN ({ DESCENDANTS ([YEAR])}, {([MARKET]. [EAST], [PRODUCT]. [JUICE], [INVENTORY]. [BOTTLES])}) WHEN [INVENTORY]. [BOTTLES] < 500, 000 THEN MAIL([pencil. hyperion. com], [Sale. Mgr@hyperion. com, REGIONALSALES@ESSBASE. COM], [inventory@hyperion. com], [Inventory Department]) END; Copyright © 2005, Hyperion. All rights reserved. 119
EAS Summary £ Cross Platform Support £ Enterprise View £ Custom views of Analytic Services £ Environment £ Dynamic Menus £ Wizards £ Script Editors £ Message Panel £ Extensive Online Help Copyright © 2005, Hyperion. All rights reserved. 120
Migration Copyright © 2005, Hyperion. All rights reserved. 121
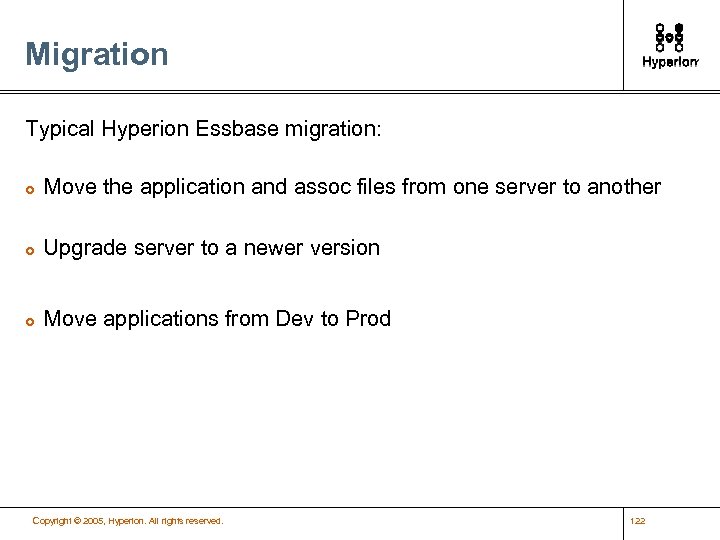
Migration Typical Hyperion Essbase migration: £ Move the application and assoc files from one server to another £ Upgrade server to a newer version £ Move applications from Dev to Prod Copyright © 2005, Hyperion. All rights reserved. 122
Migration Components Examples of Migration Components: £ Application — — — — £ Outline Load Rules Data Calc Scripts Report Scripts Configuration Files Security Filters Security — Users — Groups Copyright © 2005, Hyperion. All rights reserved. 123
Migration Commands Examples of Migration Commands: £ Begin Archive/End Archive Copyright © 2005, Hyperion. All rights reserved. 124
Visual Explorer Copyright © 2005, Hyperion. All rights reserved. 125
HVE Overview £ Hyperion Visual Explorer (HVE) helps you explore and analyze data in a Hyperion Analytic Services database. Specifically, it provides an interface for creating graphical summaries and reports of data in a highly interactive environment. Copyright © 2005, Hyperion. All rights reserved. 126
What is Hyperion Visual Explorer? £ £ Spreadsheet Analysis metaphor delivered via a highly graphical visual paradigm Based on a powerful Visual Query Language that describes how to visualize the data — Adapts visual representation based on the layout of the metrics and members £ Allows more productive analysis across many dimensions/members — Quickly identify outliers, under/over achievers, variances Copyright © 2005, Hyperion. All rights reserved. 127
Visual Explorer Summary £ Explore £ Analyze £ Visualize Copyright © 2005, Hyperion. All rights reserved. 128

Questions ? ? ? Copyright © 2005, Hyperion. All rights reserved. ? 129
Copyright © 2005, Hyperion. All rights reserved. 130
Improving Forecasts With Allocations In Hyperion Planning / Essbase Michigan Oracle Users Summit 2012 November 14, 2012
Presentation Outline • Introductions • Steve Light & the Clear. Line Group • Allocations • Where allocations fit into forecasting • Overview of Hyperion allocation options • Allocations in a real rolling forecast • Q&A © 2011 – Clear. Line Group, L. L. C. 132
INTRODUCTIONS © 2011 – Clear. Line Group, L. L. C.
Steve Light • Director in Clear. Line’s Hyperion Practice • 17 years experience with Hyperion Products • • Started on Essbase 3 and certified on 4, 5, 6, 7, 9. 0, 9. 3, & 11 Beta tester for ASO on 7. 1 and worked with 7 x & 9 x Hyperion Planning 2, 4, 9. 3, and 11 (Classic & EPMA) Analyzer / Web Analysis, Financial Reports • Worked on 59 different projects at 43 companies • Industries • Aviation, Banking, Consumer Products, Financial, Health Care, Insurance, Manufacturing, Retail, Pharmaceutics, Publishing, Telecom, and Transportation © 2011 – Clear. Line Group, L. L. C. 134
Overview of Clear. Line Group Boutique consulting firm of highly experienced Hyperion EPM experts • Core team has a deep history of success working together for over 12 years. ‘Pioneers’ consulting in the Hyperion technologies • • Backgrounds blend industry and consulting experience Breadth of skills from expert level advisory, executive visioning and project management to hands-on architecture and implementation All full-time employees, focused on the long-term success of the firm Clear. Line provides a consistent source of high caliber experts who leverage the collective experience of our group to deliver superior results © 2011 – Clear. Line Group, L. L. C. 135
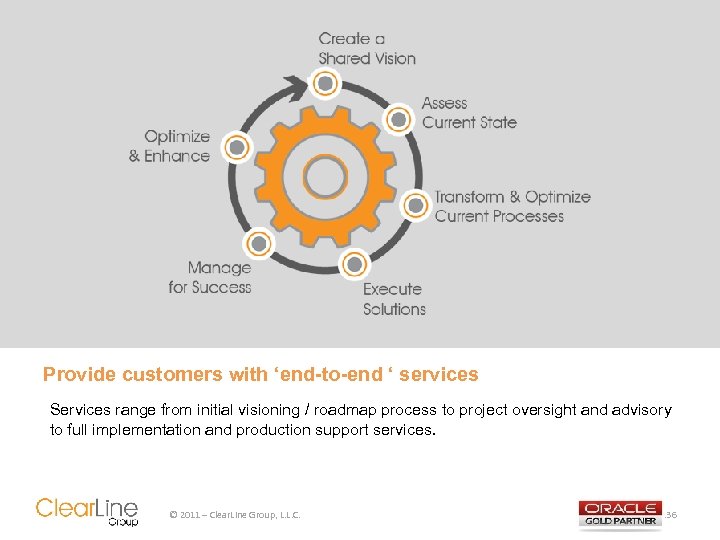
Provide customers with ‘end-to-end ‘ services Services range from initial visioning / roadmap process to project oversight and advisory to full implementation and production support services. © 2011 – Clear. Line Group, L. L. C. 136
WHERE ALLOCATIONS FIT INTO FORECASTING © 2011 – Clear. Line Group, L. L. C.

What is an allocation? It is a system of dividing expenses and incomes among the various branches and departments of a business. © 2011 – Clear. Line Group, L. L. C. 138
Business Samples • Allocating costs across • Often used for driver based cost components in rolling forecasts • Manufacturing costs (e. g. electricity) could be allocated to lines based on equipment type and volume © 2011 – Clear. Line Group, L. L. C. 139
Business Samples • Allocating high level forecasts down • High level values being pushed down to detailed plans • Top Down • Middle Out • Most of this presentation is focused on this type of allocation © 2011 – Clear. Line Group, L. L. C. 140
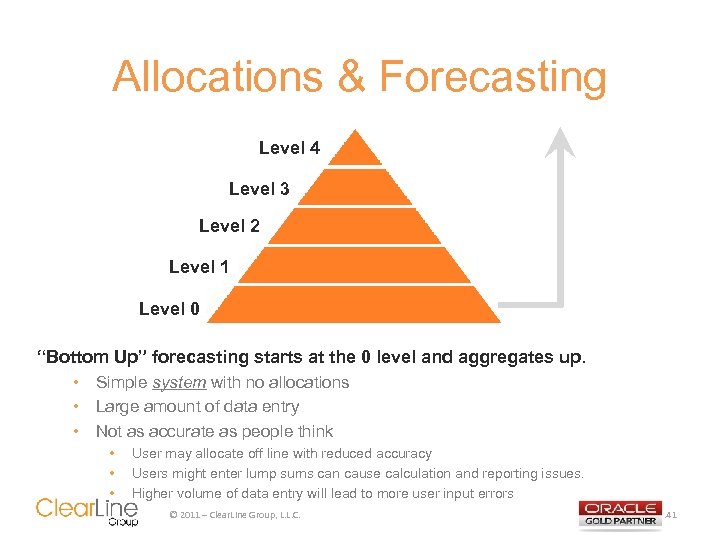
Allocations & Forecasting Level 4 Level 3 Level 2 Level 1 Level 0 “Bottom Up” forecasting starts at the 0 level and aggregates up. • Simple system with no allocations • Large amount of data entry • Not as accurate as people think • • • User may allocate off line with reduced accuracy Users might enter lump sums can cause calculation and reporting issues. Higher volume of data entry will lead to more user input errors © 2011 – Clear. Line Group, L. L. C. 141
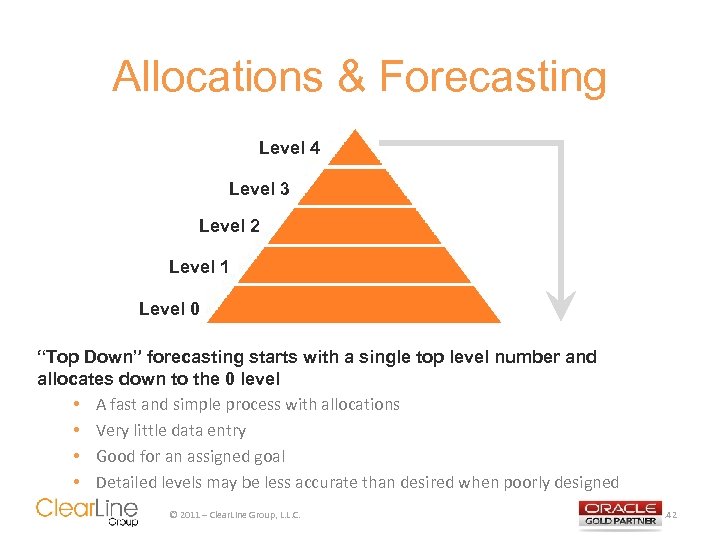
Allocations & Forecasting Level 4 Level 3 Level 2 Level 1 Level 0 “Top Down” forecasting starts with a single top level number and allocates down to the 0 level • A fast and simple process with allocations • Very little data entry • Good for an assigned goal • Detailed levels may be less accurate than desired when poorly designed © 2011 – Clear. Line Group, L. L. C. 142
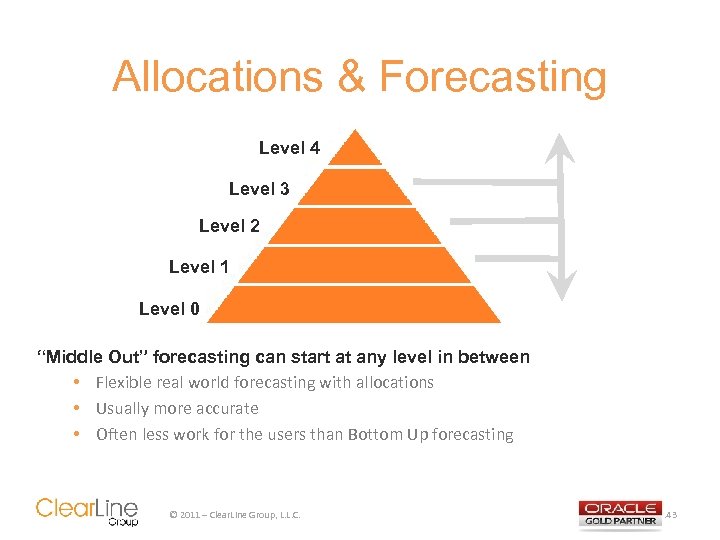
Allocations & Forecasting Level 4 Level 3 Level 2 Level 1 Level 0 “Middle Out” forecasting can start at any level in between • Flexible real world forecasting with allocations • Usually more accurate • Often less work for the users than Bottom Up forecasting © 2011 – Clear. Line Group, L. L. C. 143
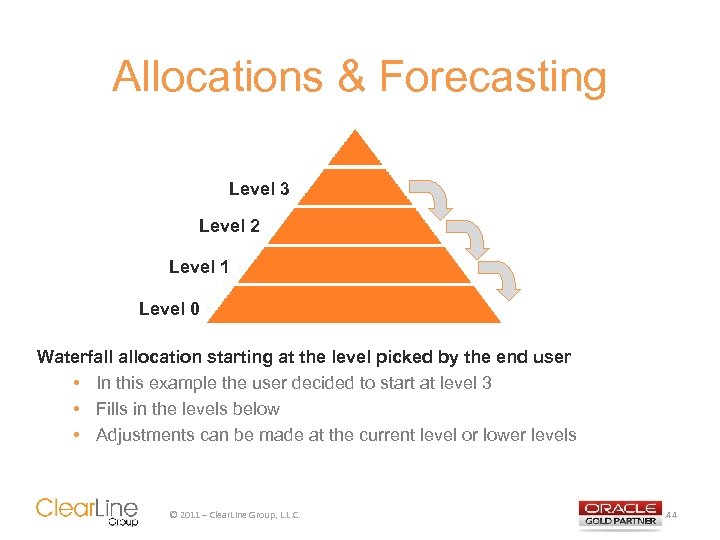
Allocations & Forecasting Level 3 Level 2 Level 1 Level 0 Waterfall allocation starting at the level picked by the end user • In this example the user decided to start at level 3 • Fills in the levels below • Adjustments can be made at the current level or lower levels © 2011 – Clear. Line Group, L. L. C. 144
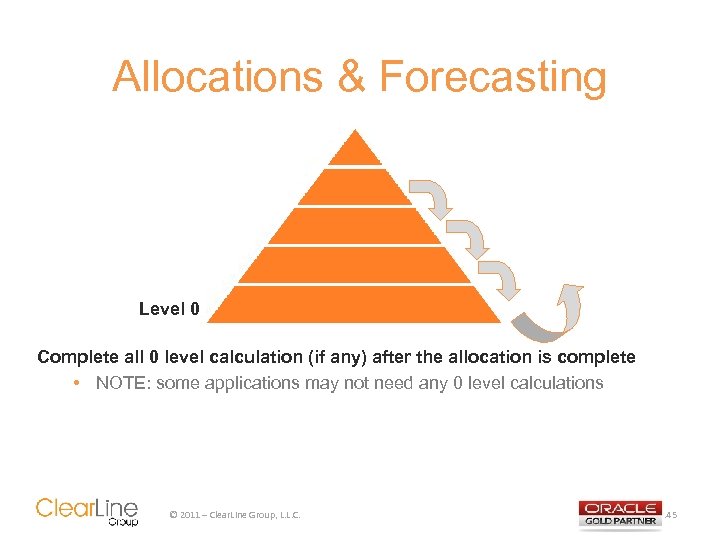
Allocations & Forecasting Level 0 Complete all 0 level calculation (if any) after the allocation is complete • NOTE: some applications may not need any 0 level calculations © 2011 – Clear. Line Group, L. L. C. 145
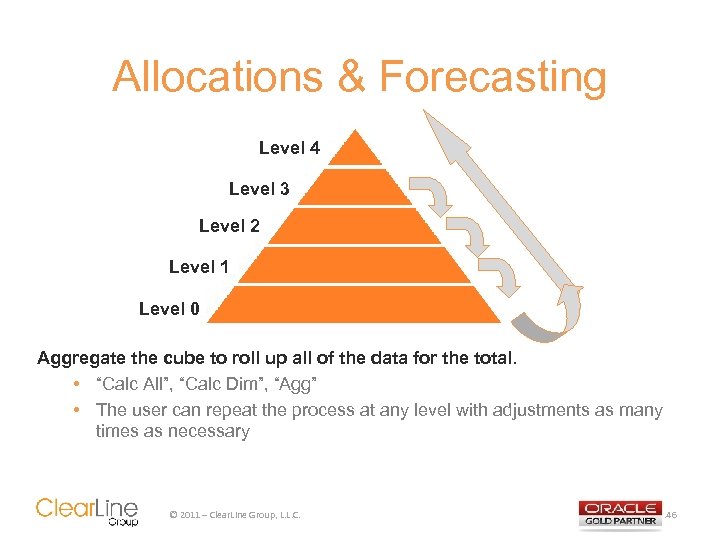
Allocations & Forecasting Level 4 Level 3 Level 2 Level 1 Level 0 Aggregate the cube to roll up all of the data for the total. • “Calc All”, “Calc Dim”, “Agg” • The user can repeat the process at any level with adjustments as many times as necessary © 2011 – Clear. Line Group, L. L. C. 146
OVERVIEW OF HYPERION ALLOCATIONS OPTIONS © 2011 – Clear. Line Group, L. L. C.
Numerous Allocation Options • Oracle has provided a lot of different ways to allocate data within the Hyperion products • There also third party options • You need to pick the right tool for the job • What is important to your project? • • • Upper level writes Audit trails Allocating down verses across Calculation complexity verses large data volumes In memory verses directly impacting data in the cube • Do you already own something that can do the job? © 2011 – Clear. Line Group, L. L. C. 148
Built-in Options for Hyperion Planning • Adjusting & Spreading Data • Hyperion Planning web form feature • Adjust either individual or multiple data cell values up or down by a percentage or by a specific amount • Security lets users only adjust cells with write access • Date and text values are automatically excluded • Further flexibility by utilizing cell locking • Temporarily lock cells while Hyperion Planning calculates and spreads the results into the unlocked cells within the range • Users are given the opportunity to evaluation the new values before sending the data to the database © 2011 – Clear. Line Group, L. L. C. 149
Built-in Options for Hyperion Planning • Time Spreading • Hyperion Planning web form feature • Allows data to be entered at a high level instantly allocated • Spreading data based on a proportional allocation of existing values • Spreading week level based on i. e. 4– 5– 4, 4– 4– 5, 5– 4– 4, or None • Adjusts for Time Balance • Security lets users only adjust cells with write access • Further flexibility by utilizing cell locking • Temporarily lock cells while Hyperion Planning calculates and spreads the results into the unlocked cells within the range • Users are given the opportunity to evaluation the new values before sending the data to the database © 2011 – Clear. Line Group, L. L. C. 150
Built-in Options for Hyperion Planning • Grid Spread must be enabled as a data form property • Specify an amount or percentage to change values on the data form • Selectable spreading patterns (Proportional, Even Split, & Fill) • Can see results immediately on the data form • Can save the new data or discard it. • Ignores read-only, locked cells, and cells having supporting detail. • Data integrity is safeguarded by spreading values only to cells that you have access to. © 2011 – Clear. Line Group, L. L. C. 151
Built-in Options for Hyperion Planning • Mass Allocation • Need Mass Allocate role assigned Shared Services and the Mass Allocate data form property must be enabled • Spreads data even to cells not displayed on the data form • Allocates data to all the source cell's descendants • Allocates across multiple dimensions • Allocate from either a subtotal cell or total cell • Uses dynamically-created calculation scripts • Customized spreading patterns • Does not require that you have access to the target cells • Cannot be undone after you mass allocate values © 2011 – Clear. Line Group, L. L. C. 152
Oracle Essbase ASO • Oracle Essbase ASO allocations • Added in Oracle Essbase Release 11. 1. 2 • This is GREAT when it fits your needs • • • Scale up the size of the database Allows simple allocations to run with great speed Allocations any level in the database’s dimension hierarchies Spread evenly or as a percent of total Runs within Max. L or in the API Results use ASO’s temporary data load buffers • Keep in mind ASO database allocations are not quite as flexible as BSO allocations • Write back only at the level 0 • Cannot use relative references to dimension members © 2011 – Clear. Line Group, L. L. C. 153
Hyperion Profitability & Cost Management (HPCM) • Provides actionable insights into costs and profitability • Drives performance by discovering drivers of cost & profitability • Visible maps and audit trails on business drivers to improve resource alignment with allocations • Complete complex calculations and still scales • Flexibility and visibility to accurately allocate values • Allocation engine supports a wide range of methodologies • Graphical traceability maps and data lineage • User-defined business rules • Robust ability to distribute indirect costs and project based allocations © 2011 – Clear. Line Group, L. L. C. 154
Third Party Tools • PACE • Robust and easy to use 3 rd party tool for Essbase BSO • In-memory engine built to extend Essbase’s spreading and allocation functionality • Rapid calculation with advanced “what-if” modeling • Data is only written back to the database when the planner decides that it ready to send • Pace includes additional features like: • • n-Dimensional Locking-and- Spreading Built-in Business Logic Inverse Calculation Logic for multiple targets Multi-Dimensional Web- Enabled Spreadsheet © 2011 – Clear. Line Group, L. L. C. 155
Calculation Script Definition • Oracle Essbase BSO Calculation Scripts and Hyperion Business Rules • Easier than a lot of people think • Allocations let you to distribute values that are at the parent level across child members. • Allocations are based on a number of criteria that can be expressed in the following functions. • @ALLOCATE – a single dimension • @MDALLOCATE – across multiple dimensions © 2011 – Clear. Line Group, L. L. C. 156
![@ALLOCATE Oracle Essbase Technical Reference Syntax: @ALLOCATE (amount, allocation. Range, basis. Mbr, [round. Mbr], @ALLOCATE Oracle Essbase Technical Reference Syntax: @ALLOCATE (amount, allocation. Range, basis. Mbr, [round. Mbr],](https://present5.com/presentation/937383eb77040c3405ef2fd7a9cb4643/image-157.jpg)
@ALLOCATE Oracle Essbase Technical Reference Syntax: @ALLOCATE (amount, allocation. Range, basis. Mbr, [round. Mbr], method [, method. Params] [, round [, num. Digits][, round. Err]]) Required Parameters: • Amount – what you want to allocate • Allocation. Range – where you want to allocate to • Method – how the allocation works • Basis. Mbr – provides the “Method” with a pattern Optional Parameters: • Method. Params – addition options on how the Method will work © 2011 – Clear. Line Group, L. L. C. 157
![@ALLOCATE Oracle Essbase Technical Reference Syntax: @ALLOCATE (amount, allocation. Range, basis. Mbr, [round. Mbr], @ALLOCATE Oracle Essbase Technical Reference Syntax: @ALLOCATE (amount, allocation. Range, basis. Mbr, [round. Mbr],](https://present5.com/presentation/937383eb77040c3405ef2fd7a9cb4643/image-158.jpg)
@ALLOCATE Oracle Essbase Technical Reference Syntax: @ALLOCATE (amount, allocation. Range, basis. Mbr, [round. Mbr], method [, method. Params] [, round [, num. Digits][, round. Err]]) Optional Rounding Parameters: • Round. Mbr – where rounding errors are added • Round – turns it on and specifies the member • Num. Digits – specifies decimal places to round to • Round. Err – specifies how you deal with rounding errors © 2011 – Clear. Line Group, L. L. C. 158
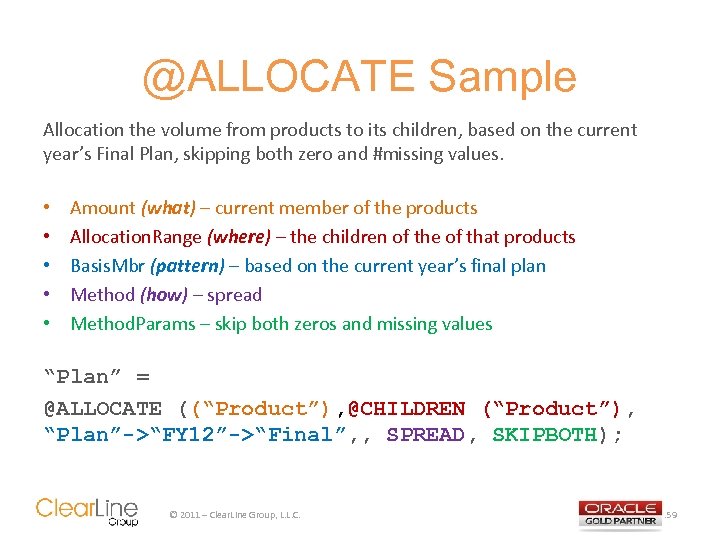
@ALLOCATE Sample Allocation the volume from products to its children, based on the current year’s Final Plan, skipping both zero and #missing values. • • • Amount (what) – current member of the products Allocation. Range (where) – the children of the of that products Basis. Mbr (pattern) – based on the current year’s final plan Method (how) – spread Method. Params – skip both zeros and missing values “Plan” = @ALLOCATE ((“Product”), @CHILDREN (“Product”), “Plan”->“FY 12”->“Final”, , SPREAD, SKIPBOTH); © 2011 – Clear. Line Group, L. L. C. 159
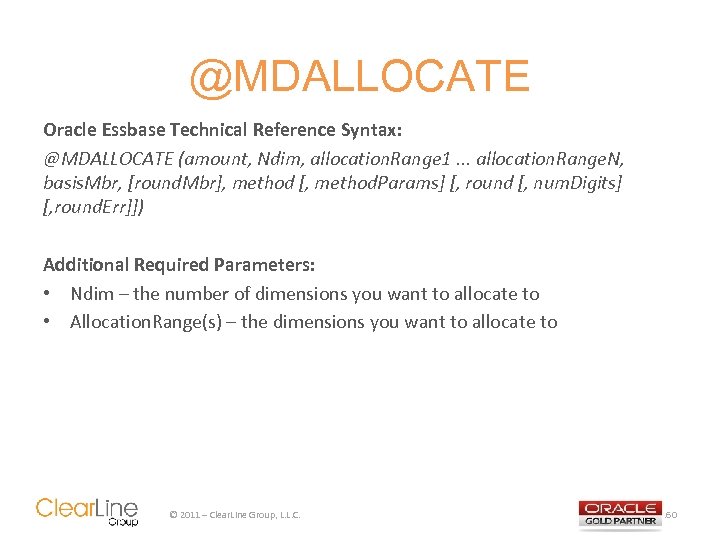
@MDALLOCATE Oracle Essbase Technical Reference Syntax: @MDALLOCATE (amount, Ndim, allocation. Range 1. . . allocation. Range. N, basis. Mbr, [round. Mbr], method [, method. Params] [, round [, num. Digits] [, round. Err]]) Additional Required Parameters: • Ndim – the number of dimensions you want to allocate to • Allocation. Range(s) – the dimensions you want to allocate to © 2011 – Clear. Line Group, L. L. C. 160
ALLOCATIONS IN A “REAL” ROLLING FORECAST © 2011 – Clear. Line Group, L. L. C.
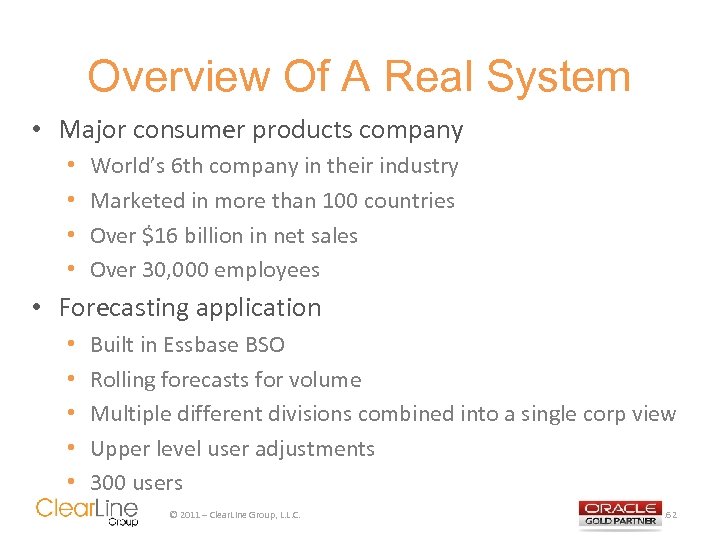
Overview Of A Real System • Major consumer products company • • World’s 6 th company in their industry Marketed in more than 100 countries Over $16 billion in net sales Over 30, 000 employees • Forecasting application • • • Built in Essbase BSO Rolling forecasts for volume Multiple different divisions combined into a single corp view Upper level user adjustments 300 users © 2011 – Clear. Line Group, L. L. C. 162
Basic Features • 4 years of weekly volume data for 30, 000 SKUs • Fully automated processing of historical data with built in error checking and email alerts • On the fly conversions for Scaling & Currency • 0 Level conversions pounds & other units of measure • Rapid calculation. • Company wide allocations in minutes • All other calculations in seconds! • 5 versions for each of the 15 forecast scenarios © 2011 – Clear. Line Group, L. L. C. 163
Advanced Features • Transparent Partitions • Improve performance • Simplifies calculations and security • Waterfall allocations with starting levels controlled by individual end users • Allows for multiple types of forecasting allocations • Bottom Up , Top Down, and Middle Out • End user controls forecast’s source, level, and percent growth/decline via simple flags • End user overrides at any forecast level • Iterative “what if” process quickly restates all products for an entire company’s forecast © 2011 – Clear. Line Group, L. L. C. 164
Forecast Process • Set the run time prompts for the set up and variables with Business Rules and the HBR Launcher • Determine Source – For the forecast’s Basis. Mbr • Product Level – Top Down, Bottom Up, or Middle Out • Percent Growth/Decline • NOTE: This can work using flag members and fix statements in calc scripts if you are not using Business Rules with run time prompts • Run the set up business rule • Clears old data in the forecast • Rolls current actual data into history forecast periods • Populates a starting point for the forecast based on variables © 2011 – Clear. Line Group, L. L. C. 165
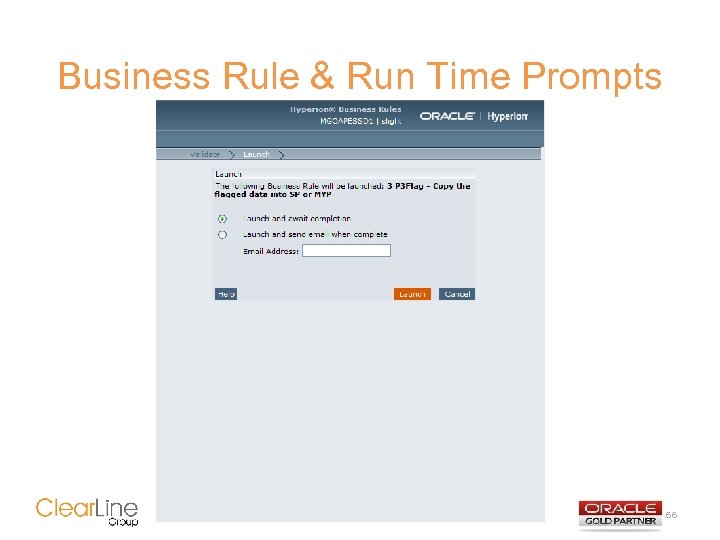
Business Rule & Run Time Prompts © 2011 – Clear. Line Group, L. L. C. 166
Forecast Process (cont) • Run the aggregation (Optional Step) • Rolls up data to the top of the cube • Can be used for a high level forecast • Run the allocation • Allocates from level defined by the flag to lowest level • Automatically switches allocation logic between “Percent Of Total” and “Even Spreading” based on data patterns • Identifies discontinued SKUs, maintained for history, and ignores them during the allocation • Completes stored conversion at the 0 level (if required) • Aggregates all unit conversions to the top of the cube © 2011 – Clear. Line Group, L. L. C. 167
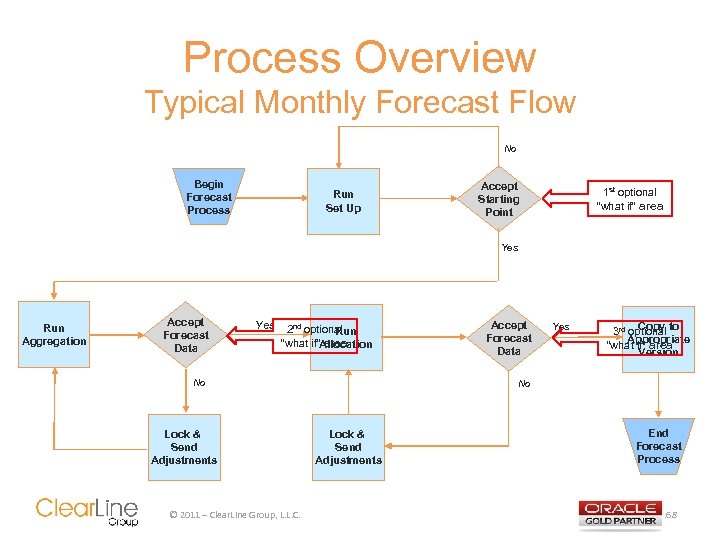
Process Overview Typical Monthly Forecast Flow No Begin Forecast Process Run Set Up Accept Starting Point 1 st optional “what if” area Yes Run Aggregation Accept Forecast Data Yes 2 nd optional Run “what if”Allocation area No Lock & Send Adjustments © 2011 – Clear. Line Group, L. L. C. Accept Forecast Data Yes Copy 3 rd optional to Appropriate “what if” area Version No Lock & Send Adjustments End Forecast Process 168
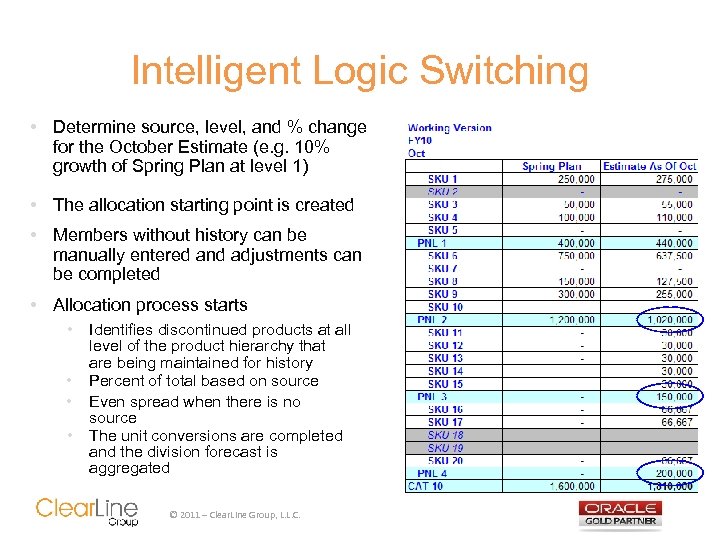
Intelligent Logic Switching • Determine source, level, and % change for the October Estimate (e. g. 10% growth of Spring Plan at level 1) • The allocation starting point is created • Members without history can be manually entered and adjustments can be completed • Allocation process starts • • Identifies discontinued products at all level of the product hierarchy that are being maintained for history Percent of total based on source Even spread when there is no source The unit conversions are completed and the division forecast is aggregated 169 © 2011 – Clear. Line Group, L. L. C.
OK … What Happened!? ! • Hyperion Business Rule Overview • Used the basic @Allocate function • Leverages a lot of features • Fixes and Ifs § Control levels § Optimization • Substitution Variables and Run Time Prompts § Avoids Hardcoding and remove maintenance § Collect user input to drive process • UDAs § Tags discontinued SKUs © 2011 – Clear. Line Group, L. L. C. 170
OK … What Happened!? ! • Hyperion Business Rule Overview • Tuning the calculation • Minimized the passes through the cube • Reduced the number of blocks called into the cache • Automation • Attached to Web Forms (if using Hyperion Planning) • Simple relational database to generate and run Max. L scripts based on the system date for all of the variables • Can run on the fly and scheduled © 2011 – Clear. Line Group, L. L. C. 171
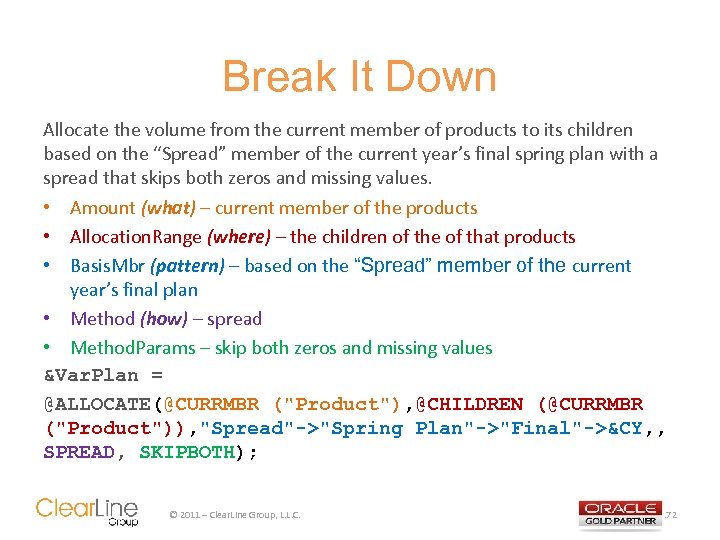
Break It Down Allocate the volume from the current member of products to its children based on the “Spread” member of the current year’s final spring plan with a spread that skips both zeros and missing values. • Amount (what) – current member of the products • Allocation. Range (where) – the children of the of that products • Basis. Mbr (pattern) – based on the “Spread” member of the current year’s final plan • Method (how) – spread • Method. Params – skip both zeros and missing values &Var. Plan = @ALLOCATE(@CURRMBR ("Product"), @CHILDREN (@CURRMBR ("Product")), "Spread"->"Spring Plan"->"Final"->&CY, , SPREAD, SKIPBOTH); © 2011 – Clear. Line Group, L. L. C. 172
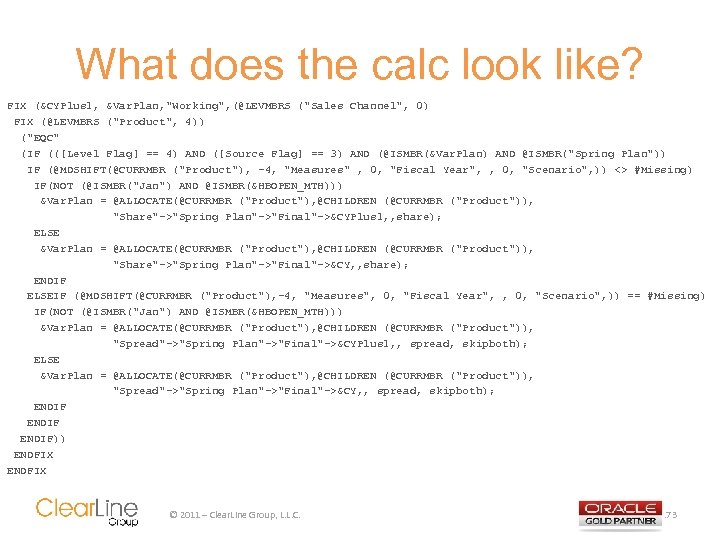
What does the calc look like? FIX (&CYPlus 1, &Var. Plan, "Working", (@LEVMBRS ("Sales Channel", 0) FIX (@LEVMBRS ("Product", 4)) ("EQC" (IF (([Level Flag] == 4) AND ([Source Flag] == 3) AND (@ISMBR(&Var. Plan) AND @ISMBR("Spring Plan")) IF (@MDSHIFT(@CURRMBR ("Product"), -4, "Measures" , 0, "Fiscal Year", , 0, "Scenario", )) <> #Missing) IF(NOT (@ISMBR("Jan") AND @ISMBR(&HBOPEN_MTH))) &Var. Plan = @ALLOCATE(@CURRMBR ("Product"), @CHILDREN (@CURRMBR ("Product")), "Share"->"Spring Plan"->"Final"->&CYPlus 1, , share); ELSE &Var. Plan = @ALLOCATE(@CURRMBR ("Product"), @CHILDREN (@CURRMBR ("Product")), "Share"->"Spring Plan"->"Final"->&CY, , share); ENDIF ELSEIF (@MDSHIFT(@CURRMBR ("Product"), -4, "Measures", 0, "Fiscal Year", , 0, "Scenario", )) == #Missing) IF(NOT (@ISMBR("Jan") AND @ISMBR(&HBOPEN_MTH))) &Var. Plan = @ALLOCATE(@CURRMBR ("Product"), @CHILDREN (@CURRMBR ("Product")), "Spread"->"Spring Plan"->"Final"->&CYPlus 1, , spread, skipboth); ELSE &Var. Plan = @ALLOCATE(@CURRMBR ("Product"), @CHILDREN (@CURRMBR ("Product")), "Spread"->"Spring Plan"->"Final"->&CY, , spread, skipboth); ENDIF)) ENDFIX © 2011 – Clear. Line Group, L. L. C. 173
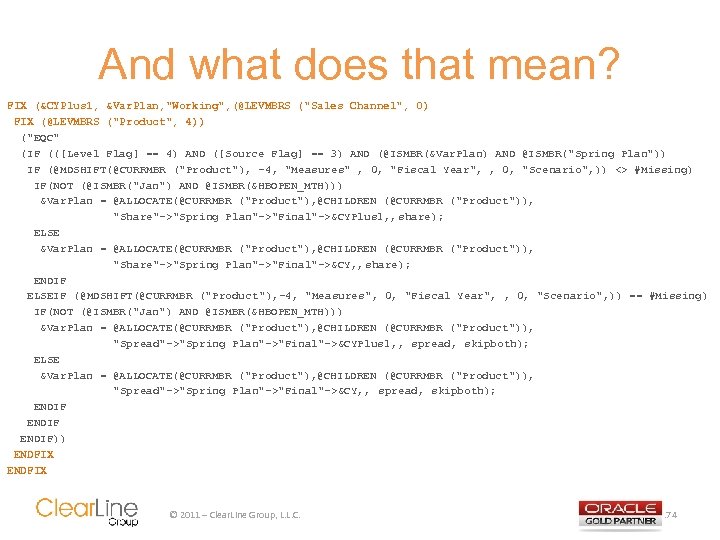
And what does that mean? FIX (&CYPlus 1, &Var. Plan, "Working", (@LEVMBRS ("Sales Channel", 0) FIX (@LEVMBRS ("Product", 4)) ("EQC" (IF (([Level Flag] == 4) AND ([Source Flag] == 3) AND (@ISMBR(&Var. Plan) AND @ISMBR("Spring Plan")) IF (@MDSHIFT(@CURRMBR ("Product"), -4, "Measures" , 0, "Fiscal Year", , 0, "Scenario", )) <> #Missing) IF(NOT (@ISMBR("Jan") AND @ISMBR(&HBOPEN_MTH))) &Var. Plan = @ALLOCATE(@CURRMBR ("Product"), @CHILDREN (@CURRMBR ("Product")), "Share"->"Spring Plan"->"Final"->&CYPlus 1, , share); ELSE &Var. Plan = @ALLOCATE(@CURRMBR ("Product"), @CHILDREN (@CURRMBR ("Product")), "Share"->"Spring Plan"->"Final"->&CY, , share); ENDIF ELSEIF (@MDSHIFT(@CURRMBR ("Product"), -4, "Measures", 0, "Fiscal Year", , 0, "Scenario", )) == #Missing) IF(NOT (@ISMBR("Jan") AND @ISMBR(&HBOPEN_MTH))) &Var. Plan = @ALLOCATE(@CURRMBR ("Product"), @CHILDREN (@CURRMBR ("Product")), "Spread"->"Spring Plan"->"Final"->&CYPlus 1, , spread, skipboth); ELSE &Var. Plan = @ALLOCATE(@CURRMBR ("Product"), @CHILDREN (@CURRMBR ("Product")), "Spread"->"Spring Plan"->"Final"->&CY, , spread, skipboth); ENDIF)) ENDFIX © 2011 – Clear. Line Group, L. L. C. 174
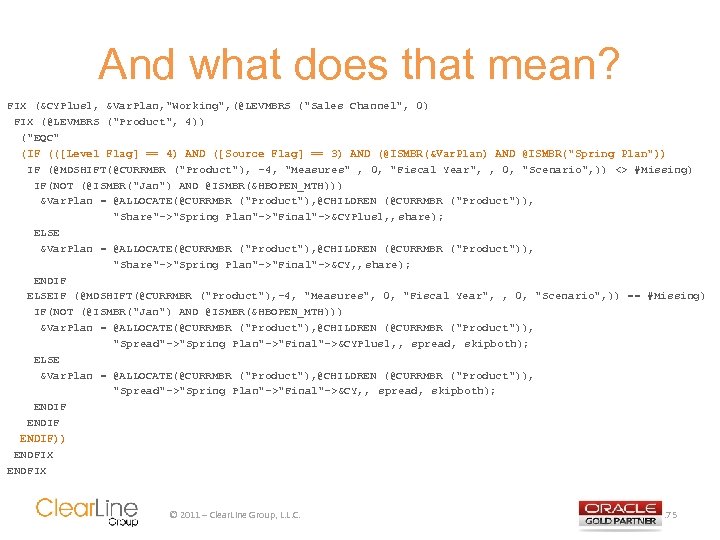
And what does that mean? FIX (&CYPlus 1, &Var. Plan, "Working", (@LEVMBRS ("Sales Channel", 0) FIX (@LEVMBRS ("Product", 4)) ("EQC" (IF (([Level Flag] == 4) AND ([Source Flag] == 3) AND (@ISMBR(&Var. Plan) AND @ISMBR("Spring Plan")) IF (@MDSHIFT(@CURRMBR ("Product"), -4, "Measures" , 0, "Fiscal Year", , 0, "Scenario", )) <> #Missing) IF(NOT (@ISMBR("Jan") AND @ISMBR(&HBOPEN_MTH))) &Var. Plan = @ALLOCATE(@CURRMBR ("Product"), @CHILDREN (@CURRMBR ("Product")), "Share"->"Spring Plan"->"Final"->&CYPlus 1, , share); ELSE &Var. Plan = @ALLOCATE(@CURRMBR ("Product"), @CHILDREN (@CURRMBR ("Product")), "Share"->"Spring Plan"->"Final"->&CY, , share); ENDIF ELSEIF (@MDSHIFT(@CURRMBR ("Product"), -4, "Measures", 0, "Fiscal Year", , 0, "Scenario", )) == #Missing) IF(NOT (@ISMBR("Jan") AND @ISMBR(&HBOPEN_MTH))) &Var. Plan = @ALLOCATE(@CURRMBR ("Product"), @CHILDREN (@CURRMBR ("Product")), "Spread"->"Spring Plan"->"Final"->&CYPlus 1, , spread, skipboth); ELSE &Var. Plan = @ALLOCATE(@CURRMBR ("Product"), @CHILDREN (@CURRMBR ("Product")), "Spread"->"Spring Plan"->"Final"->&CY, , spread, skipboth); ENDIF)) ENDFIX © 2011 – Clear. Line Group, L. L. C. 175
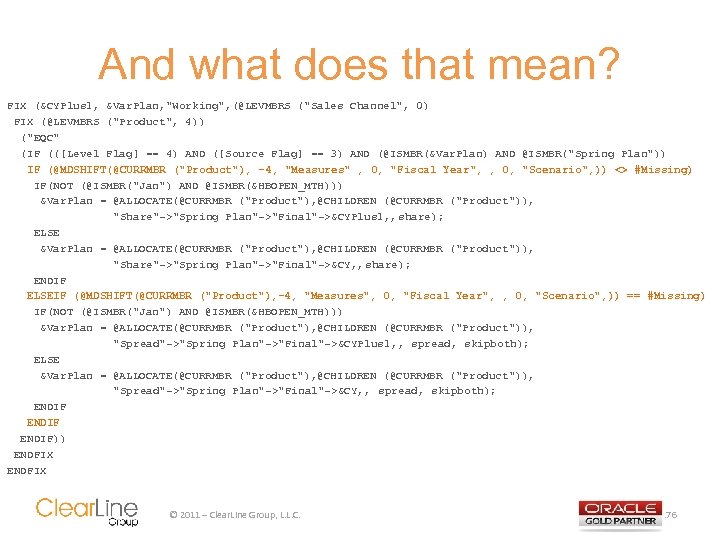
And what does that mean? FIX (&CYPlus 1, &Var. Plan, "Working", (@LEVMBRS ("Sales Channel", 0) FIX (@LEVMBRS ("Product", 4)) ("EQC" (IF (([Level Flag] == 4) AND ([Source Flag] == 3) AND (@ISMBR(&Var. Plan) AND @ISMBR("Spring Plan")) IF (@MDSHIFT(@CURRMBR ("Product"), -4, "Measures" , 0, "Fiscal Year", , 0, "Scenario", )) <> #Missing) IF(NOT (@ISMBR("Jan") AND @ISMBR(&HBOPEN_MTH))) &Var. Plan = @ALLOCATE(@CURRMBR ("Product"), @CHILDREN (@CURRMBR ("Product")), "Share"->"Spring Plan"->"Final"->&CYPlus 1, , share); ELSE &Var. Plan = @ALLOCATE(@CURRMBR ("Product"), @CHILDREN (@CURRMBR ("Product")), "Share"->"Spring Plan"->"Final"->&CY, , share); ENDIF ELSEIF (@MDSHIFT(@CURRMBR ("Product"), -4, "Measures", 0, "Fiscal Year", , 0, "Scenario", )) == #Missing) IF(NOT (@ISMBR("Jan") AND @ISMBR(&HBOPEN_MTH))) &Var. Plan = @ALLOCATE(@CURRMBR ("Product"), @CHILDREN (@CURRMBR ("Product")), "Spread"->"Spring Plan"->"Final"->&CYPlus 1, , spread, skipboth); ELSE &Var. Plan = @ALLOCATE(@CURRMBR ("Product"), @CHILDREN (@CURRMBR ("Product")), "Spread"->"Spring Plan"->"Final"->&CY, , spread, skipboth); ENDIF)) ENDFIX © 2011 – Clear. Line Group, L. L. C. 176
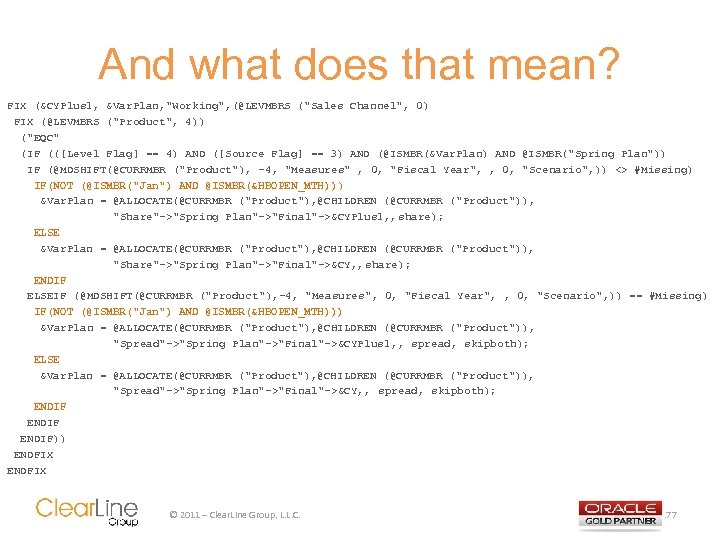
And what does that mean? FIX (&CYPlus 1, &Var. Plan, "Working", (@LEVMBRS ("Sales Channel", 0) FIX (@LEVMBRS ("Product", 4)) ("EQC" (IF (([Level Flag] == 4) AND ([Source Flag] == 3) AND (@ISMBR(&Var. Plan) AND @ISMBR("Spring Plan")) IF (@MDSHIFT(@CURRMBR ("Product"), -4, "Measures" , 0, "Fiscal Year", , 0, "Scenario", )) <> #Missing) IF(NOT (@ISMBR("Jan") AND @ISMBR(&HBOPEN_MTH)) ) &Var. Plan = @ALLOCATE(@CURRMBR ("Product"), @CHILDREN (@CURRMBR ("Product")), "Share"->"Spring Plan"->"Final"->&CYPlus 1, , share); ELSE &Var. Plan = @ALLOCATE(@CURRMBR ("Product"), @CHILDREN (@CURRMBR ("Product")), "Share"->"Spring Plan"->"Final"->&CY, , share); ENDIF ELSEIF (@MDSHIFT(@CURRMBR ("Product"), -4, "Measures", 0, "Fiscal Year", , 0, "Scenario", )) == #Missing) IF(NOT (@ISMBR("Jan") AND @ISMBR(&HBOPEN_MTH))) &Var. Plan = @ALLOCATE(@CURRMBR ("Product"), @CHILDREN (@CURRMBR ("Product")), "Spread"->"Spring Plan"->"Final"->&CYPlus 1, , spread, skipboth); ELSE &Var. Plan = @ALLOCATE(@CURRMBR ("Product"), @CHILDREN (@CURRMBR ("Product")), "Spread"->"Spring Plan"->"Final"->&CY, , spread, skipboth); ENDIF)) ENDFIX © 2011 – Clear. Line Group, L. L. C. 177
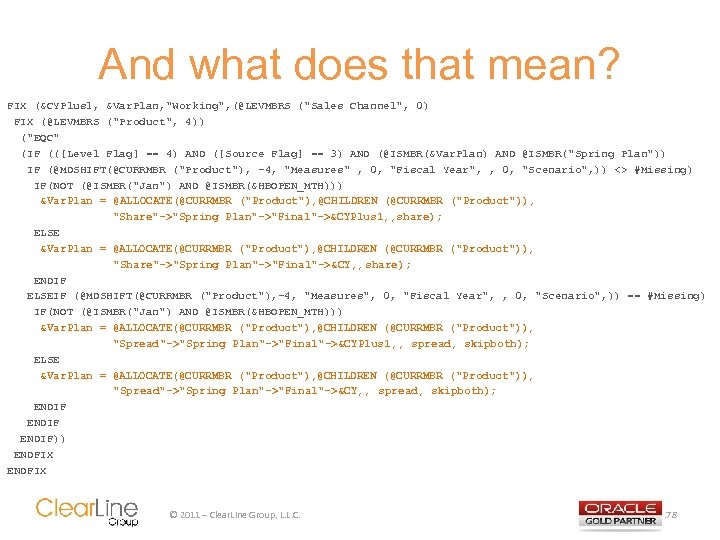
And what does that mean? FIX (&CYPlus 1, &Var. Plan, "Working", (@LEVMBRS ("Sales Channel", 0) FIX (@LEVMBRS ("Product", 4)) ("EQC" (IF (([Level Flag] == 4) AND ([Source Flag] == 3) AND (@ISMBR(&Var. Plan) AND @ISMBR("Spring Plan")) IF (@MDSHIFT(@CURRMBR ("Product"), -4, "Measures" , 0, "Fiscal Year", , 0, "Scenario", )) <> #Missing) IF(NOT (@ISMBR("Jan") AND @ISMBR(&HBOPEN_MTH))) &Var. Plan = @ALLOCATE(@CURRMBR ("Product"), @CHILDREN (@CURRMBR ("Product")), "Share"->"Spring Plan"->"Final"->&CYPlus 1, , share); ELSE &Var. Plan = @ALLOCATE(@CURRMBR ("Product"), @CHILDREN (@CURRMBR ("Product")), "Share"->"Spring Plan"->"Final"->&CY, , share); ENDIF ELSEIF (@MDSHIFT(@CURRMBR ("Product"), -4, "Measures", 0, "Fiscal Year", , 0, "Scenario", )) == #Missing) IF(NOT (@ISMBR("Jan") AND @ISMBR(&HBOPEN_MTH))) &Var. Plan = @ALLOCATE(@CURRMBR ("Product"), @CHILDREN (@CURRMBR ("Product")), "Spread"->"Spring Plan"->"Final"->&CYPlus 1, , spread, skipboth); ELSE &Var. Plan = @ALLOCATE(@CURRMBR ("Product"), @CHILDREN (@CURRMBR ("Product")), "Spread"->"Spring Plan"->"Final"->&CY, , spread, skipboth); ENDIF)) ENDFIX © 2011 – Clear. Line Group, L. L. C. 178

Q & A © 2011 – Clear. Line Group, L. L. C. 179

Clear. Line Group, L. L. C. 250 Parkway Drive Suite 150 Lincolnshire, IL 60069 Call: 855. Clr. Line (855. 257. 5463) Online: slight@clearlinegroup. com www. clearlinegroup. com
937383eb77040c3405ef2fd7a9cb4643.ppt