ce1259a9e1a64cbeac03c9bde8620524.ppt
- Количество слайдов: 128
 Operations Modeling Tutorial © 2009 Alion Science and Technology Rev. 5 012709
 IMPRINT Pro The Improved Performance Research Integration Tool (IMPRINT) was developed for the Army Research Laboratory (ARL) Human Research and Engineering Directorate (HRED). This tutorial describes the professional version of IMPRINT, namely IMPRINT Pro is government owned and consists of a set of automated aids to assist analysts in conducting human performance analyses. It provides the means for estimating manpower, personnel and training (MPT) requirements and constraints for new weapon systems very early in the acquisition process.
 Purpose of the Operations Model IMPRINT Pro allows you to analyze a new weapon system by helping you build models of each operational mission that the weapon system will be capable of accomplishing. Since it is typically easier to describe the mission by breaking it into smaller “sub” functions than trying to describe the mission as a whole, you build these models by breaking down the mission into a network of functions. Each of the functions is then further broken down into a network consisting of other functions and tasks. Sample Task Network: Return to Topics
 Purpose of the Operations Model Once all tasks and functions are defined, the mission is executed. IMPRINT performs the simulation based on how long you tell it to perform each task in the mission and the accuracy you assign to each task. Sample Task Time Estimates: “ 00: 01. 50” “ 00: 02. 25” Return to Topics
 Purpose of the Operations Model If you are interested in predicting the workload associated with your mission, you can assign workload values that reflect the amount of effort the crewmember will have to expend to perform the task. This is done using the Advanced Workload method. This method also enables you to examine the impact of workload management strategies. During the simulation, IMPRINT calculates how much workload each crewmember was experiencing throughout the mission. In this way, you determine whether the crewmembers were overloaded, and if so, how changes can be made to reduce the workload to an acceptable level. Return to Topics
 Purpose of the Operations Model By executing the mission model simulation, you can then study the range of results that occur in the mission. Return to Topics
 Purpose of the Operations Model At the completion of the simulation, IMPRINT can compare the minimum acceptable mission performance time and accuracy to the predicted performance. This will determine whether the mission met its performance requirements. Return to Topics
 Questions answered by the Operations Model • How many people do I need to perform this process within my time constraints? • Is the current task allocation strategy balanced? • What impact will workload and automation have on mission performance time and accuracy? Return to Topics
 Tutorial Topics This tutorial covers the following topics: • Starting IMPRINT Pro • Networks • Operations Model Environment • Resources and Interfaces • Loading an Operations Model • Performance Moderators • Warfighters • Running a Model • Missions • Reports
 Tutorial Topics This tutorial covers the following topics: • Starting IMPRINT Pro • Networks • Operations Model Environment • Resources and Interfaces • Loading an Operations Model • Performance Moderators • Warfighters • Running a Model • Missions To skip to any topic, simply click the corresponding hyperlink. • Reports To return to this topics page at any time during the tutorial, simply click the “Return to Topics” hyperlink located in the lower right-hand corner of your screen: Return to Topics
 Starting IMPRINT Pro Start the IMPRINT Pro application on your system using one of the following two methods: Or. . . 1. Go to your machine’s Start Key, and select Programs IMPRINT Pro. 2. Double-click the IMPRINT Pro icon on your desktop. Return to Topics
 Documentation You may access helpful documentation on IMPRINT Pro using the following two sources: Or. . . 1. Go to your machine’s Start Key, and select Programs IMPRINT Pro Documentation. 2. Using an Explorer window, navigate to the C: Program FilesIMPRINT ProDocumentation directory. Return to Topics
 The Operations Model Environment On startup, the Operations Model environment contains several elements. Additional elements begin to display information as you load an analysis. Title Bar Tool Bar Menu Bar Analysis Tree Window Controls Network Diagram Properties Window Message Bar Output Window Return to Topics
 Getting to know the Operations Model Environment Some elements are hidden on startup until their tab is selected: Search Variable Watches Palette Event Queue Windows Return to Topics
 Studying an Operations Model The Operations model is defined by two main elements: • Warfighters. The pool of available specialties running your system. • Missions. The network of individual tasks and functions comprising the process you choose to model. In order to study these elements, we begin by loading up a sample analysis. Return to Topics
 Loading an Operations Model To see the Operations Model Environment first hand, a folder must first be added to the tree: 1. Right-mouse click the Local Server node. 2. Choose “New Folder”. A new folder appears. The following can be added to any folder: • New Analyses • Library Analyses • Imported Analyses • New Analyses from Maintenance Template • New Analysis from MMF Template Return to Topics
 Loading an Operations Model To see the Operations Model Environment first hand, load a sample library model as follows: 1. Right-mouse click the desired folder. 2. In the shortcut menu which appears, select “Library Analysis. ” 3. In the list that appears, select the “Close Combat Heavy M 1 Abrams Tank” Model. Return to Topics
 Loading an Operations Model The Tank Model appears in the Analysis Tree: The newly added analysis is highlighted to indicate that it is the currently-loaded analysis. The Properties Window displays additional information about this analysis. Return to Topics
 Loading an Operations Model With the Tank Model analysis loaded in the tree, we may begin to view its elements as follows: Click the plus “+” sign next to the analysis name. Note the list of nodes below: The nodes primarily used by the Operations Model are the Warfighters and Missions nodes. We begin with the Warfighters node. Return to Topics
 Warfighters are divided into three categories: Operators Maintainers Supply and Support Personnel Return to Topics
 Understanding Warfighters The Warfighters used by the Operational Model are called Operators. To see a list of Operators in your model, proceed as follows: 1. Click the plus “+” sign next to the Warfighters node to expand it. 2. Note the nodes that appear. 3. Look for the Operators node. Click the plus “+” sign next to the Operators node to expand it. 4. Note the list of Operators that appears. Return to Topics
 Understanding Warfighters Operator data may be viewed as follows: 1. Single-click a listed operator. 2. Its corresponding properties appear in the Properties window. 3. Double-click the same operator to display this same information in the main IMPRINT Pro window. In this example, we see that our driver is a 19 k M 1 Armor Crewman. Return to Topics
 Missions Return to Topics
 Missions are the series of functions and tasks in a process you are attempting to model for a particular weapon system. The following are some examples of missions in the IMPRINT Pro sample model library: “Fly from Assembly Area to Holding Area” Takeoff from Assembly Area (AA) & fly to pickup zone (PZ), 1/2 hour away at flying speed appropriate for conditions. Use contour flight throughout the mission. (UH-60 A Blackhawk Utility Helicopter) “Delay in Sector” Move to firing position (2 km) and occupy that position. After approx. a 15 min wait, threat may appear. All threats are T-72 tanks moving directly at the tank at a range of 1200 -1400 meters in an open field. The tank may be moving (while cond mission). (M 1 ABRAMS Tank) “Destroy Enemy Targets” Prepare weapon and successfully hit 80 percent of targets at ranges of 100 -300 meters. (M 249 SAW) Return to Topics
 Missions A single mission can be broken down into a series of steps (or tasks and functions. ) Below are some examples in the M 1 Abrams Tank Library Model: “Move to Firing Position” “Scan Sector” “Fire While Stationary” “Delay in Sector” “Perform External Communication” Return to Topics
 Missions Functions in your model may be further broken down into a series of tasks: “Move to Firing Position” • Steer Tank • Power Tank • Monitor Instruments “Scan Sector” • Assign Sector Searches • Conduct Surveillance “Fire While Stationary” • Initiate Fire Command • Announce Target “Delay in Sector” • Gunner Fires “Perform External Communication” • Transmit Message • Receive Message Return to Topics
 Understanding Missions To see a list of missions in your model, proceed as follow: 1. Locate the Mission node in the tree. 2. Click the plus “+” sign to expand the mission node. 3. Note the list of missions that appear in the tree. Return to Topics
 Understanding Missions Mission data may be viewed as follows: 1. Single-click a listed mission. 2. Note that its corresponding properties appear in the following three places: a. The title bar at the top displays this mission as the currently-loaded mission. b. The Properties Window displays properties of this mission. You may double-click the same mission to display its property information in the main IMPRINT Pro window as well. c. The network of tasks and functions representing this mission appear under the tab in the main window called Network Diagram. Return to Topics
 Understanding Missions Expand the Mission node. Note that the Mission node contains the following subnodes: 1. Network 2. RI Pairs 3. Macros 4. Variables 5. Snapshots 6. External Events 7. Charts 8. Cultural Templates Return to Topics
 Networks are the series of tasks, functions and goals representing the process you are attempting to model. Return to Topics
 Networks A network and the nodes comprising it are represented in two places in the IMPRINT Pro interface: 1. The Network Node in the Analysis Tree. To view these nodes, click the plus “+” next to the Network node. The list of functions and tasks appears. 2. In the Network Diagram. These nodes are viewable any time you select a mission in the tree. Return to Topics
 Functions and Tasks The highest level in a network is a function. It is represented by a rectangle in the tree and in the network diagram: Functions represent a collection of steps in your process. “Move to Firing Position” Return to Topics
 Functions View a function and its properties as follows: 1. Locate the function in you analysis tree. 2. Click the function to select it. Note the Properties window loads information about your function. 3. Double-click the listed function to view these same properties in the main Pro window. Return to Topics
 Functions contain the following properties: The name of this function is “Move to Firing Position. ” It is part of the “Delay in Sector” mission. It is estimated this function will take an average of 2: 53. 00 to complete. To consider this function a success, it must last 2: 53. 00 or less 85% of the time it fires. An unsuccessful function might raise concerns in the model. Return to Topics
 Functions View a function’s subnodes in the analysis tree as follows: 1. Locate the function in the analysis tree. 2. Click the plus “+” sign next to the function node to expand it. Note the list of nodes (tasks and/or functions) it contains. Note that in this case all the subnodes are tasks. Return to Topics
 Functions View the same subnodes in the Network Diagram as follows: 1. Locate the function in your Network Diagram. 2. Double-click the function in this window. Note the Network Diagram now shows a new tab displaying the subnetwork of tasks and other nodes this function contains. The Network Diagram contains the added benefit of showing how nodes are connected in the network. Return to Topics
 Tasks Specific actions in your model might appear as Tasks are represented by an oval in the tree and in the network diagram. Tasks represent a specific step in the process being modeled. Tasks also represent the Start and End nodes in your model: “Gunner Fires” Return to Topics
 Tasks View a task’s properties as follows: 1. Locate the task in the analysis tree. 2. Click the task to select it. Note the Properties window loads information about your task. 3. Double-click the listed task to view these same properties in the main Pro window. Return to Topics
 Tasks properties are divided into several categories: Time and Accuracy Taxons Effects Paths Failure Consequences Workload Demand Crew Return to Topics
 Time and Accuracy Return to Topics
 Time and Accuracy The Time and Accuracy tab allows you to set values for your task that determine average task time and failure rate. This tab is the first tab from the left in the task description window. Return to Topics
 Time and Accuracy Step 1: Setting the Criterions for Task Time and Accuracy An acceptable time for this task is 22 seconds or less. An acceptable rate of success for this task is 85 Percent Steps Correct or better. If our task meets the time and accuracy requirements simultaneously 80% of the time, our criterion for this task is met. Return to Topics
 Time and Accuracy Step 2: Setting the Task Time Our task time is set to use a Normal distribution (a bell curve). The first step is to set a mean value on which the distribution of values will center. If we set 22. 0 sec as our cutoff, then it is likely that 69. 15% of our times will fall within requirements. Here we set our mean to 19. 0 seconds. By default, the Normal distribution uses a Standard Deviation to set how closely the majority of those values fall near the average (99% usually fall within 3 standard deviations. Return to Topics
 Time and Accuracy Step 2: Setting the Task Time Enter the desired expression in the code box provided. As an alternative to entering task time parameters, the Use Expression option allows you to enter your mean task time in the form of an expression. Your task’s time evaluates at run-time. Return to Topics
 Time and Accuracy Step 3: Setting Task Accuracy We set our cutoff value for accuracy to 85. 0. Any value pulled at random from the distribution which is higher than this number flags the task as successful. Task Accuracy is similar to Task Time. Here again, we use a distribution (default type is “Normal”. ) We set a mean value around which the distribution of accuracies will center. Our Standard Deviation is 1. Three Std dev’s on either side (3 x 1 = 3 units) of the average is where 99% of the accuracy values IMPRINT Pro pulls will range. Therefore 97% of the time our task will be successful (not fail). Return to Topics
 Time and Accuracy To calculate expected accuracy values quickly using the Accuracy Calculator: 1. Locate and click the Accuracy Calculator button in the toolbar. The Accuracy Calculator window appears. 2. Click the radio button of the value you wish to calculate. 3. Enter values in the remaining fields. 4. Click the Calculate button. The calculated value appears in the remaining field. The graphic also updates. In the example above, our initial average accuracy value (90) is less than what is required (92) and a small standard deviation. Therefore it is understandable that this task has a high probability of failing Return to Topics which could lead to mission failure.
 Effects Return to Topics
 Effects The Effects tab lets you set the conditions in which a task fires and the effects on the rest of the model as a result. This tab is the second tab from the left in the task description window. Return to Topics
 Effects The Effects window provides the following information: This task is allowed to start when its Release Condition expression is true. In this example, the task is automatically set to a default of true. Therefore the task will automatically start when the entity passes through it. As a result of this task beginning, a variable called Ongoingtasks is incremented by 1. As a result of this task ending, a variable called Ongoingtasks is decremented by 1. Return to Topics
 Effects For sample code snippets of loops and conditional statements that may be used in the Effects tab, use the Syntax Helper: 1. Locate and click the Syntax Helper button in the toolbar. The Syntax Helper window appears. 2. Click the type of code you wish to view. The code sample appears in the window on the right. This code may be copied and pasted into the Effects window panes. Return to Topics
 Failure Consequences Return to Topics
 Failure Consequences The Failure Consequences tab allows you to determine what happens next in the model should the task fail its accuracy criterion. This tab is the third tab from the left in the task description window. Return to Topics
 Failure Consequences The Failure Consequences tab provides the following options: If the Gunner fails to acquire the target, a following task (Tank Commander giving the command to fire) will take longer (30%), and its chances of failing are also increased (10%). There is a 5% chance the target will be announced again. If this task fails, there is a 5% chance entire mission aborts. 23% of the time, the task failure has no effect on the entire mission whatsoever. 7% of the time, this task failure will cause the Tank Commander to take over the task of acquiring the target. 50% of the time, the Gunner will make a repeat attempt to acquire the target. Any combination of consequences must add up to 100%. Return to Topics
 Crew Return to Topics
 Crew The Crew Tab allows you to assign primary and contingency operators for your task. This tab is the fourth tab from the left in the task description window. Return to Topics
 Crew By default, each task’s Crew tab displays the existing Operator Warfighters. This tank mission contains the following Operators available for crew assignment: “Loader” “Driver” The Gunner is set to be the operator for this task. “Gunner” “Tank Commander” Return to Topics
 Crew In the example below, the Gunner is the primary operator for the task. Contingency operators (backups) for this task may be set as follows: 1. Choose the operator you wish to set as a contingency operator. 2. Click the Assignment cell of this operator. A dropdown arrow appears. 3. Click the drop-down arrow. A list of options appears. 4. Select the Contingency Option. The operator designation appears in the field. In this example, if the Gunner (Primary) is ever overloaded, the Tank Commander (Contingency) will assist in the manner designated on the Gunner’s Warfighter page.
 Crew If the Gunner is ever overloaded, the Tank Commander will assist by taking on the Gunner’s new tasks according to the Gunner’s Warfighter/Operator page.
 Taxons Return to Topics
 Taxons describe your task type and are the link between PTS (personnel, training and stressor) settings and task performance. This tab is the fifth tab from the left in the task description window. Return to Topics
 Taxons Use the Taxons tab as follows: 1. Note that the Taxons tab has four different categories of workload. Look for the category that relates to your task. 2. Under that category, check the box of the workload description that applies. Our task of acquiring a target consists of Visual Recognition/ Discrimination. Enter the value of the taxon weight. The sum of all taxon weights for a task must be 1. 0. Since our task can be described using only the visual recognition taxon, we will set the entire taxon weight (1. 0) on the Visual component. Click outside the fields to update the Total Weight field. Return to Topics
 Taxons Use the Taxons tab as follows: To do the same for ALL tasks at once, click the Map Workload to Taxons option under the Moderators menu. For tasks with workload demand already assigned, click the Map Workload Values button to automatically assign taxons for this particular task. Return to Topics
 Paths Return to Topics
 Paths The Paths tab allows you to set network diagram branching Logic. This tab is the sixth tab from the left in the task description window. Return to Topics
 Paths In IMPRINT Pro, there are three different types of path logic that can connect one task to another. The type of path chosen affects the options available in the paths tab: 1. Multiple All paths are taken each time. (true) (false) 2. Tactical The path evaluating to True (or first path drawn if both evalulate to true) is taken. 25% 3. Probabilistic 75% The path taken depends on probability. Return to Topics
 Multiple Path Multiple path logic allows two branched tasks to occur simultaneously: The Multiple path branching logic is set by choosing the Multiple option in the Decision Type field. When set to Multiple, each branch displays a code box. When the code evaluates to true, the path is taken. By default, all paths are set to return true. In our example of the Fire While Moving function, the Driver will Steer the tank and Power the tank simultaneously if the conditions for both paths return true. The decision diamond on the original task displays an “M” to indicate Multiple. Return to Topics
 Tactical Path Tactical path logic permits one path to be taken based on evaluation: The Tactical path branching logic is set by choosing the Tactical option in the Decision Type field. When set to Tactical, each branch displays a code box. The path whose expression evaluates true (or highest) is taken. If two paths evaluate true (or highest), the path drawn first is taken. In our example of the Driver Steering and Powering the tank simultaneously, we can add a Tactical decision node for whether the driver decides to steer left, right or straight. The decision diamond on the original task displays an “T” to indicate Tactical. Return to Topics
 Probabilistic Path Probabilistic path logic allows one of several possible tasks to occur: The Probabilistic path branching logic is set by choosing the Probabilistic option in the Decision Type field. When set to Probabilistic , each branch displays a probability box. The number entered in this box determines the probability that this path will be taken. Only one path will ever be taken at a time. In our example of the Performing External Communications function, there is an equal probability that at any point in time either the Tank Commander or the Loader will be transmitting or receiving a message. But since we assume only one radio, only one of these actions will ever be taking place at a time. The decision diamond on the original task displays an “P” to indicate Probabilistic. Return to Topics
 Workload Demand Return to Topics
 Workload Demand The Workload Demand tab allows you to set the workload levels by channel for each task in your network. This tab is the seventh and final tab in the task description window. Return to Topics
 Workload Demand In order to set workload across the different channels of a task, you must first choose the interfaces where workload applies. This is done through the Interfaces tab, located on the left-most side of the window. Check the boxes of the Interfaces that will be used during the selected task. Return to Topics
 Workload Demand Next, click the Values tab. For each channel listed by row, enter a workload demand value appropriate to the task. You may manually enter workload demand values for any combination of resourceinterface (RI) pairs. These are also called “channels”. For any selected channel, click the Auto button (“. . . ”) to see a list of predefined workload amounts from which to choose. Note: prior to entering demand values, you must first define workload channels. This will be covered in the next section of this tutorial. Return to Topics
 Workload Demand is defined in four steps: Resources Interfaces Defining Resources and Interfaces Defining Resource-Interface Pairs (also known as “Channels”. ) “Throttles/ Fine Motor” “Instrument Panel/Visual” Assigning Conflict Values 0. 7 Assigning Workload Demand 5. 8 3. 0 Return to Topics
 Defining Resources and Interfaces Resources are the abilities the operator has to be able to operate one or more interfaces. Resources include: Auditory Motor Categories: Tactile Cognitive Speech Visual Fine Motor Gross Motor Return to Topics
 Defining Resources and Interfaces are the controls used by the Operator to perform the task. The Interface list includes the default “Crewstation”, but you may add as many different interfaces as you wish. Crewstation Instrument Panel Throttles Return to Topics
 Defining Resources and Interfaces Resources may be viewed as follows: 1. Locate the RI Pairs node in the tree. 2. Click the plus “+” sign next to the node to expand it. 3. In the Resources node which lists below, click the plus “+” sign next to the node to expand it. Note the Resources which list underneath. Return to Topics
 Defining Resources and Interfaces may be viewed as follows: 1. Locate the RI Pairs node in the tree. 2. Click the plus “+” sign next to the node to expand it. 3. In the Interfaces node which lists below, click the plus “+” sign next to the node to expand it. Note the Interfaces which list underneath. Return to Topics
 Defining Resources and Interfaces may be viewed as follows: 1. Locate the RI Pairs node in the tree. 2. Click the plus “+” sign next to the node to expand it. 3. In the Interfaces node which lists below, click the plus “+” sign next to the node to expand it. Note the default interface “Crew. Station” included with this mission. Return to Topics
 Defining Resource-Interface Pairs (Channels) Resource-Interface Channels are defined as follows: 1. Locate the RI Pairs node in the Analysis Tree. 2. Double-click this node A new R-I Pairs tab appears in the main IMPRINT Pro window. 3. Interfaces list along the rows on the left. Resources list along the columns. A check in the box indicates a channel defined by the pair. Return to Topics
 Defining Resource-Interface Pairs (Conflicts) Resource-Interface Conflicts are defined as follows: 1. In the same RI Pairs tab where the Channels tab is located, click the Conflicts tab. 2. The Conflict Matrix displays. 3. Select the cell corresponding to the two conflicting channel pairs. 4. Enter the desired conflict value. Alternatively, you may select a row and click “Auto” for access to automatic conflict values. Return to Topics
 Performance Moderators Return to Topics
 Performance Moderators: Personnel Characteristics, Training and Stressors (PTS) Performance Moderators, also known as PTS, allow you to factor personnel, environmental and training conditions in your model. These conditions may affect your task times or accuracies, depending on the taxons that you have assigned to the tasks. Return to Topics
 Performance Moderators (PTS) Performance Moderators are divided into three categories: 1. Personnel (P) What specialties will be assigned to my system and how will their aptitudes affect performance? 2. Training (T) How often have available operators practiced their tasks? 3. Stressors (S) What are the environmental conditions in which my system will have to operate? Return to Topics
 Performance Moderators (PTS) Once you have finished entering all of your tasks, you may apply Performance Moderators using the following three steps: 1. Set the performance moderator values. 2. Review the effects of your moderators. 3. Check the PTS option in the execution settings page to make sure that the performance effects are included when your model executes. Return to Topics
 Personnel Return to Topics
 Personnel (P) Modify the personnel in your model using the following steps: 1. Select the Moderators menu. 2. Select the Settings submenu. 3. Select the Personnel option. 4. The Personnel Characteristics dialog box displays. Return to Topics
 Personnel (P) Next, click the Mission tab, and then modify the ASVAB Composite and Cutoff for each Warfighter as in the following example: 1. The 19 K Gunner begins with an ASVAB cutoff of 87. 2. Select the cell whose value you wish to change. 3. Type in the desired value. 4. The new value displays in the cell. In the example above, we have increased the requirements of our 19 K operator. A more skilled operator might be harder to locate but might finish the task more quickly if available. Return to Topics
 Training Return to Topics
 Training (T) Modify the training frequency in your model using the following steps: 1. Select the Moderators menu. 2. Select the Settings submenu. 3. Select the Training option. 4. The Training dialog box displays. Return to Topics
 Training (T) Next, click the Mission tab and select the training frequency for each Warfighter by using drop-down menus: 1. The 19 K Gunner begins with a training frequency of once per month. 2. Click the cell to see the dropdown arrow. 3. Click the arrow to display additional values to choose from. 4. Select a new value from the list. In the example above, we have increased the training frequency of our 19 K operator. A more recently trained operator might be harder to locate but might finish the task more quickly if available. 5. The new value displays in the cell. Return to Topics
 Stressors (S) Return to Topics
 Stressors (S) The following types of stressors may be applied to your tasks: Cold (°F, °C) MOPP Level Wind (knots) Heat (°F, °C) Sleepless Hours Humidity (%) User-defined stressors Noise (distance in ft) (Example: Vibration) Noise (decibels) Return to Topics
 Stressors (S) Modify the stressors in your model using the following steps: 1. Select the Moderators menu. 2. Select the Settings submenu. 3. Select the Stressors option. 4. The Stressors dialog box displays. Return to Topics
 Stressors (S) Next, click the Mission tab and select the stressors for each Warfighter by using drop-down menus: 1. The task of adjust and repair of the cannon tube begins in a temperatureneutral environment. 2. Click the cell to see the dropdown arrow. 3. Click the arrow to display additional values to choose from. 4. Select a new value from the list. In the example above, we have decreased the temperature for our 19 K operator. A colder environment might cause some tasks to take longer. 5. The new value displays in the cell. Return to Topics
 Reviewing Moderator Effects With moderators now in place, review the before and after effects on task times and accuracies as follows: 1. Select the Moderators menu. 2. Select the Results. . . Option. 3. The PTS Results window appears. Return to Topics
 Reviewing Moderator Effects Review the before and after effects from your moderators as follows: 1. Scroll down and locate the desired task. 2. Scroll to the right until you see the Time columns. 3. In the upper righthand corner of the window, check the stressors option (to apply the cold temperatures), and then click Apply. 4. Note the Adjusted time. Return to Topics
 Checking the PTS Option The last step in applying PTS to your model occurs when you are ready to run your model. Locate the option as follows: 1. Select the Execution menu. 2. Select the Settings Option. 3. The Execution Settings window appears. 4. Look for the PTS Adjustments checkbox on the right-hand side of this window. 5. Check the PTS Adjustments checkbox to apply PTS moderators to your model at run-time. Return to Topics
 Running a Model Running a model (operational mission) generates report data which may then be studied to find out how well your system performs the mission you have described. You may run your IMPRINT operations model at any point during the development of your model. Return to Topics
 Running a Model Running a model entails the following steps: 1. Checking the Execution Settings page 2. Setting the Simulation Speed 3. Checking for Errors 4. Begin Simulation Return to Topics
 Execution Settings The Execution Settings page provides options for running your model. Access the Execution Settings page follows: 1. Locate the Execution Menu. 2. Select the Settings option. 3. The Execution Settings page appears. Return to Topics
 Execution Settings The Execution Settings window provides the following options for running your model: Enter the number of times you wish to run the mission. Specify a random number seed to increase variability in your task times between model runs. If you created Cultural Templates for your model, you may choose the template to use in the model run by selecting from the drop-down list. The currently-selected mission appears in the Operations Model box. This is the model selected for running. Check the PTS Adjustments option if you wish to use task times that account for personnel, training and stressor moderators. Check the Perfect Accuracy option to override any possibility of task failure (i. e. , all tasks are successful during the model run. ) Check the Workload Strategies option to enable the Warfighter strategies when the operator is overloaded with workload. Return to Topics
 Simulation Speed The speed of your simulation may be changed in two locations: 1. Locate the Execution menu, and then select the Simulation Speed option. In the list provided, select a new speed. 2. Locate the Simulation Speed icon on the toolbar, and select a new speed. Return to Topics
 Checking for Errors The Check for Errors option sweeps through your model to look for errors in any fields that may be altered. Use this option as follows: Click the Check for Errors option (the check mark on the tool bar. ) The check reports in the Output window any information about errors encountered in the model. In this example our model contained no errors. Note: In the event the Output window does report an error, doubleclick the error in the Output window for more information. Return to Topics
 Begin Simulation When you run your operations model, the stochastic simulation engine will use the distributions of times and accuracies you entered at the task level along with your workload estimates and PTS information to generate a predicted performance for your mission. Return to Topics
 Begin Simulation You may start the run of your model in two locations: 1. Locate the Execution menu, and then select the Begin Simulation option. Or. . . 2. Locate and select the Begin Simulation icon on the tool bar. Return to Topics
 Begin Simulation As the model runs, the following IMPRINT Pro displays update: Nodes in the Network Diagram highlight. Task execution data displays in the output window (Display Trace option “On”. ) Return to Topics
 Begin Simulation The Output window indicates when the model is finished running. Running the Delay in Sector Mission takes approximately 117. 0 seconds to run on our machine (with Display Trace set to “On”) and 2227 hours to run in simulation clock time. Return to Topics
 Reports Return to Topics
 Reports IMPRINT Pro provides 16 different reports for viewing your maintenance scenario data. Report presentations include: Textual Summary and Detail Data Charted Data Return to Topics
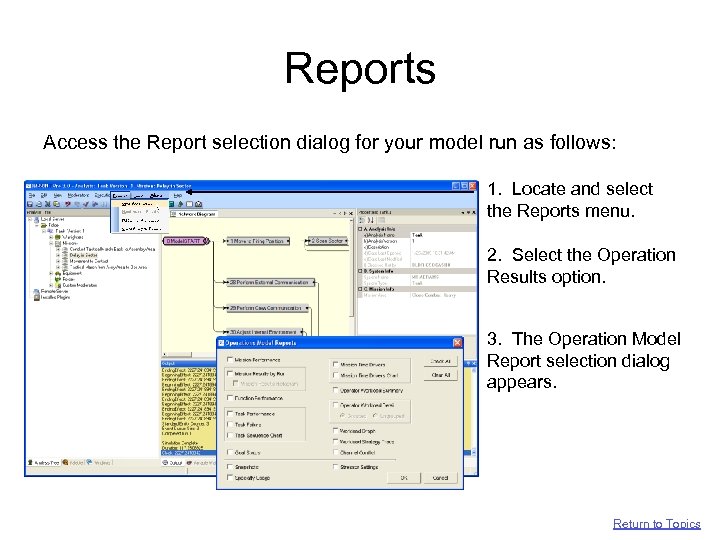 Reports Access the Report selection dialog for your model run as follows: 1. Locate and select the Reports menu. 2. Select the Operation Results option. 3. The Operation Model Report selection dialog appears. Return to Topics
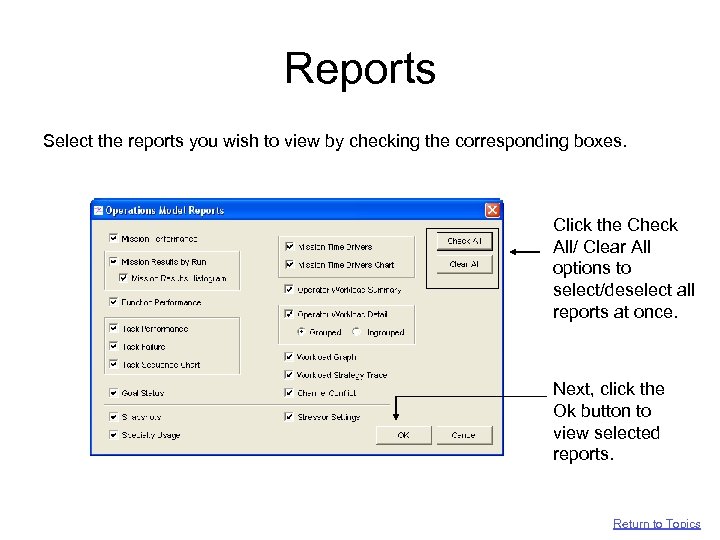 Reports Select the reports you wish to view by checking the corresponding boxes. Click the Check All/ Clear All options to select/deselect all reports at once. Next, click the Ok button to view selected reports. Return to Topics
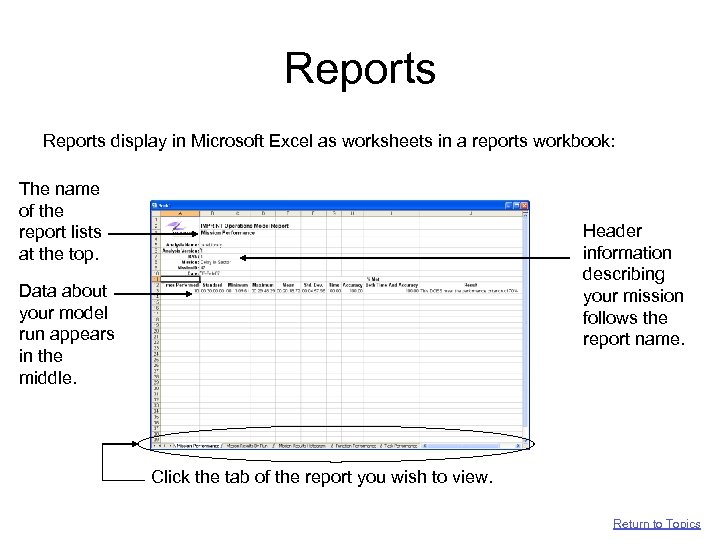 Reports display in Microsoft Excel as worksheets in a reports workbook: The name of the report lists at the top. Header information describing your mission follows the report name. Data about your model run appears in the middle. Click the tab of the report you wish to view. Return to Topics
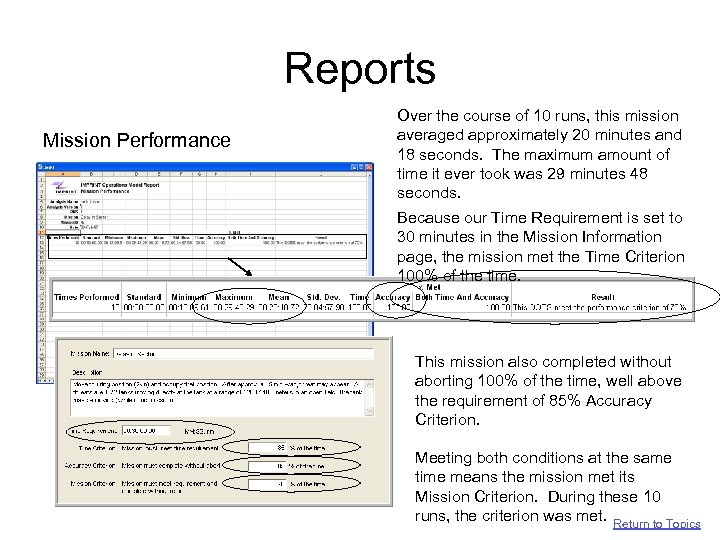 Reports Mission Performance Over the course of 10 runs, this mission averaged approximately 20 minutes and 18 seconds. The maximum amount of time it ever took was 29 minutes 48 seconds. Because our Time Requirement is set to 30 minutes in the Mission Information page, the mission met the Time Criterion 100% of the time. This mission also completed without aborting 100% of the time, well above the requirement of 85% Accuracy Criterion. Meeting both conditions at the same time means the mission met its Mission Criterion. During these 10 runs, the criterion was met. Return to Topics
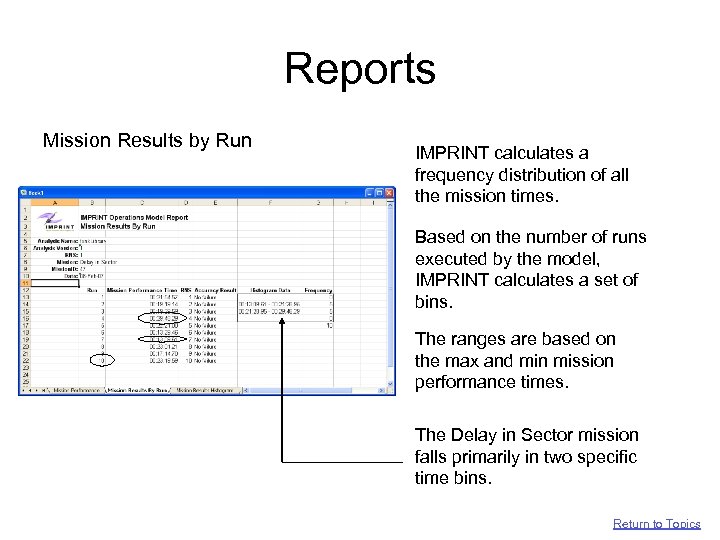 Reports Mission Results by Run IMPRINT calculates a frequency distribution of all the mission times. Based on the number of runs executed by the model, IMPRINT calculates a set of bins. The ranges are based on the max and min mission performance times. The Delay in Sector mission falls primarily in two specific time bins. Return to Topics
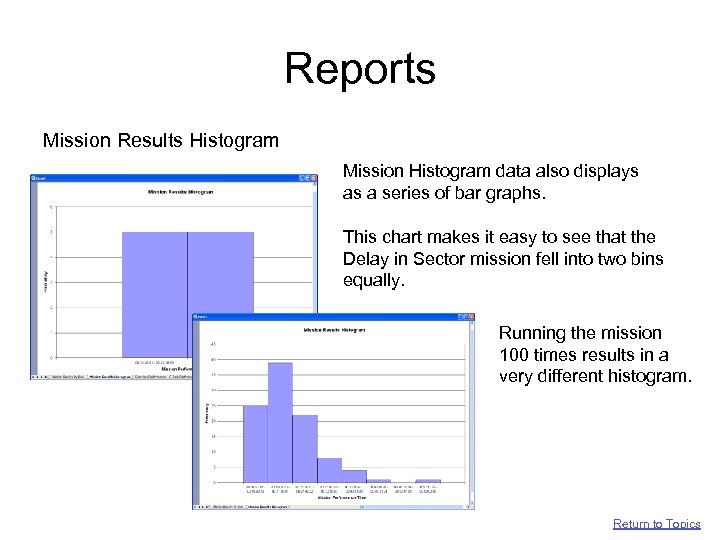 Reports Mission Results Histogram Mission Histogram data also displays as a series of bar graphs. This chart makes it easy to see that the Delay in Sector mission fell into two bins equally. Running the mission 100 times results in a very different histogram. Return to Topics
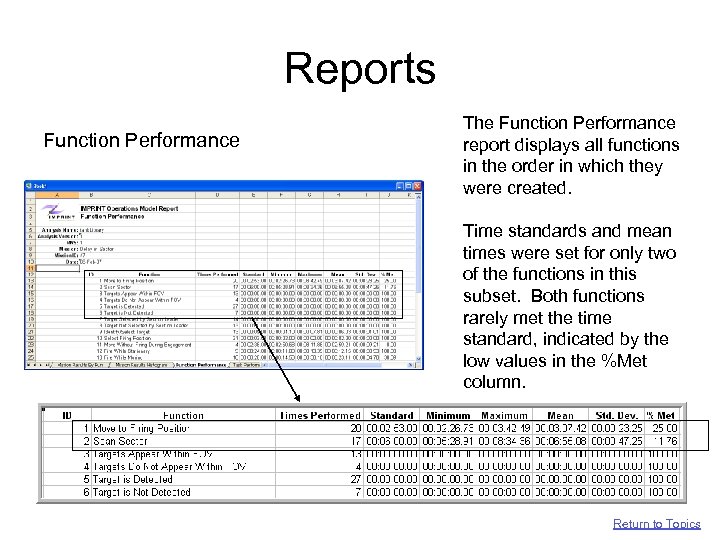 Reports Function Performance The Function Performance report displays all functions in the order in which they were created. Time standards and mean times were set for only two of the functions in this subset. Both functions rarely met the time standard, indicated by the low values in the %Met column. Return to Topics
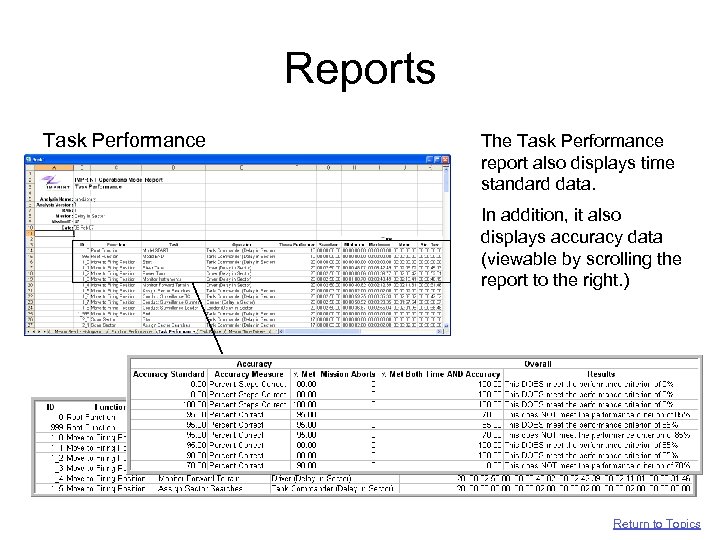 Reports Task Performance The Task Performance report also displays time standard data. In addition, it also displays accuracy data (viewable by scrolling the report to the right. ) Return to Topics
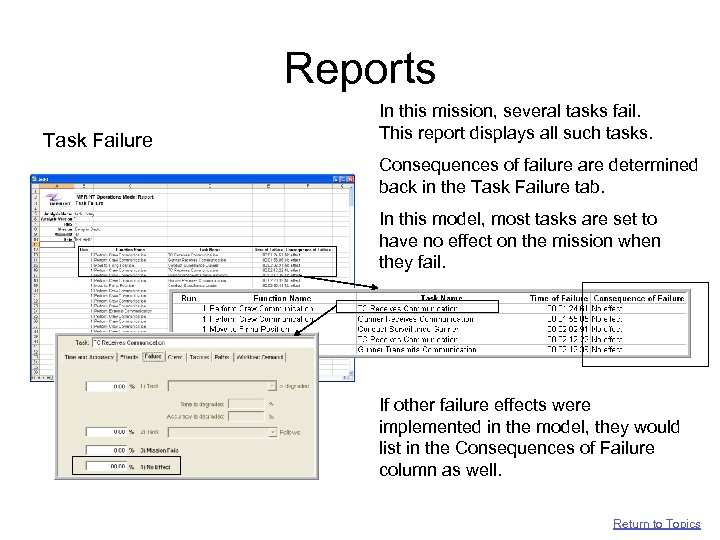 Reports Task Failure In this mission, several tasks fail. This report displays all such tasks. Consequences of failure are determined back in the Task Failure tab. In this model, most tasks are set to have no effect on the mission when they fail. If other failure effects were implemented in the model, they would list in the Consequences of Failure column as well. Return to Topics
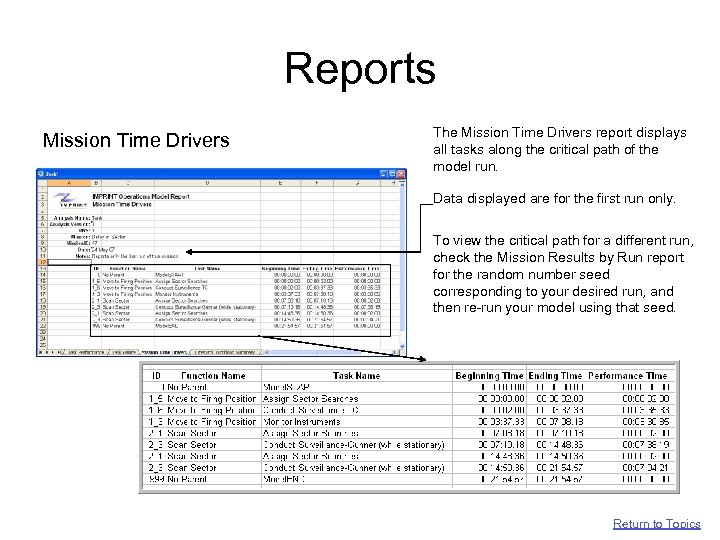 Reports Mission Time Drivers The Mission Time Drivers report displays all tasks along the critical path of the model run. Data displayed are for the first run only. To view the critical path for a different run, check the Mission Results by Run report for the random number seed corresponding to your desired run, and then re-run your model using that seed. Return to Topics
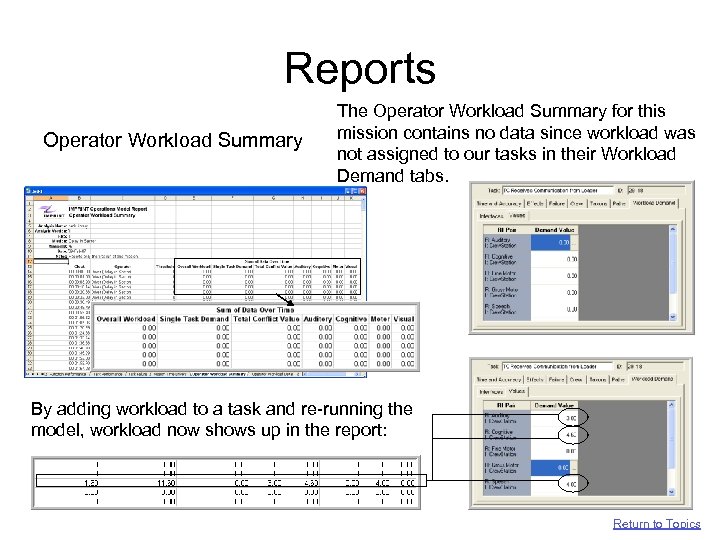 Reports Operator Workload Summary The Operator Workload Summary for this mission contains no data since workload was not assigned to our tasks in their Workload Demand tabs. By adding workload to a task and re-running the model, workload now shows up in the report: Return to Topics
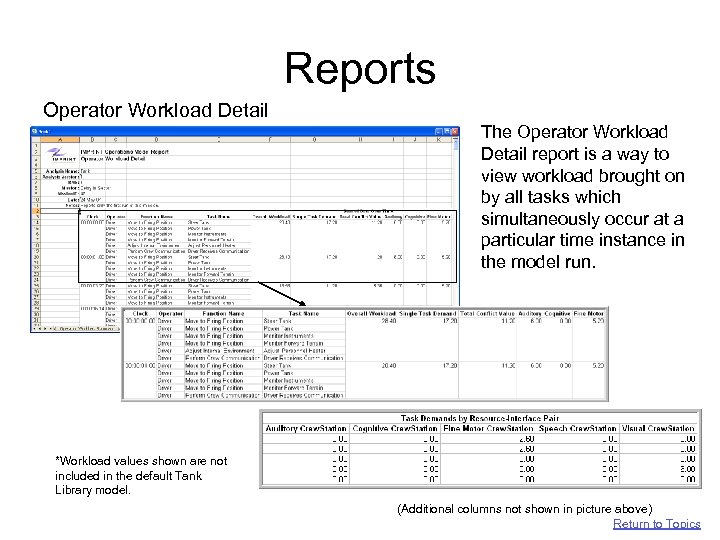 Reports Operator Workload Detail The Operator Workload Detail report is a way to view workload brought on by all tasks which simultaneously occur at a particular time instance in the model run. *Workload values shown are not included in the default Tank Library model. (Additional columns not shown in picture above) Return to Topics
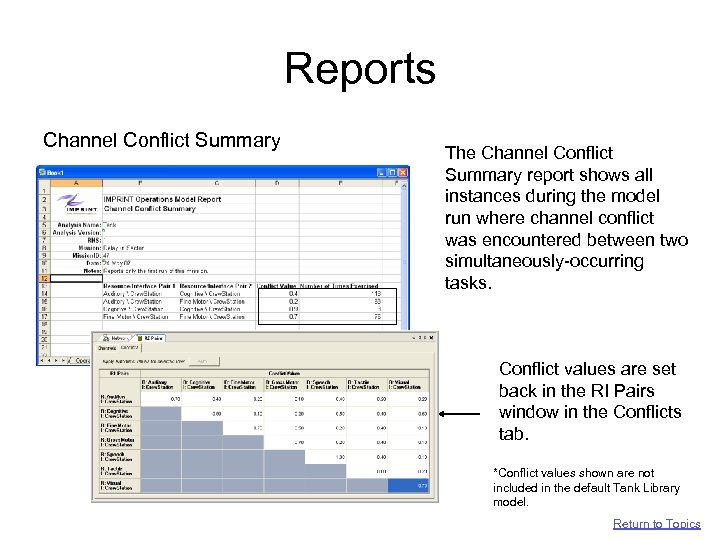 Reports Channel Conflict Summary The Channel Conflict Summary report shows all instances during the model run where channel conflict was encountered between two simultaneously-occurring tasks. Conflict values are set back in the RI Pairs window in the Conflicts tab. *Conflict values shown are not included in the default Tank Library model. Return to Topics
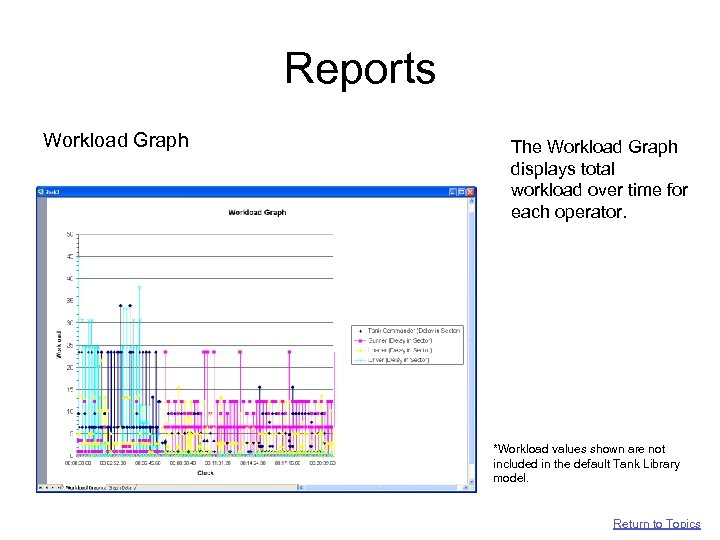 Reports Workload Graph The Workload Graph displays total workload over time for each operator. *Workload values shown are not included in the default Tank Library model. Return to Topics
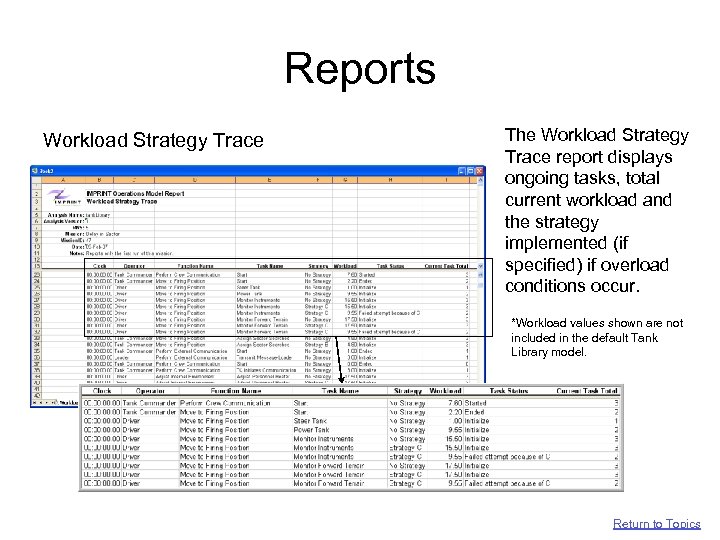 Reports Workload Strategy Trace The Workload Strategy Trace report displays ongoing tasks, total current workload and the strategy implemented (if specified) if overload conditions occur. *Workload values shown are not included in the default Tank Library model. Return to Topics
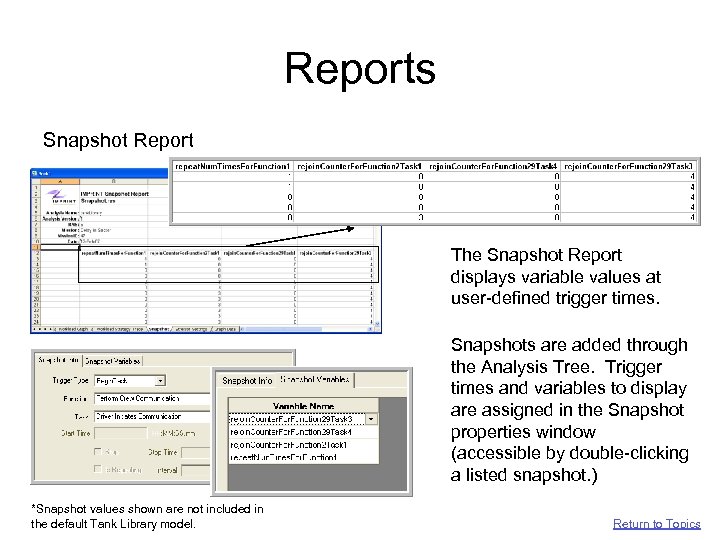 Reports Snapshot Report The Snapshot Report displays variable values at user-defined trigger times. Snapshots are added through the Analysis Tree. Trigger times and variables to display are assigned in the Snapshot properties window (accessible by double-clicking a listed snapshot. ) *Snapshot values shown are not included in the default Tank Library model. Return to Topics
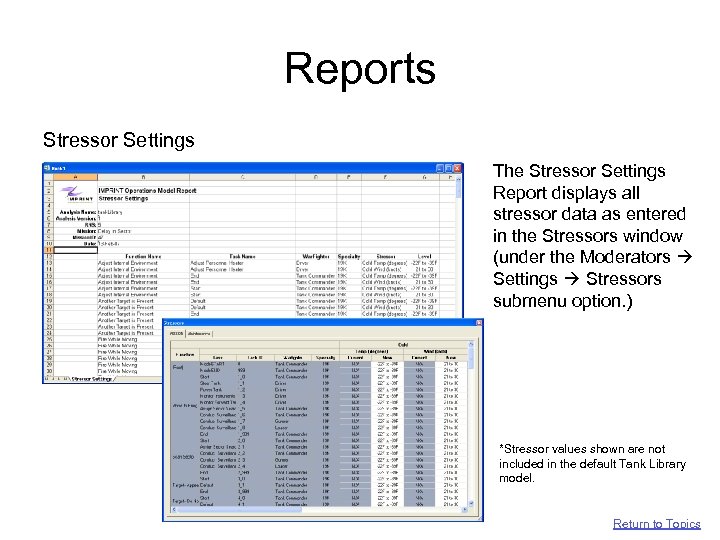 Reports Stressor Settings The Stressor Settings Report displays all stressor data as entered in the Stressors window (under the Moderators Settings Stressors submenu option. ) *Stressor values shown are not included in the default Tank Library model. Return to Topics
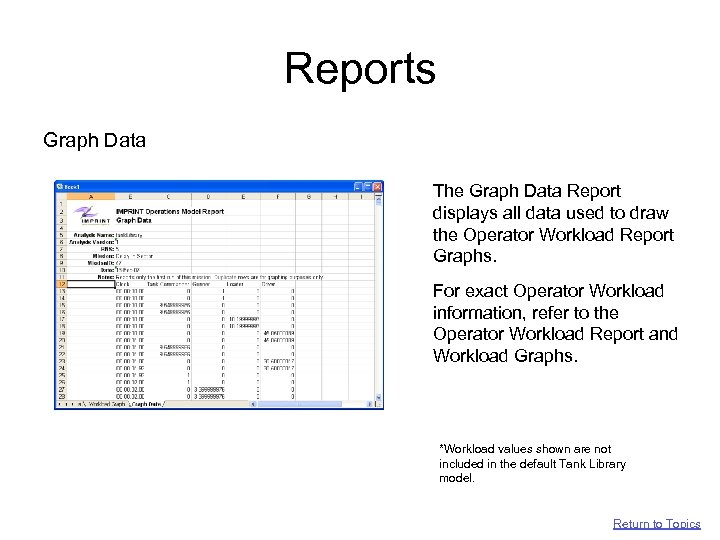 Reports Graph Data The Graph Data Report displays all data used to draw the Operator Workload Report Graphs. For exact Operator Workload information, refer to the Operator Workload Report and Workload Graphs. *Workload values shown are not included in the default Tank Library model. Return to Topics
 Additional Resources For more information on creating IMPRINT Pro analyses, see the following resources located in the IMPRINT Pro/Documentation folder: User Manuals: • IMPRINT Pro Volume 1: Basic Procedures • IMPRINT Pro Volume 2: Developing Analyses • IMPRINT Pro Volume 3: Syntax Reference Quick Start Guides/Flowcharts: • IMPRINT Pro QSG - Operations Model. pdf • IMPRINT Pro QSG - Maintenance Model. pdf For more information on IMPRINT Pro: imprint-info@arl. army. mil Return to Topics


