a266db4c805b15164ded0adba363180b.ppt
- Количество слайдов: 120


Operations Management BUSN 6110/PROC 5820
: Course Introduction Mar 19 – No")
Syllabus • • • Class 1 (Mar 12): Course Introduction Mar 19 – No Class 2: (Mar 26) chap 1; chap 2, case study, chap 5 Class 3: (Apr 2) Chap 6 ( thru 243), chap 7; chap 9 (Take home exam) Class 4: (Apr 9) Class 5: (Apr 16) chap 6 (243 -250); chap 12, case study Class 6: (Apr 23) chap 10, chap 11 Class 7: (Apr 30) chap 6 (243 -250); chap 12, case study Class 8: (May 7) Reverse Logistics – need “The Forklifts Have Nothing To Do!” Available in the Lewis and Clark Bookstore; chap 14; chap 16; Supply Chain Security Class 9: (May 14) Chap 13; Chap 3 Other requirement: →visit Harley-Davidson Plant in Kansas City to see operations management in practice and write a 3 -5 page paper comparing the class slides and readings to the Harley operations

Grades • • • Class Participation – 10% Mid Term – 35% Final Exam – 35% Harley Paper – 10% Presentation – 10%
 447 -3651 Personal background")
Contact Information • • • joewalden@supplychainresearch. com (760) 447 -3651 Personal background

Class Slides and Information • www. supplychainresearch. com • Slides will be posted/updated week prior to class – therefore the slides currently on the website may change as new materials come available

Chapter 1 Introduction to Operations Management

The Operations Function ü Operations as a transformation process ü Operations as a basic function ü Operations as the technical core

Operations as a Transformation Process INPUT Material Machines Labor Management Capital

Operations as a Transformation Process INPUT Material Machines Labor Management Capital TRANSFORMATION PROCESS

Operations as a Transformation Process INPUT Material Machines Labor Management Capital TRANSFORMATION PROCESS OUTPUT Goods Services

Operations as a Transformation Process INPUT Material Machines Labor Management Capital TRANSFORMATION PROCESS Feedback OUTPUT Goods Services
 ü Locational (transportation/ warehouse) ü Exchange (retail) ü Physiological")
Transformation Processes ü Physical (manufacturing) ü Locational (transportation/ warehouse) ü Exchange (retail) ü Physiological (health care) ü Psychological (entertainment) ü Informational (communications)

Operations as the Technical Core Finance/Accounting Suppliers Budgets Cost analysis Capital investments Stockholder requirements Operations Material availability Quality data Delivery schedules Designs Personnel needs Skill sets Performance evaluations Job design/work measurement Product/Service Availability Lead-time estimates Status of order Delivery schedules Hiring/firing Training Legal requirements Union contract negotiations Human Resources Sales forecasts Customer orders Customer feedback Promotions Marketing Production and Inventory data Capital budgeting requests Capacity expansion and Orders for materials Technology plans Production and delivery Schedules Quality Requirements Design/ Performance specs

Impacts on Operations Management ü Industrial Revolution ü Scientific Management ü Human Relations or the lack thereof ü Advent of Management Science ü Quality Emphasis ü Globalization of Supply Chains ü Information Age/Internet Revolution

Key Events Industrial Revolution Steam engine 1769 James Watt Division of labor 1776 Adam Smith Interchangeable parts 1790 Eli Whitney Scientific Management Principles Frederick W. Taylor 1911 Activity scheduling chart Henry Gantt 1912 Moving assembly line Henry Ford 1913

Key Events Human Relations Hawthorne studies 1930 Elton Mayo Motivation theories 1940 s Abraham Maslow 1950 s Frederick Hertzberg 1960 s Douglas Mc. Gregor Management Science Linear programming 1947 George Dantzig Digital computer 1951 Remington Rand Simulation, PERT/CPM, 1950 s Operations research Waiting line theory groups MRP 1960 s Joseph Orlicky, IBM

Key Events Quality Emphasis JIT 1970 s Taiichi Ohno, Toyota TQM 1980 s W. Edwards Deming, Joseph Juran, et. al. Strategy and operations Skinner, Hayes Reengineering 1990 s Hammer, Champy World Trade Organization 1990 s Numerous countries and companies Globalization European Union and 1970 s IBM and others other trade agreements EDI, EFT, CIM 1980 s

Key Events Information Age/ Internet Revolution Internet, WWW, ERP 1990 s Supply chain SAP, i 2 management, Technologies, ORACLE, E-commerce People. Soft, Amazon, Yahoo, e. Bay, and others

Categories of E-Commerce Business Consumer Business B 2 B Commerceone. com B 2 C Amazon. com Consumer C 2 B Priceline. com C 2 C e. Bay. com
 Traditional Value Chain Manufacturer Wholesaler/ distributor Retailer Consumer")
A New Value Chain (a) Traditional Value Chain Manufacturer Wholesaler/ distributor Retailer Consumer
 Traditional Value Chain Manufacturer Wholesaler/ distributor Retailer Consumer (b)")
A New Value Chain (a) Traditional Value Chain Manufacturer Wholesaler/ distributor Retailer Consumer (b) Intermediaries Eliminated (Deintermediation) Manufacturer Wholesaler/ distributor Retailer Consumer
 Traditional Value Chain Manufacturer Wholesaler/ distributor Retailer Consumer (b)")
A New Value Chain (a) Traditional Value Chain Manufacturer Wholesaler/ distributor Retailer Consumer (b) Intermediaries Eliminated (Deintermediation) Manufacturer Wholesaler/ distributor Retailer Consumer (b) New Intermediaries Introduced (Reintermediation) Manufacturer Infomediary E-Retailer Aggregator Portal Consumer
")
An Integrated Value Chain Customer Manufacturer Supplier Flow of information (customer order)
 Flow of")
An Integrated Value Chain Customer Manufacturer Supplier Flow of information (customer order) Flow of product (order fulfillment)
 Electronic Storefront Sellers (b) Seller’s")
Types of B 2 B Transactions Buyer Seller (a) Electronic Storefront Sellers (b) Seller’s Auction Buyers Sellers Buyer (c) Buyer’s Auction (d) Exchange or E-Marketplace

E-Business Promotes: ü Better customer relations ü More efficient processes ü Lower cost of materials ü Information technology synergy ü Better and faster decision making

E-Business Promotes: ü New forms of organizations ü Expanded supply chain ü Higher customer expectations ü New ways of doing business ü Globalization

Globalization and Competitiveness • Favorable cost • Access to international markets • Response to changes in demand • Reliable sources of supply • 14 major trade agreements in 1990 s • Peak: 26% in 2000 Copyright, 2006, John Wiley and Sons World Trade Compared to World GDP Source: “Real GDP and Trade Growth of OECD Countries, 2001– 03, ” International Trade Statistics 2003, World Trade Organization, www. wto. org
 Germany: $26. 18 USA: $21. 33 Taiwan: $5. 41")
Globalization and Competitiveness (cont. ) Germany: $26. 18 USA: $21. 33 Taiwan: $5. 41 Mexico: $2. 38 Hourly Wage Rates for Selected Countries Source: “International Comparisons of Hourly Compensation Costs for Production Workers in Manufacturing, ” Bureau of Labor Statistics, U. S. Department of Labor, Updated September 30, 2003. Copyright, 2006, John Wiley and Sons China: $0. 50

Multinational Corporations Company Nestlé Nokia Philips Bayer ABB SAP Exxon Mobil Royal Dutch/Shell IBM Mc. Donald’s Country of Origin Foreign Sales as % of Total Switzerland Finland Netherlands Germany United States Netherlands United States 98. 2 97. 6 94. 0 89. 8 87. 2 80. 0 79. 6 73. 3 62. 7 61. 5

Competitiveness The degree to which a nation can produce goods and services that meet the test of international markets while simultaneously maintaining or expanding the real incomes of its citizens.

Productivity Output Productivity = Input

Productivity Output Productivity = Input Productivity improves when firms: ü Become more efficient ü Downsize ü Expand ü Retrench ü Achieve breakthroughs

Changes in Productivity for Select Countries Internet-enabled productivity - Dot com bust - 9/11 terrorist attacks Source: “International Comparisons of Manufacturing Productivity and Unit Labor Cost Trends, 2002, ” Bureau of Labor Statistics, U. S. Department of Labor, September 2003. U. S. figures for 2002– 2003 from “Major Sector Productivity and Costs Index, ” Bureau of Labor Statistics, U. S. Department of Labor, March 2004 Copyright, 2006, John Wiley and Sons
 growth ü Market capitalization")
Measures of Competitiveness ü Productivity ü GDP (Gross domestic product) growth ü Market capitalization ü Technological infrastructure ü Quality of education ü Efficiency of government

Barriers to Entry ü Economies of scale ü Capital investment ü Access to supply and distribution channels ü Learning curves

Competition Within Industries Increases When ü Firms are relatively equal in size and resources ü Products and services are standardized ü Industry growth is slow or exponential

Primary Topics in Operations Management ü Strategy ü Products and services ü Processes and technologies ü Facilities ü Project management ü Managing the supply chain ü Forecasting demand for products and services ü Production planning and scheduling ü Ensuring quality

Chapter 2 Operations Strategy To Accompany Russell and Taylor, Operations Management, 4 th Edition, 2003 Prentice-Hall, Inc. All rights reserved.

Chapter 2 • • • Vision/Missions Strategy METL and Goals/Mission Competition Strategy and the Internet Products and Services Strategy Deployment Balanced Scorecard Decision Making Tools and the MDMP

The Importance of Clearly Stated Missions/Visions ‘The Grand Duke said “one who is confused in purpose cannot respond to his enemy” Sun Tzu, The Art of War (III. 23) • To know the purpose – there must be a clearly stated mission and vision.

Clearly Stated Mission? ? ? “When you come to a fork in the road, take it. ”

Example of A Clearly Understood Mission COL Rusling on General Grant: “He made certain his subordinates knew exactly what he wanted, and why and when he wanted it. ”

Example of A Clearly Understood Mission “We endeavor to go to the moon and return safely before the end of this decade. ” - John F. Kennedy

VISION® • Vital to the Organization • Integrated throughout the Organization • Sustainable and Achievable • Important from the viewpoint of the employees • Organization Goals • Not necessarily a one size fits all vision Velocity Management in Logistics and Distribution, 2005, Walden

Strategy Formulation • Define a primary task • Assess core competencies • Determine order winners & order qualifiers • Positioning the firm

Core Competencies • Also known as core capabilities • Skills that differentiate the service or manufacturing firm from competitors • Those things that the company does best

Strategy Formulation • Define a primary task • Assess core competencies • Determine order winners & order qualifiers • Positioning the firm

Competing on Cost ü Eliminate all waste ü Invest in ü ü ü Updated facilities & equipment Streamlining operations Training & development

Competitive Priorities: Cost • Southwest Airlines – one type of airplane facilitates crew changes, record-keeping, maintenance, and inventory costs – direct flights mean no baggage transfers – $30 million annual savings in travel agent commissions by requiring customers to contact the airline directly Copyright, 2006, John Wiley and Sons

Competing on Quality ü Please the customer ü Understand customer attitudes toward and expectations of quality Example: Ritz Carlton

Competing on Flexibility ü Produce wide variety of products ü Introduce new products ü Modify existing products quickly ü Respond to customer needs

Competing on Speed ü Fast moves ü Fast adaptations ü Tight linkages Example: FEDEX, UPS, DHL

Competitive Priorities: Speed • Citicorp – advertises a 15 -minute mortgage approval • L. L. Bean – ships orders the day they are received • Wal-Mart – replenishes its stock twice a week • General Electric – reduces time to manufacture circuit-breaker boxes into three days and dishwashers into 18 hours • Motorola – needs less than 30 minutes to build to order pagers Copyright, 2006, John Wiley and Sons

Operations Role in Corporate Strategy ü Provide support for overall strategy of a firm ü Serve as firm’s distinctive competence ü Must be consistent with overall strategy

Operations and Wall Street • Comparing operations at a firm with competitors • Example income per employee revenue per employee inventory turnover customer turnover

Operations Strategy at Wal-Mart Mission Competitive Priority Wal-Mart Provide value for our customers Low prices, everyday Operations Strategy Low inventory levels Short flow times Operations Structure Linked communications between stores Fast transportation system Enabling Process and Technologies EDI/satellites Cross-docking Focused locations

Strategy and the Internet ü Create a distinctive business strategy ü Strengthen existing competitive advantages ü Integrate new and traditional activities ü Must provide a unique value to the customer

Strategic Decisions in Operations Products Capacity Human Resources Facilities Figure 2. 2 Services Sourcing Processes and Technology Quality Operating Systems

Products & Services ü Make-to-order ü Made to customer specifications after order received ü Make-to-stock ü Made in anticipation of demand ü Assemble-to-order ü Add options according to customer specification

Processes & Technology ü Project ü One-time production of product to customer order ü Batch production ü Process many jobs at same time in batch ü Mass production ü Produce large volumes of standard product for mass market ü Continuous production ü Very high volume commodity product

Product-Process Matrix High Continuous Production Volume Mass Production Batch Production Projects Low Figure 2. 3 Standardization High

Service-Process Matrix High Service Factory Volume Mass Service Low Service Shop Professional Service Low Figure 2. 4 Standardization High

Capacity & Facilities ü How much capacity to provide ü Size of capacity changes ü Handling excess demand ü Hiring/firing workers ü Need for new facilities

Facilities ü Best size for facility? ü Large or small facilities ü Facility focus ü Facility location ü Global facility

Human Resources ü Skill levels required ü Degree of autonomy ü Policies ü Profit sharing ü Individual or team work ü Supervision methods ü Levels of management ü Training

Quality ü Target level ü Measurement ü Employee involvement ü Training ü Systems needed to ensure quality ü Maintaining quality awareness ü Evaluating quality efforts ü Determining customer perceptions

Sourcing ü Degree of vertical integration ü Supplier selection ü Supplier relationship ü Supplier quality ü Supplier cooperation

Operating Systems ü Execute strategy daily ü Information technology support ü Effective planning & control systems ü Alignment of inventory levels, scheduling priorities, & reward systems

Strategic Planning Mission and Vision Voice of the Business Marketing Strategy Figure 2. 5 Corporate Strategy Operations Strategy Voice of the Customer Financial Strategy

Policy Deployment ü Focuses employees on common goals & priorities ü Translates strategy into measurable objectives ü Aligns day-to-day decisions with strategic plan

Balanced Scorecard ü Finance — How should we look to our shareholders? ü Customer — How should we look to our customers? ü Processes — At which business processes must we excel? ü Learning and Growing — How will we sustain our ability to change and improve?

Issues and Trends ü Global markets, sourcing, operations ü Virtual companies ü Greater choice ü Emphasis on service ü Speed and flexibility ü Supply chains ü Collaboration ü Technological advances ü Knowledge ü Environment and social responsibilities
 Solution – Change the Name of the Old Program")
The Dilbert (Dogbert) Solution – Change the Name of the Old Program

Decision Analysis • Payoff Table - craps tables • Maximax - maximum of maximum payoffs - optimistic - “hard ways” • Maximin - maximum of minimum payoffs - safe bets or even odds bets • Minimax regret - minimum of maximum regrets or opportunity costs

Decision Trees • Graphical method of analyzing a decision - similar to Theory of Constraints • Payoff table can be translated to a Decision Tree

Decision Analysis

The Payoff Table ü A method of organizing & illustrating the payoffs from different decisions given various states of nature ü A payoff is the outcome of the decision – a Craps table pay off chart is an example of a payoff chart
 Decision a b 1 Payoff 1/a Payoff 1/b")
Payoff Table States Of Nature (Alternatives) Decision a b 1 Payoff 1/a Payoff 1/b 2 Payoff 2/a Payoff 2/b
 üChoose decision with the maximum")
Decision Making Criteria Under Uncertainty ü Maximax criterion (optimistic) üChoose decision with the maximum of the maximum payoffs ü Minimin criterion (pessimistic) Choose decision with the minimum of the minimum payoffs Maximin criterion üChoose decision with the maximum of the minimum payoffs

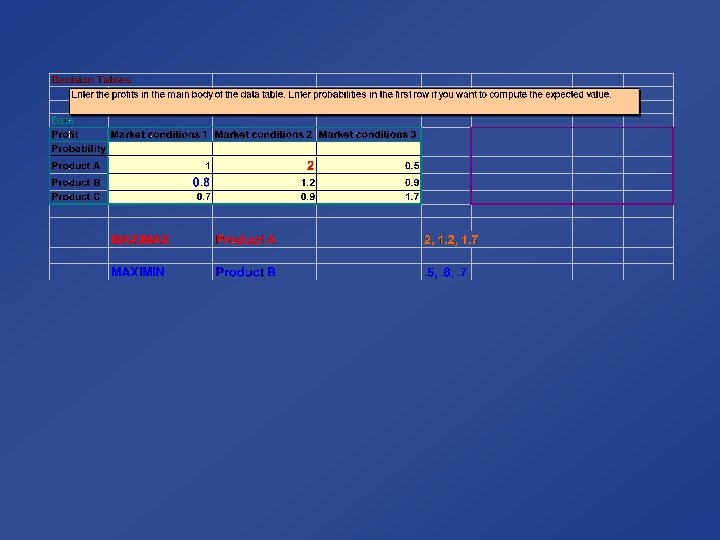
STATES OF NATURE DECISION Expand Maintain status quo Sell now Good Foreign Competitive Conditions Poor Foreign Competitive Conditions $ 800, 000 1, 300, 000 320, 000 Maximums: 1, 300, 000; 500, 000 1, 300, 000 Minimums: 500, 000; 320, 000; -150, 000 320, 000 $ 500, 000 -150, 000 320, 000

Chapter 5 Products and Services

Product Design ü Specifies materials ü Determines dimensions & tolerances ü Defines appearance ü Sets performance standards

Service Design ü Specifies what the customer is to experience ü ü ü Physical items Sensual benefits Psychological benefits

An Effective Design Process ü Matches product/service characteristics with customer needs ü Meets customer requirements in simplest, most cost-effective manner ü Reduces time to market - haste vs. speed to market ü Minimizes revisions - quality designed into the product

Stages in the Design Process ü Idea Generation — Product Concept - can you create your own market? What role does the voice of the customer play in idea generation? ü Feasibility Study — Performance Specifications ü Preliminary Design — Prototype - testing and redesign ü Final Design — Final Design Specifications ü Process Planning — Manufacturing Specifications - make to order/stock – assembly line?

The Design Process Idea generation Suppliers R&D Marketing Product or service concept Feasibility study Form design Customers Competitors Performance specifications Revising and testing prototypes Production design Functional design New product or service launch Final design & process plans Design specifications Pilot run and final tests Manufacturing or delivery specifications

Idea Generation ü Suppliers, distributors, salespersons ü Trade journals and other published material ü Warranty claims, customer complaints, failures ü Customer surveys, focus groups, interviews ü Field testing, trial users ü Research and development

More Idea Generators ü Perceptual Maps ü Visual comparison of customer perceptions ü Benchmarking ü Comparing product/service against best-in-class ü Reverse engineering ü Dismantling competitor’s product to improve your own product

Perceptual Map of Breakfast Cereals GOOD TASTE LOW NUTRITION HIGH NUTRITION BAD TASTE

Perceptual Map of Breakfast Cereals GOOD TASTE Cocoa Puffs LOW NUTRITION HIGH NUTRITION Rice Krispies Cheerios Wheaties Shredded Wheat BAD TASTE

Feasibility Study ü Market Analysis - Market Segmentation ü Economic Analysis ü Technical / Strategic Analysis ü Performance Specifications Not unlike mission analysis or Intelligence Preparation of the Battlefield

Risk Analysis 1. Identify the Hazards 2. Assess hazards to determine risks. 3. Develop controls and make risk decisions. 4. Implement controls. 5. Supervise and evaluate. From FM 100 -14

Preliminary Design How will it look? ü Create form & functional design ü Build prototype ü Test prototype ü Revise prototype ü Retest
 ü Reliability ü Probability product performs intended function")
Functional Design (How the Product Performs) ü Reliability ü Probability product performs intended function for specified length of time ü Maintainability ü Ease and/or cost or maintaining/repairing product

Computing Reliability Components in series 0. 90 x 0. 90 = 0. 81

Computing Reliability Components in series 0. 90 x 0. 90 = 0. 81 Components in parallel 0. 90 R 2 0. 95 + 0. 90(1 -0. 95) = 0. 995 0. 95 R 1

System Availability MTBF System Availability, SA = MTBF + MTTR
 MTTR")
System Availability MTBF System Availability, SA = MTBF + MTTR PROVIDER MTBF (HR) MTTR (HR) A B C 60 36 24 4. 0 2. 0 1. 0
 MTTR")
System Availability MTBF System Availability, SA = MTBF + MTTR PROVIDER MTBF (HR) MTTR (HR) A B C 60 36 24 4. 0 2. 0 1. 0 SAA = 60 / (60 + 4) =. 9375 or 93. 75% SAB = 36 / (36 + 2) =. 9473 or 94. 73% SAC = 24 / (24 + 1) =. 96 or 96%

Production Design ü Part of the preliminary design phase ü Simplification ü Standardization ü Modularity

Final Design & Process Plans ü Produce detailed drawings & specifications ü Create workable instructions for manufacture ü Select tooling & equipment ü Prepare job descriptions ü Determine operation & assembly order ü Program automated machines

Improving the Design Process ü Design teams ü Concurrent design ü Design for manufacture & assembly ü Design to prevent failures and ensure value ü Design for environment ü Measure design quality ü Utilize quality function deployment ü Design for robustness ü Engage in collaborative design

Breaking Down Barriers to Effective Design

Design Teams Preferred solution = cross functional teams ü Marketing, manufacturing, engineering ü Suppliers, dealers, customers ü Lawyers, accountants, insurance companies

Concurrent Design ü Improves quality of early design decisions ü Decentralized - suppliers complete detailed design ü Incorporates production process ü Scheduling and management can be complex as tasks are done in parallel ü include the customer in the process!!

Design for Manufacture and Assembly ü Design a product for easy & economical production ü Incorporate production design early in the design phase ü Improves quality and reduces costs ü Shortens time to design and manufacture ü also known as Design for Six Sigma

Design for Six Sigma • Define – the goals of the design activity • Measure – customer input to determine what is critical to quality from the customers’ perspective – what are customer delighters? What aspects are critical to quality? • Analyze – innovative concepts for products and services to create value for the customer • Design – new processes, products, and services to deliver customer value • Verify – new systems perform as expected

DFM Guidelines ü Minimize the number of parts, tools, fasteners, and assemblies ü Use standard parts and repeatable processes ü Modular design ü Design for ease of assembly, minimal handling ü Allow for efficient testing and parts replacement
 ü Procedure for reducing number of parts ü Evaluate methods")
Design for Assembly (DFA) ü Procedure for reducing number of parts ü Evaluate methods for assembly ü Determine assembly sequence
 ü A systematic approach for")
Design Review ü Failure Mode and Effects Analysis (FMEA) ü A systematic approach for analyzing causes & effects of failures ü Prioritizes failures ü Attempts to eliminate causes
 Is there value added? ü Ratio of value / cost")
Value Analysis (Value Engineering) Is there value added? ü Ratio of value / cost ü Assessment of value : 1. Can we do without it? 2. Does it do more than is required? 3. Does it cost more than it is worth? 4. Can something else do a better job 5. Can it be made by less costly method, tools, material? 6. Can it be made cheaper, better or faster by someone else? Should we contract it out?

Design for Environment ü Design from recycled material ü Use materials which can be recycled ü Design for ease of repair ü Minimize packaging ü Minimize material & energy used during manufacture, consumption & disposal ü green laws in Europe -

Examples • Recycling of oil • carpets in land fills - 4 billion pounds in land fills annually • Xerox and Hewlett-Packard - pay for return of printer cartridges on larger printers
 ü Translates the “voice of the customer” into technical design")
Quality Function Deployment (QFD) ü Translates the “voice of the customer” into technical design requirements ü Displays requirements in matrix diagrams ü First matrix called “house of quality” ü Series of connected houses

Design for Robustness ü Product can fail due to poor design quality ü Products subjected to many conditions ü Robust design studies ü Controllable factors - under designer’s control ü Uncontrollable factors - from user or environment ü Designs products for consistent performance

Consistency is Important ü Consistent errors are easier to correct than random errors ü Parts within tolerances may yield assemblies which aren’t ü Consumers prefer product characteristics near their ideal values

Characteristics of Services • • • Services are intangible Service output is variable Service have higher customer contact Services are perishable Service inseparable from delivery Tend to be decentralized and dispersed Consumed more often than products Services can be easily emulated Call girl principle – value diminishes after service is rendered

A Well-Designed Service System is ü Consistent with firm’s strategic focus ü Customer friendly ü Easy to sustain ü Effectively linked between front & back office ü Cost effective ü Visible to customer
a266db4c805b15164ded0adba363180b.ppt