

36f72bd7e60724b8893891abd660876b.ppt
- Количество слайдов: 101
 Operations is the most influential function of an organization in affecting the overall productivity. Why it is so?
 How Do We Measure Productivity? Productivity = Output / Input So how can we increase productivity? Single factor productivity Output / Labor Output / Capital Output / Materials Output / Energy Multi-factor productivity Output / (Labor + Capital + Energy) Output / (Labor + Capital + Materials) Total measure of productivity Output / Input = Goods and services produced / All resources used
 Managing Operations and Technology Global Environment
 Global Strategies þ Boeing – sales and production are worldwide þ Benetton – moves inventory to stores around the world faster than its competition by building flexibility into design, production, and distribution þ Sony – purchases components from suppliers in Thailand, Malaysia, and around the world
 Firm Latecoere Labinel Dassault Country France Messier-Bugatti Thales France Messier-Dowty") Some Boeing Suppliers (787) Firm Latecoere Labinel Dassault Country France Messier-Bugatti Thales France Messier-Dowty Diehl France Germany Component Passenger doors Wiring Design and PLM software Electric brakes Electrical power conversion system and integrated standby flight display Landing gear structure Interior lighting
Some Boeing Suppliers (787) Firm Latecoere Labinel Dassault Country France Messier-Bugatti Thales France Messier-Dowty Diehl France Germany Component Passenger doors Wiring Design and PLM software Electric brakes Electrical power conversion system and integrated standby flight display Landing gear structure Interior lighting
 Firm Cobham Rolls-Royce Smiths Aerospace Country UK UK UK BAE") Some Boeing Suppliers (787) Firm Cobham Rolls-Royce Smiths Aerospace Country UK UK UK BAE SYSTEMS Alenia Aeronautics UK Italy Toray Industries Japan Component Fuel pumps and valves Engines Central computer system Electronics Upper center fuselage & horizontal stabilizer Carbon fiber for wing and tail units
Some Boeing Suppliers (787) Firm Cobham Rolls-Royce Smiths Aerospace Country UK UK UK BAE SYSTEMS Alenia Aeronautics UK Italy Toray Industries Japan Component Fuel pumps and valves Engines Central computer system Electronics Upper center fuselage & horizontal stabilizer Carbon fiber for wing and tail units
 Firm Fuji Heavy Industries Kawasaki Heavy Industries Country Japan Component") Some Boeing Suppliers (787) Firm Fuji Heavy Industries Kawasaki Heavy Industries Country Japan Component Center wing box Japan Teijin Seiki Mitsubishi Heavy Industries Chengdu Aircraft Group Hafei Aviation Japan Forward fuselage, fixed section of wing, landing gear well Hydraulic actuators Wing box China Rudder China Parts
Some Boeing Suppliers (787) Firm Fuji Heavy Industries Kawasaki Heavy Industries Country Japan Component Center wing box Japan Teijin Seiki Mitsubishi Heavy Industries Chengdu Aircraft Group Hafei Aviation Japan Forward fuselage, fixed section of wing, landing gear well Hydraulic actuators Wing box China Rudder China Parts
 Firm Korean Aviation Saab Country South Korea Sweden Component Wingtips") Some Boeing Suppliers (787) Firm Korean Aviation Saab Country South Korea Sweden Component Wingtips Cargo access doors
Some Boeing Suppliers (787) Firm Korean Aviation Saab Country South Korea Sweden Component Wingtips Cargo access doors
 Global Strategies þ Volvo – considered a Swedish company but it is controlled by an American company, Ford. The current Volvo S 40 is built in Belgium and shares its platform with the Mazda 3 built in Japan and the Ford Focus built in Europe. þ Haier – A Chinese company, produces compact refrigerators (it has one-third of the US market) and wine cabinets (it has half of the US market) in South Carolina
 Some Multinational Corporations Home Country % Sales Outside Home Country % Assets Outside Home Country % Foreign Workforce Citicorp USA 34 46 NA Colgate. Palmolive USA 72 63 NA Dow Chemical USA 60 50 NA Gillette USA 62 53 NA Honda Japan 63 36 NA USA 57 47 51 Company IBM
 Some Multinational Corporations Home Country % Sales Outside Home Country % Assets Outside Home Country % Foreign Workforce Britain 78 50 NA Switzerland 98 95 97 Philips Netherlands Electronics 94 85 82 Siemens Germany 51 NA 38 Unilever Britain & Netherlands 95 70 64 Company ICI Nestle
 Reasons 2.") Reasons to Globalize Tangible 1. Reduce costs (labor, taxes, tariffs, etc. ) Reasons 2. Improve supply chain 3. Provide better goods and services 4. Understand markets Intangible 5. Learn to improve operations Reasons 6. Attract and retain global talent
Reasons to Globalize Tangible 1. Reduce costs (labor, taxes, tariffs, etc. ) Reasons 2. Improve supply chain 3. Provide better goods and services 4. Understand markets Intangible 5. Learn to improve operations Reasons 6. Attract and retain global talent
 Reduce Costs þ Foreign locations with lower wage rates can lower direct and indirect costs þ Maquiladoras ( Free Port Zone) þ World Trade Organization (WTO) þ North American Free Trade Agreement (NAFTA) þ APEC, SEATO, MERCOSUR þ European Union (EU)
 Improve the Supply Chain þ Locating facilities closer to unique resources þ Auto design to California þ Athletic shoe production to China þ Perfume manufacturing in France
 Provide Better Goods and Services þ Objective and subjective characteristics of goods and services þ On-time deliveries þ Cultural variables þ Improved customer service
 Understand Markets þ Interacting with foreign customers and suppliers can lead to new opportunities þ Cell phone design from Europe þ Cell phone fads from Japan þ Extend the product life cycle
 Learn to Improve Operations þ Remain open to the free flow of ideas þ General Motors partnered with a Japanese auto manufacturer to learn þ Equipment and layout have been improved using Scandinavian ergonomic competence
 Attract and Retain Global Talent þ Offer better employment opportunities þ Better growth opportunities and insulation against unemployment þ Relocate unneeded personnel to more prosperous locations þ Incentives for people who like to travel
 Cultural and Ethical Issues þ Cultures can be quite different þ Attitudes can be quite different towards þ Punctuality þ Lunch breaks þ Thievery þ Bribery þ Environment þ Intellectual property þ Child labor
 You May Wish To Consider þ National literacy rate þ Rate of innovation þ Rate of technology change þ Number of skilled workers þ Political stability þ Product liability laws þ Export restrictions þ Variations in language þ Work ethic þ Tax rates þ Inflation þ Availability of raw materials þ Interest rates þ Population þ Number of miles of highway þ Phone system
 Developing Missions and Strategies Mission statements tell an organization where it is going The Strategy tells the organization how to get there
 Mission þ Mission - where are you going? þ Organization’s purpose for being þ Answers ‘What do we provide society? ’ þ Provides boundaries and focus
 Fed. Ex is committed to our People-Service-Profit philosophy. We will produce outstanding financial returns by providing total reliable, competitively superior, global air-ground transportation of high priority goods and documents that require rapid, time-certain delivery. Equally important, positive control of each package will be maintained using real time electronic tracking and tracing systems. A complete record of each shipment and delivery will be presented with our request for payment. We will be helpful, courteous, and professional to each other and the public. We will strive to have a completely satisfied customer at the end of each transaction.
 Merck The mission of Merck is to provide society with superior products and services innovations and solutions that improve the quality of life and satisfy customer needs to provide employees with meaningful work and advancement opportunities and investors with a superior rate of return
 Hard Rock Cafe Our Mission: To spread the spirit of Rock ‘n’ Roll by delivering an exceptional entertainment and dining experience. We are committed to being an important, contributing member of our community and offering the Hard Rock family a fun, healthy, and nurturing work environment while ensuring our long-term success.
 Arnold Palmer Hospital is a healing environment providing family-centered care with compassion, comfort and respect… when it matters the most.
 Factors Affecting Mission Philosophy and Values Profitability and Growth Environment Mission Customers Public Image Benefit to Society
 Strategy þ Action plan to achieve mission þ Functional areas have strategies þ Strategies exploit opportunities and strengths, neutralize threats, and avoid weaknesses
 Strategies for Competitive Advantage þ Differentiation – better, or at least different þ Cost leadership – cheaper þ Response – rapid response
 Competing on Differentiation Uniqueness can go beyond both the physical characteristics and service attributes to encompass everything that impacts customer’s perception of value þ Safeskin gloves – leading edge products þ Walt Disney Magic Kingdom – experience differentiation þ Hard Rock Cafe – dining experience
 Competing on Cost Provide the maximum value as perceived by customer. Does not imply low quality. þ Southwest Airlines – secondary airports, no frills service, efficient utilization of equipment þ Wal-Mart – small overheads, shrinkage, distribution costs þ Franz Colruyt – no bags, low light, no music, doors on freezers
 Competing on Response þ Flexibility is matching market changes in design innovation and volumes þ Institutionalization at Hewlett-Packard þ Reliability is meeting schedules þ German machine industry þ Timeliness is quickness in design, production, and delivery þ Johnson Electric, Bennigan’s, Motorola
 OM’s Contribution to Strategy Operations Decisions Product Quality Process Examples Specific Strategy Used Competitive Advantage FLEXIBILITY: Sony’s constant innovation of new products………………. . Design HP’s ability to lead the printer market………………Volume Southwest Airlines No-frills service……. . LOW COST Location Layout Human resource Supply chain Inventory Scheduling Maintenance DELIVERY: Pizza Hut’s 5 -minute guarantee at lunchtime…………………. Speed Federal Express’s “absolutely, positively on time”……………. . …. Dependability QUALITY: Motorola’s HDTV converters…. ……. . . . Conformance Motorola’s pagers……………. . …. Performance Caterpillar’s after-sale service on heavy equipment……………. . AFTER-SALE SERVICE Fidelity Security’s broad line of mutual funds…………. BROAD PRODUCT LINE Differentiation (Better) Response (Faster) Cost leadership (Cheaper)
 Process Design Variety of Products High Moderate Process-focused Mass Customization JOB SHOPS Customization at high Volume (Print shop, emergency room, machine shop, (Dell Computer’s PC, fine-dining Repetitive (modular) cafeteria: high restaurant) focus volume) ASSEMBLY LINE (Cars, appliances, TVs, fast-food Product focused restaurants: More CONTINUOUS variety lower volume) (steel, beer, paper, bread, institutional kitchen : High volume with limited variety) Low Moderate Volume High
 Preconditions One must understand: þ Strengths and weaknesses of competitors and possible new entrants into the market þ Current and prospective environmental, technological, legal, and economic issues þ The product life cycle þ Resources available within the firm and within the OM function þ Integration of OM strategy with company’s strategy and with other functional areas
 Product Life Cycle Company Strategy/Issues Introduction Growth Maturity Best period to increase market share Practical to change price or quality image Poor time to change image, price, or quality R&D engineering is critical Strengthen niche Competitive costs become critical Defend market position Internet search engines LCD & plasma TVs Sales Drive-through restaurants Decline Cost control critical CD-ROMs Analog TVs i. Pods Xbox 360 3 1/2” Floppy disks
 OM Strategy/Issues Introduction Growth Maturity Decline") Product Life Cycle (Lets update the products ) OM Strategy/Issues Introduction Growth Maturity Decline Product design and development critical Frequent product and process design changes Short production runs High production costs Limited models Attention to quality Forecasting critical Product and process reliability Competitive product improvements and options Increase capacity Shift toward product focus Enhance distribution Standardization Less rapid product changes – more minor changes Optimum capacity Increasing stability of process Long production runs Product improvement and cost cutting Little product differentiation Cost minimization Overcapacity in the industry Prune line to eliminate items not returning good margin Reduce capacity
Product Life Cycle (Lets update the products ) OM Strategy/Issues Introduction Growth Maturity Decline Product design and development critical Frequent product and process design changes Short production runs High production costs Limited models Attention to quality Forecasting critical Product and process reliability Competitive product improvements and options Increase capacity Shift toward product focus Enhance distribution Standardization Less rapid product changes – more minor changes Optimum capacity Increasing stability of process Long production runs Product improvement and cost cutting Little product differentiation Cost minimization Overcapacity in the industry Prune line to eliminate items not returning good margin Reduce capacity
 SWOT Analysis Mission Internal Strengths External Opportunities Analysis Internal Weaknesses External Threats Strategy
 Strategy Development Process Environmental Analysis Identify the strengths, weaknesses, opportunities, and threats. Understand the environment, customers, industry, and competitors. Determine Corporate Mission State the reason for the firm’s existence and identify the value it wishes to create. Form a Strategy Build a competitive advantage, such as low price, design, or volume flexibility, quality, quick delivery, dependability, after-sale service, broad product lines.
 Strategy Development and Implementation þ Identify critical success factors þ Build and staff the organization þ Integrate OM with other activities The operations manager’s job is to implement an OM strategy, provide competitive advantage, and increase productivity
") Critical Success Factors Marketing Service Distribution Promotion Channels of distribution Product positioning (image, functions) Finance/Accounting Production/Operations Leverage Cost of capital Working capital Receivables Payables Financial control Lines of credit Decisions Sample Options Product Quality Customized, or standardized Define customer expectations and how to achieve them Process Location Layout Human resource Supply chain Inventory Schedule Maintenance Facility size, technology, capacity Near supplier or near customer Work cells or assembly line Specialized or enriched jobs Single or multiple suppliers When to reorder, how much to keep on hand Stable or fluctuating production rate Repair as required or preventive maintenance
Critical Success Factors Marketing Service Distribution Promotion Channels of distribution Product positioning (image, functions) Finance/Accounting Production/Operations Leverage Cost of capital Working capital Receivables Payables Financial control Lines of credit Decisions Sample Options Product Quality Customized, or standardized Define customer expectations and how to achieve them Process Location Layout Human resource Supply chain Inventory Schedule Maintenance Facility size, technology, capacity Near supplier or near customer Work cells or assembly line Specialized or enriched jobs Single or multiple suppliers When to reorder, how much to keep on hand Stable or fluctuating production rate Repair as required or preventive maintenance
 Activity Mapping Courteous, but Limited Passenger Service Lean, Productive Employees Short Haul, Point-to. Point Routes, Often to Secondary Airports Competitive Advantage: Low Cost High Aircraft Utilization Standardized Fleet of Boeing 737 Aircraft Frequent, Reliable Schedules
 Activity Mapping Courteous, but Limited Passenger Service Lean, Productive Employees Short Haul, Point-to. Point Routes, Often to Secondary Airports Automated ticketing machines Competitive Advantage: No seat assignments Low Cost No baggage transfers High Aircraft Utilization No meals (peanuts) Standardized Fleet of Boeing 737 Aircraft Frequent, Reliable Schedules
 Lean, Lower gate costs") Activity Mapping Courteous, but Limited Passenger Service No meals (peanuts) Lean, Lower gate costs at Productive secondary airports Employees Short Haul, Point-to. Point Routes, Often to Secondary Airports High number of flights Competitive Advantage: reduces employee idle time Low Cost between flights High Aircraft Utilization Standardized Fleet of Boeing 737 Aircraft Frequent, Reliable Schedules
Activity Mapping Courteous, but Limited Passenger Service No meals (peanuts) Lean, Lower gate costs at Productive secondary airports Employees Short Haul, Point-to. Point Routes, Often to Secondary Airports High number of flights Competitive Advantage: reduces employee idle time Low Cost between flights High Aircraft Utilization Standardized Fleet of Boeing 737 Aircraft Frequent, Reliable Schedules
 Activity Mapping Courteous, but High number of flights Limited idle time reduces employee Passenger Service between flights Lean, Saturate a Productive lowering Employees Short Haul, Point-tocity with flights, Point Routes, Often to administrative Secondary Airports costs (advertising, HR, etc. ) Competitive Advantage: per passenger for that city Low Cost Pilot training required on only one type of aircraft High Frequent, Aircraft Reduced Utilization maintenance Standardized inventory required of Boeing Fleet because of only one type of. Aircraft 737 aircraft Reliable Schedules
 Activity Mapping Pilot training required on Courteous, but only one type of aircraft Limited Passenger Service Reduced maintenance inventory required because Haul, Point-to. Lean, Short of only one type of aircraft Routes, Often to Productive Point Employees Secondary Airports Excellent supplier relations with Boeing has aided Competitive Advantage: financing Low Cost High Aircraft Utilization Standardized Fleet of Boeing 737 Aircraft Frequent, Reliable Schedules
 Activity Mapping Courteous, but Limited Passenger Reduced maintenance Service Lean, Productive Flexible union Employees inventory required because of only one type of aircraft Point-to. Short Haul, Point Routes, Often to Flexible employees and Secondary Airports standard planes aid contracts Competitive Advantage: scheduling Low Cost Maintenance personnel trained only one type of High Frequent, Aircraft Reliable aircraft Utilization Standardized 20 -minute gate Fleet of Boeing 737 Aircraft Schedules turnarounds
 Activity Mapping Automated ticketing Courteous, but machines Limited Passenger Service Empowered employees Lean, Productive Employees High Aircraft Utilization High employee Short Haul, Point-to. Point compensation Routes, Often to Secondary Airports Hire for attitude, then train Competitive Advantage: High level Low Cost of stock ownership Frequent, High number of flights Reliable reduces employee idle time Schedules Standardized Fleetbetween flights of Boeing 737 Aircraft
 Four International Operations Strategies High Transnational Strategy þ Standardized product þ Economies of scale þ Cross-cultural learning Cost Reduction Considerations Global Strategy þ Move material, people, ideas across national boundaries þ Economies of scale þ Cross-cultural learning Examples Texas Instruments Caterpillar Otis Elevator International Strategy Examples Coca-Cola Nestlé þ Import/export or license existing product Multidomestic Strategy þ Use existing domestic model globally þ Franchise, joint ventures, subsidiaries Examples U. S. Steel Harley Davidson Examples Heinz The Body Shop Mc. Donald’s Hard Rock Cafe Low High Local Responsiveness Considerations (Quick Response and/or Differentiation)
 Ranking Corruption Rank 1 1 1 5 7 11 14 15 16 17 20 34 70 121 Country 2006 CPI Score (out of 10) Finland 9. 6 Least Corrupt Iceland 9. 6 New Zealand 9. 6 Singapore 9. 4 Switzerland 9. 1 UK 8. 6 Canada 8. 5 Hong Kong 8. 3 Germany 8. 0 Japan 7. 6 USA, Belgium 7. 3 Israel, Taiwan 5. 9 Most Brazil, China, Mexico 3. 3 Corrupt Russia 2. 5 Table 8. 2
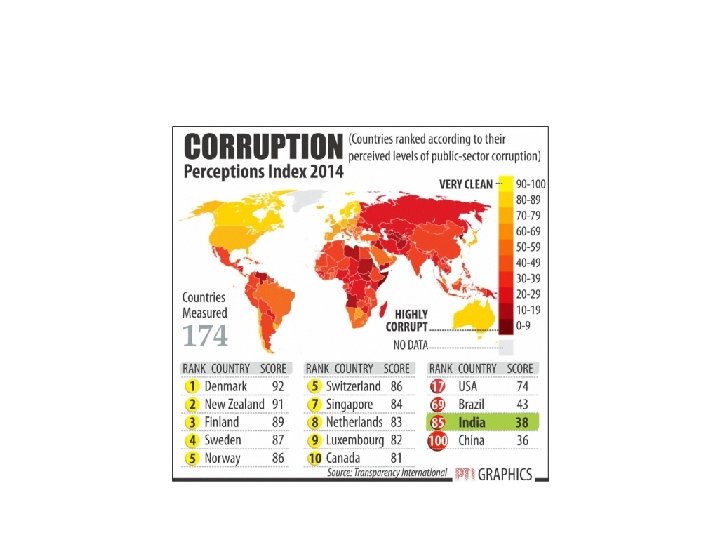
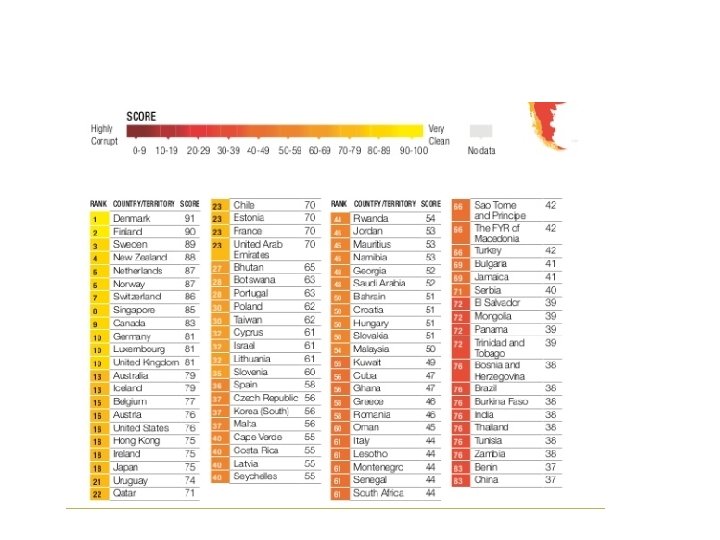
 • • Guinea-Bissau. . Venezuela. . Iraq. . Libya. . Angola. . South Sudan. Afghanistan.

 Forecasting at Disney World þ Global portfolio includes parks in Hong Kong, Paris, Tokyo, Orlando, and Anaheim þ Revenues are derived from people – how many visitors and how they spend their money þ Daily management report contains only the forecast and actual attendance at each park
 Forecasting at Disney World þ Disney generates daily, weekly, monthly, annual, and 5 -year forecasts þ Forecast used by labor management, maintenance, operations, finance, and park scheduling þ Forecast used to adjust opening times, rides, shows, staffing levels, and guests admitted
 Forecasting at Disney World þ 20% of customers come from outside the USA þ Economic model includes gross domestic product, cross-exchange rates, arrivals into the USA þ A staff of 35 analysts and 70 field people survey 1 million park guests, employees, and travel professionals each year
 Forecasting at Disney World þ Inputs to the forecasting model include airline specials, Federal Reserve policies, Wall Street trends, vacation/holiday schedules for 3, 000 school districts around the world þ Average forecast error for the 5 -year forecast is 5% þ Average forecast error for annual forecasts is between 0% and 3%
 What is Forecasting? þ Process of predicting a future event þ Underlying basis of all business decisions þ Production þ Inventory þ Personnel þ Facilities ? ?
 Forecasting Time Horizons þ Short-range forecast þ Up to 1 year, generally less than 3 months þ Purchasing, job scheduling, workforce levels, job assignments, production levels þ Medium-range forecast þ 3 months to 3 years þ Sales and production planning, budgeting þ Long-range forecast þ 3+ years þ New product planning, facility location, research and development
 Distinguishing Differences þ Medium/long range forecasts deal with more comprehensive issues and support management decisions regarding planning and products, plants and processes þ Short-term forecasting usually employs different methodologies than longer-term forecasting þ Short-term forecasts tend to be more accurate than longer-term forecasts
 Influence of Product Life Cycle Introduction – Growth – Maturity – Decline þ Introduction and growth require longer forecasts than maturity and decline þ As product passes through life cycle, forecasts are useful in projecting þ Staffing levels þ Inventory levels þ Factory capacity
 Product Life Cycle Company Strategy/Issues Introduction Best period to increase market share Growth Practical to change price or quality image Maturity Poor time to change image, price, or quality Decline Cost control critical Strengthen niche R&D engineering is critical Competitive costs become critical Defend market position Internet search engines LCD & plasma TVs Sales Drive-through restaurants CD-ROMs Analog TVs i. Pods Xbox 360 3 1/2” Floppy disks Figure 2. 5
 Product Life Cycle OM Strategy/Issues Introduction Product design and development critical Frequent product and process design changes Short production runs High production costs Limited models Attention to quality Growth Forecasting critical Product and process reliability Competitive product improvements and options Increase capacity Shift toward product focus Enhance distribution Maturity Standardization Less rapid product changes – more minor changes Optimum capacity Increasing stability of process Long production runs Product improvement and cost cutting Decline Little product differentiation Cost minimization Overcapacity in the industry Prune line to eliminate items not returning good margin Reduce capacity Figure 2. 5
 Types of Forecasts þ Economic forecasts þ Address business cycle – inflation rate, money supply, housing starts, etc. þ Technological forecasts þ Predict rate of technological progress þ Impacts development of new products þ Demand forecasts þ Predict sales of existing products and services
 Strategic Importance of Forecasting þ Human Resources – Hiring, training, laying off workers þ Capacity – Capacity shortages can result in undependable delivery, loss of customers, loss of market share þ Supply Chain Management – Good supplier relations and price advantages
 Seven Steps in Forecasting þ Determine the use of the forecast þ Select the items to be forecasted þ Determine the time horizon of the forecast þ Select the forecasting model(s) þ Gather the data þ Make the forecast þ Validate and implement results
 The Realities! þ Forecasts are seldom perfect þ Most techniques assume an underlying stability in the system þ Product family and aggregated forecasts are more accurate than individual product forecasts
 Forecasting Approaches Qualitative Methods þ Used when situation is vague and little data exist þ New products þ New technology þ Involves intuition, experience þ e. g. , forecasting sales on Internet
 Forecasting Approaches Quantitative Methods þ Used when situation is ‘stable’ and historical data exist þ þ Existing products Current technology þ Involves mathematical techniques þ e. g. , forecasting sales of color televisions
 Overview of Qualitative Methods þ Jury of executive opinion þ Pool opinions of high-level experts, sometimes augment by statistical models þ Delphi method þ Panel of experts, queried iteratively
 Overview of Qualitative Methods þ Sales force composite þ Estimates from individual salespersons are reviewed for reasonableness, then aggregated þ Consumer Market Survey þ Ask the customer
 Jury of Executive Opinion þ Involves small group of high-level experts and managers þ Group estimates demand by working together þ Combines managerial experience with statistical models þ Relatively quick þ ‘Group-think’ disadvantage
 Sales Force Composite þ Each salesperson projects his or her sales þ Combined at district and national levels þ Sales reps know customers’ wants þ Tends to be overly optimistic
 Delphi Method þ Iterative group process, continues until consensus is reached Staff þ 3 types of (Administering participants survey) þ Decision makers þ Staff þ Respondents Decision Makers (Evaluate responses and make decisions) Respondents (People who can make valuable judgments)
 Consumer Market Survey þ Ask customers about purchasing plans þ What consumers say, and what they actually do are often different þ Sometimes difficult to answer
 Overview of Quantitative Approaches 1. Naive approach 2. Moving averages 3. Exponential smoothing 4. Trend projection 5. Linear regression Time-Series Models Associative Model
 Time Series Forecasting þ Set of evenly spaced numerical data þ Obtained by observing response variable at regular time periods þ Forecast based only on past values, no other variables important þ Assumes that factors influencing past and present will continue influence in future
 Time Series Components Trend Cyclical Seasonal Random
 Components of Demand for product or service Trend component Seasonal peaks Actual demand Average demand over four years Random variation | 1 | 2 | 3 Year | 4 Figure 4. 1
 Trend Component þ Persistent, overall upward or downward pattern þ Changes due to population, technology, age, culture, etc. þ Typically several years duration
 Seasonal Component þ Regular pattern of up and down fluctuations þ Due to weather, customs, etc. þ Occurs within a single year Period Length Number of Seasons Week Month Year Day Week Day Quarter Month Week 7 4 -4. 5 28 -31 4 12 52
 Cyclical Component þ Repeating up and down movements þ Affected by business cycle, political, and economic factors þ Multiple years duration þ Often causal or associative relationships 0 5 10 15 20
 Random Component þ Erratic, unsystematic, ‘residual’ fluctuations þ Due to random variation or unforeseen events þ Short duration and nonrepeating M T W T F
 Naive Approach þ Assumes demand in next period is the same as demand in most recent period þ e. g. , If January sales were 68, then February sales will be 68 þ Sometimes cost effective and efficient þ Can be good starting point
 Moving Average Method þ MA is a series of arithmetic means þ Used if little or no trend þ Used often for smoothing þ Provides overall impression of data over time Moving average = ∑ demand in previous n periods n
 Moving Average Example Month January February March April May June July Actual Shed Sales 10 12 13 16 19 23 26 3 -Month Moving Average (10 + 12 + 13)/3 = 11 2/3 (12 + 13 + 16)/3 = 13 2/3 (13 + 16 + 19)/3 = 16 (16 + 19 + 23)/3 = 19 1/3
 Shed Sales Graph of Moving Average 30 28 26 24 22 20 18 16 14 12 10 – – – Moving Average Forecast Actual Sales | | | J F M A M J J A S O N D
 Weighted Moving Average þ Used when trend is present þ Older data usually less important þ Weights based on experience and intuition Weighted moving average ∑ (weight for period n) x (demand in period n) = ∑ weights
 Weights Applied Period Weighted Moving Average 3 2 1 6 Month January February March April May June July Actual Shed Sales 10 12 13 16 19 23 26 Last month Two months ago Three months ago Sum of weights 3 -Month Weighted Moving Average [(3 x 13) + (2 x 12) + (10)]/6 = 121/6 [(3 x 16) + (2 x 13) + (12)]/6 = 141/3 [(3 x 19) + (2 x 16) + (13)]/6 = 17 [(3 x 23) + (2 x 19) + (16)]/6 = 201/2
 Potential Problems With Moving Average þ Increasing n smooths the forecast but makes it less sensitive to changes þ Do not forecast trends well þ Require extensive historical data>>>>>>>>>>>>>>>>>>>>>>>>>
 Moving Average And Weighted Moving Average Weighted moving average Sales demand 30 – 25 – Actual sales 20 – 15 – Moving average 10 – 5 – | Figure 4. 2 J | F | M | A | M | J | A | S | O | N | D
 Exponential Smoothing and many more NEW SOFTWARES AVAILABLE
 Seasonal Variations In Data The multiplicative seasonal model can adjust trend data for seasonal variations in demand
 Seasonal Index Example Month Demand 2005 2006 2007 Jan Feb Mar Apr May Jun Jul Aug Sept Oct Nov Dec 80 70 80 90 113 110 100 88 85 77 75 82 85 85 93 95 125 115 102 90 78 72 78 105 85 82 115 131 120 113 110 95 85 83 80 Average 2005 -2007 Average Monthly 90 80 85 100 123 115 100 90 80 80 80 94 94 94 Seasonal Index
 Seasonal Index Example Month Demand 2005 2006 2007 Average 2005 -2007 Average Monthly Jan 80 85 105 90 94 Feb 70 85 85 80 94 Mar 80 93 average 2005 -2007 monthly demand 82 85 94 Seasonal index 95 115 = Apr 90 94 average 100 monthly demand May 113 125 131 123 94 = 90/94 =. 957 Jun 110 115 120 115 94 Jul 100 102 113 105 94 Aug 88 102 110 100 94 Sept 85 90 94 Oct 77 78 85 80 94 Nov 75 72 83 80 94 Dec 82 78 80 80 94 Seasonal Index 0. 957
 Seasonal Index Example Month Demand 2005 2006 2007 Jan Feb Mar Apr May Jun Jul Aug Sept Oct Nov Dec 80 70 80 90 113 110 100 88 85 77 75 82 85 85 93 95 125 115 102 90 78 72 78 105 85 82 115 131 120 113 110 95 85 83 80 Average 2005 -2007 Average Monthly Seasonal Index 90 80 85 100 123 115 100 90 80 80 80 94 94 94 0. 957 0. 851 0. 904 1. 064 1. 309 1. 223 1. 117 1. 064 0. 957 0. 851
 Seasonal Index Example Month Demand 2005 2006 2007 Average 2005 -2007 Jan Feb Mar Apr May Jun Jul Aug Sept Oct Nov Dec 80 85 105 90 70 85 Forecast for 2008 85 80 80 93 82 85 Expected annual demand = 1, 200 90 95 115 100 113 125 131 123 110 115 120 1, 200 115 Jan x. 957 = 96 12 100 102 113 105 88 102 110 1, 200 100 Feb 95 x 90 = 85. 851 85 90 12 77 78 85 80 75 72 83 80 82 78 80 80 Average Monthly Seasonal Index 94 94 94 0. 957 0. 851 0. 904 1. 064 1. 309 1. 223 1. 117 1. 064 0. 957 0. 851
 Seasonal Index Example 2008 Forecast 2007 Demand 2006 Demand 2005 Demand 140 – 130 – Demand 120 – 110 – 100 – 90 – 80 – 70 – | J | F | M | A | M | | J J Time | A | S | O | N | D
 Multiple Regression Analysis If more than one independent variable is to be used in the model, linear regression can be extended to multiple regression to accommodate several independent variables ^ y = a + b 1 x 1 + b 2 x 2 … Computationally, this is quite complex and generally done on the computer