6eeee8bd736f87663e629d3fbd99a8a4.ppt
- Количество слайдов: 25


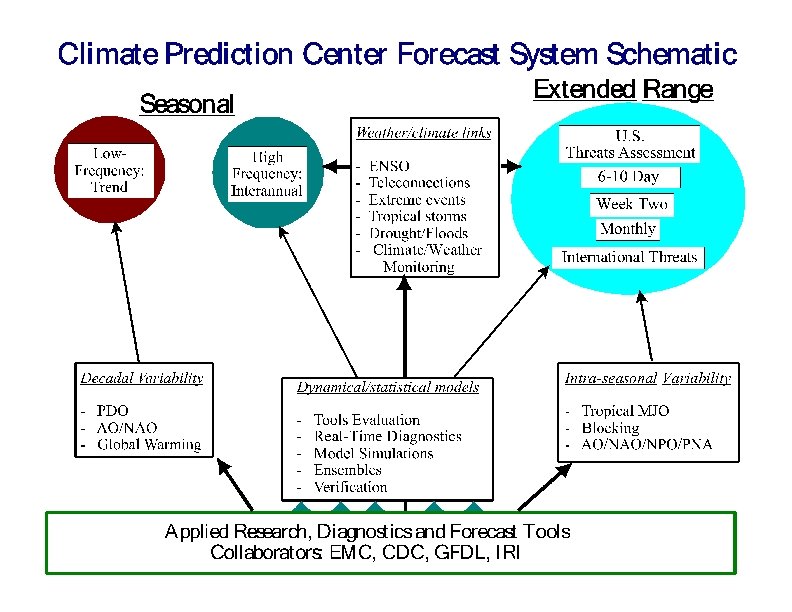
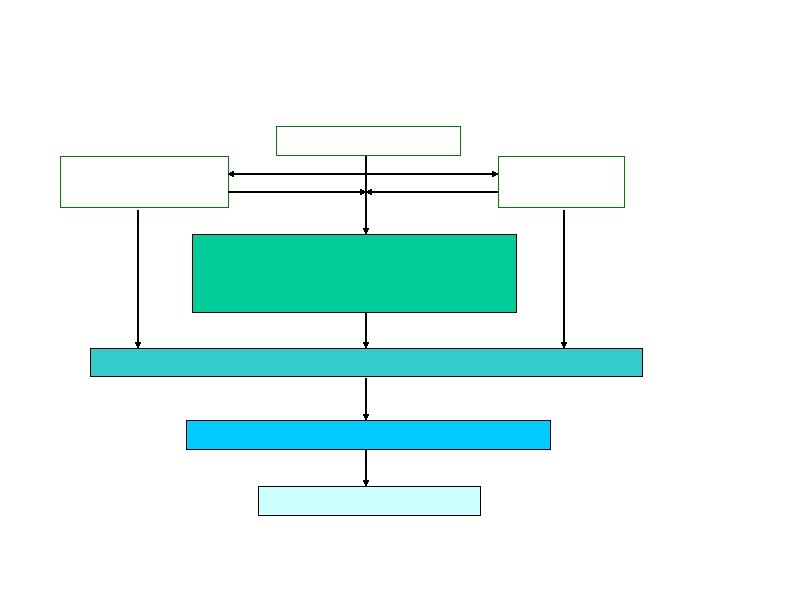
 Operations Concept for Ocean/Atmosphere Model

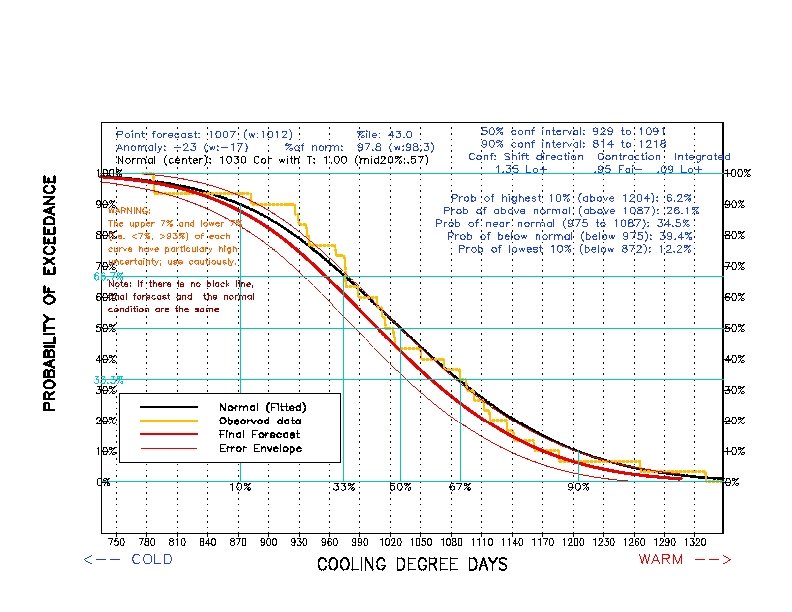
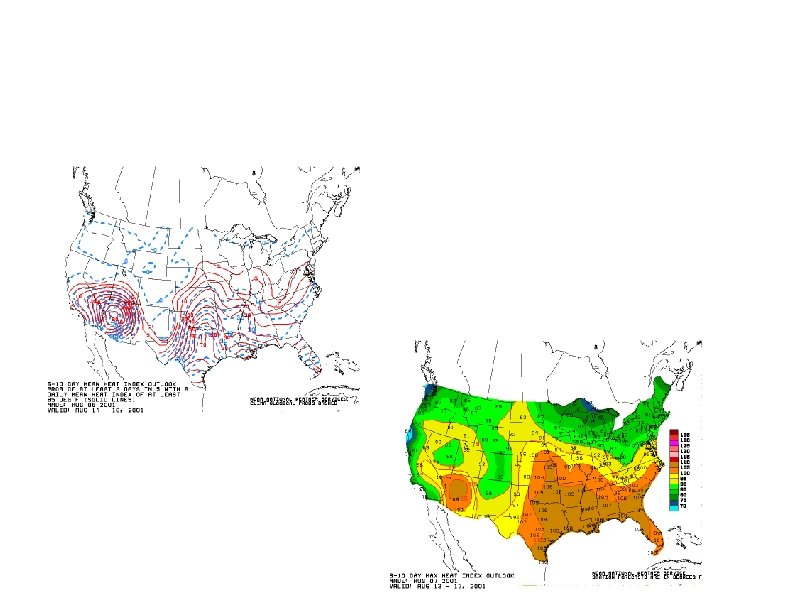
 Degree Day Assessment The CPC weekly Degree Day Assessment discusses the Heating Degree Day (HDD) or Cooling Degree Day (CDD) outlook for the coming week, and reviews temperature and degree day statistics for the past week and the heating season (November - March) or cooling season (May September) to date. This Assessment can assist energy managers in anticipating and analyzing fuel demand, because degree days quantitatively reflect the public need for energy to heat and cool businesses and dwellings. The Last 2000/01 heating season discussion, issued March 19, 2001, indicatedthat the slow seasonal decline in HDD’s should generally continue March 19 – 25, with increases in 7 -day totals (relative to last week) restricted to the Southeast, northern Gulf Coast, and middle Ohio Valley. Temperatures should average below normal from central and southern Texas eastward and northeastward through the south Atlantic, central Appalachian, and southern mid-Atlantic regions. In contrast, above-normal temperatures should prevail for most areas from the High Plains to the West Coast, except for most of Washington and Oregon. However, HDD totals should generally be within 60 of normal nationally, except in the northwestern Great Basin, where totals are expected to be 60 to 90 below normal.
 DIAGNOSTIC DISCUSSION issued by: CLIMATE PREDICTION CENTER/NCEP August 3, 2001") EL NIÑO/SOUTHERN OSCILLATION (ENSO) DIAGNOSTIC DISCUSSION issued by: CLIMATE PREDICTION CENTER/NCEP August 3, 2001 Sea surface temperature (SST) anomalies continued to increase in the central equatorial Pacific during July 2001. Since February 2001 SSTs and SST anomalies have steadily increased in the central equatorial Pacific Niño 4 region (Fig. 1) rising to their highest levels since the 1997 -98 warm (El Niño) episode. By late July equatorial SST anomalies between 0. 5°C and 1°C were observed between 165°E and 135°W (Fig. 2). Over the past two years there has been a gradual expansion of the area of positive equatorial subsurface temperature anomalies into the central Pacific and a gradual decrease in the strength and areal extent of the negative subsurface temperature anomalies in the eastern Pacific. This evolution is consistent with the decay of the subsurface thermal structure that characterizes the mature phase of cold episodes and the development of conditions usually found just prior to warm episodes. Accompanying this evolution has been a gradual transition from negative to positive SST anomalies between 160°E and 130°W. Positive SST anomalies are likely to continue in the equatorial Pacific during the remainder of 2001 and into the first half of 2002. This assessment is consistent with most coupled model and statistical model predictions that indicate warmer than normal oceanic conditions through early 2002. The impacts that this warming will have on global temperature and precipitation patterns depend to a large degree on its intensity. At the moment, there is considerable spread in the predicted SST anomalies, with most predictions indicating a weak or moderate warm episode (El Niño) by the end of 2001 and the beginning of 2002. Weekly updates for SST, 850 -h. Pa wind, OLR and the equatorial subsurface temperature structure available on the Climate Prediction Center homepage at: http: //www. cpc. ncep. noaa. gov (Weekly Update). Forecasts fo the evolution of El Niño/La Niña are updated monthly in CPC's Climate Diagnostics Bulletin Forecast Forum.
EL NIÑO/SOUTHERN OSCILLATION (ENSO) DIAGNOSTIC DISCUSSION issued by: CLIMATE PREDICTION CENTER/NCEP August 3, 2001 Sea surface temperature (SST) anomalies continued to increase in the central equatorial Pacific during July 2001. Since February 2001 SSTs and SST anomalies have steadily increased in the central equatorial Pacific Niño 4 region (Fig. 1) rising to their highest levels since the 1997 -98 warm (El Niño) episode. By late July equatorial SST anomalies between 0. 5°C and 1°C were observed between 165°E and 135°W (Fig. 2). Over the past two years there has been a gradual expansion of the area of positive equatorial subsurface temperature anomalies into the central Pacific and a gradual decrease in the strength and areal extent of the negative subsurface temperature anomalies in the eastern Pacific. This evolution is consistent with the decay of the subsurface thermal structure that characterizes the mature phase of cold episodes and the development of conditions usually found just prior to warm episodes. Accompanying this evolution has been a gradual transition from negative to positive SST anomalies between 160°E and 130°W. Positive SST anomalies are likely to continue in the equatorial Pacific during the remainder of 2001 and into the first half of 2002. This assessment is consistent with most coupled model and statistical model predictions that indicate warmer than normal oceanic conditions through early 2002. The impacts that this warming will have on global temperature and precipitation patterns depend to a large degree on its intensity. At the moment, there is considerable spread in the predicted SST anomalies, with most predictions indicating a weak or moderate warm episode (El Niño) by the end of 2001 and the beginning of 2002. Weekly updates for SST, 850 -h. Pa wind, OLR and the equatorial subsurface temperature structure available on the Climate Prediction Center homepage at: http: //www. cpc. ncep. noaa. gov (Weekly Update). Forecasts fo the evolution of El Niño/La Niña are updated monthly in CPC's Climate Diagnostics Bulletin Forecast Forum.