

269f4c7432d73ebf6d3692b882140e5e.ppt
- Количество слайдов: 40
 Online Science The World-Wide Telescope as a Prototype For the New Computational Science Jim Gray Microsoft Research http: //research. microsoft. com/~gray
 Outline • The Evolution of X-Info • The World Wide Telescope as Archetype • Data Mining the Sloan Digital Sky Survey Experiments & f Instruments acts Other Archives facts Literature Simulations facts ts fac ? questions answers The Big Problems • • • Data ingest Managing a petabyte Common schema How to organize it? How to reorganize it How to coexist with others • Query and Vis tools • Support/training • Performance – Execute queries in a minute – Batch query scheduling
 The Evolution of Science • Empirical Science – Scientist gathers data by direct observation – Scientist analyzes data • Analytical Science – Scientist builds analytical model – Makes predictions. • Computational Science – Simulate analytical model – Validate model and makes predictions • Science - Informatics – Data captured by instruments Or data generated by simulator – Processed by software – Placed in a database / files – Scientist analyzes database / files
 (not drawn to scale) Miners Scientists Data Mining") What’s X-info Needs from us (cs) (not drawn to scale) Miners Scientists Data Mining Algorithms Plumbers Database To store data Execute Queries Question & Answer Visualization Tools
What’s X-info Needs from us (cs) (not drawn to scale) Miners Scientists Data Mining Algorithms Plumbers Database To store data Execute Queries Question & Answer Visualization Tools
 Next-Generation Data Analysis • Looking for – Needles in haystacks – the Higgs particle – Haystacks: Dark matter, Dark energy • Needles are easier than haystacks • Global statistics have poor scaling – Correlation functions are N 2, likelihood techniques N 3 • As data and computers grow at same rate, we can only keep up with N log. N • A way out? – Discard notion of optimal (data is fuzzy, answers are approximate) – Don’t assume infinite computational resources or memory • Requires combination of statistics & computer science From Alex Szalay
 Data Access is hitting a wall FTP and GREP are not adequate • • You can GREP 1 MB in a second You can GREP 1 GB in a minute You can GREP 1 TB in 2 days You can GREP 1 PB in 3 years. • • You can FTP 1 MB in 1 sec You can FTP 1 GB / min (= 1 $/GB) … 2 days and 1 K$ … 3 years and 1 M$ • Oh!, and 1 PB ~5, 000 disks • At some point you need indices to limit search parallel data search and analysis • This is where databases can help
 • If there is too much data to move around,") Smart Data (active databases) • If there is too much data to move around, take the analysis to the data! • Do all data manipulations at database – Build custom procedures and functions in the database • Automatic parallelism guaranteed • Easy to build-in custom functionality – Databases & Procedures being unified – Example temporal and spatial indexing – Pixel processing • Easy to reorganize the data – Multiple views, each optimal for certain types of analyses – Building hierarchical summaries are trivial • Scalable to Petabyte datasets From Alex Szalay
Smart Data (active databases) • If there is too much data to move around, take the analysis to the data! • Do all data manipulations at database – Build custom procedures and functions in the database • Automatic parallelism guaranteed • Easy to build-in custom functionality – Databases & Procedures being unified – Example temporal and spatial indexing – Pixel processing • Easy to reorganize the data – Multiple views, each optimal for certain types of analyses – Building hierarchical summaries are trivial • Scalable to Petabyte datasets From Alex Szalay
 Analysis and Databases • Much statistical analysis deals with – – – – – Creating uniform samples – data filtering Assembling relevant subsets Estimating completeness censoring bad data Counting and building histograms Generating Monte-Carlo subsets Likelihood calculations Hypothesis testing • Traditionally these are performed on files • Most of these tasks are much better done inside a database • Move Mohamed to the mountain, not the mountain to Mohamed. From Alex Szalay
: – – Up-front") Organization & Algorithms • Use of clever data structures (trees, cubes): – – Up-front creation cost, but only N log. N access cost Large speedup during the analysis Tree-codes for correlations (A. Moore et al 2001) Datacubes for OLAP (all vendors) • Fast, approximate heuristic algorithms – No need to be more accurate than cosmic variance – Fast CMB analysis by Szapudi etal (2001) • N log. N instead of N 3 => 1 day instead of 10 million years • Take cost of computation into account – Controlled level of accuracy – Best result in a given time, given our computing resources From Alex Szalay
Organization & Algorithms • Use of clever data structures (trees, cubes): – – Up-front creation cost, but only N log. N access cost Large speedup during the analysis Tree-codes for correlations (A. Moore et al 2001) Datacubes for OLAP (all vendors) • Fast, approximate heuristic algorithms – No need to be more accurate than cosmic variance – Fast CMB analysis by Szapudi etal (2001) • N log. N instead of N 3 => 1 day instead of 10 million years • Take cost of computation into account – Controlled level of accuracy – Best result in a given time, given our computing resources From Alex Szalay
 Making Discoveries • Where are discoveries made? – At the edges and boundaries – Going deeper, collecting more data, using more colors…. • Metcalfe’s law – Utility of computer networks grows as the number of possible connections: O(N 2) • Szalay’s data law – Federation of N archives has utility O(N 2) – Possibilities for new discoveries grow as O(N 2) • Current sky surveys have proven this – Very early discoveries from SDSS, 2 MASS, DPOSS From Alex Szalay
 Goal: Easy Data Publication & Access • Augment FTP with data query: Return intelligent data subsets • Make it easy to – Publish: Record structured data – Find: • Find data anywhere in the network • Get the subset you need – Explore datasets interactively • Realistic goal: – Make it as easy as publishing/reading web sites today.
 Publishing Data Roles Authors Publishers Curators Consumers Traditional Scientists Journals Libraries Scientists Emerging Collaborations Project www site Bigger Archives Scientists • Exponential growth: – Projects last at least 3 -5 years – Data sent upwards only at the end of the project – Data will be never centralized • More responsibility on projects – Becoming Publishers and Curators • Data will reside with projects – Analyses must be close to the data
 Data Federations of Web Services • Massive datasets live near their owners: – – Near the instrument’s software pipeline Near the applications Near data knowledge and curation Super Computer centers become Super Data Centers • Each Archive publishes a web service – Schema: documents the data – Methods on objects (queries) • Scientists get “personalized” extracts • Uniform access to multiple Archives Federation – A common global schema
 Web Services: The Key? • Web SERVER: – Given a url + parameters – Returns a web page (often dynamic) Your h t program tp • Web SERVICE: – Given a XML document (soap msg) – Returns an XML document – Tools make this look like an RPC. • F(x, y, z) returns (u, v, w) – Distributed objects for the web. – + naming, discovery, security, . . • Internet-scale distributed computing b We e pag Your s o program ap Data In your address space Web Server t jec l ob m in x Web Service
 Grid and Web Services Synergy • I believe the Grid will be many web services • IETF standards Provide – Naming – Authorization / Security / Privacy – Distributed Objects Discovery, Definition, Invocation, Object Model – Higher level services: workflow, transactions, DB, . . • Synergy: commercial Internet & Grid tools
 Outline • The Evolution of X-Info • The World Wide Telescope as Archetype • Data Mining the Sloan Digital Sky Survey Experiments & f Instruments acts Other Archives facts Literature Simulations facts ts fac ? questions answers The Big Problems • • • Data ingest Managing a petabyte Common schema How to organize it? How to reorganize it How to coexist with others • Query and Vis tools • Support/training • Performance – Execute queries in a minute – Batch query scheduling
 World Wide Telescope Virtual Observatory http: //www. astro. caltech. edu/nvoconf/ http: //www. voforum. org/ • Premise: Most data is (or could be online) • So, the Internet is the world’s best telescope: – – It has data on every part of the sky In every measured spectral band: optical, x-ray, radio. . As deep as the best instruments (2 years ago). It is up when you are up. The “seeing” is always great (no working at night, no clouds no moons no. . ). – It’s a smart telescope: links objects and data to literature on them.
 Why Astronomy Data? IRAS 25 m • It has no commercial value –No privacy concerns –Can freely share results with others –Great for experimenting with algorithms 2 MASS 2 m • It is real and well documented –High-dimensional data (with confidence intervals) –Spatial data –Temporal data • Many different instruments from many different places and many different times • Federation is a goal • The questions are interesting DSS Optica IRAS 100 m WENSS 92 cm NVSS 20 cm –How did the universe form? • There is a lot of it (petabytes) ROSAT ~ke. V GB 6 cm
 Time and Spectral Dimensions The Multiwavelength Crab Nebulae Crab star 1053 AD X-ray, optical, infrared, and radio views of the nearby Crab Nebula, which is now in a state of chaotic expansion after a supernova explosion first sighted in 1054 A. D. by Chinese Astronomers. Slide courtesy of Robert Brunner @ Cal. Tech.
 Sky. Server. SDSS. org • A modern archive – Access to Sloan Digital Sky Survey Spectroscopic and Optical surveys – Raw Pixel data lives in file servers – Catalog data (derived objects) lives in Database – Online query to any and all • Also used for education – 150 hours of online Astronomy – Implicitly teaches data analysis • Interesting things – – – Spatial data search Client query interface via Java Applet Query from Emacs, Python, …. Cloned by other surveys (a template design) Web services are core of it.
 Sky. Server. SDSS. org • Like the Terra. Server, but looking the other way: a picture of ¼ of the universe • Sloan Digital Sky Survey Data: Pixels + Data Mining • About 400 attributes per “object” • Spectrograms for 1% of objects
 Demo of Sky. Server • • • Shows standard web server Pixel/image data Point and click Explore one object Explore sets of objects (data mining)
 Federation: Sky. Query. Net • Combine 4 archives initially • Just added 10 more • Send query to portal, portal joins data from archives. • Problem: want to do multi-step data analysis (not just single query). • Solution: Allow personal databases on portal • Problem: some queries are monsters • Solution: “batch schedule” on portal server, Deposits answer in personal database.
 Sky. Query Structure • Each Sky. Node publishes – Schema Web Service – Database Web Service • Portal is – Plans Query (2 phase) – Integrates answers – Is itself a web service Image Cutout SDSS Sky. Query Portal FIRST 2 MASS INT
 Sky. Query: http: //skyquery. net/ • Distributed Query tool using a set of web services • Four astronomy archives from Pasadena, Chicago, Baltimore, Cambridge (England). • Feasibility study, built in 6 weeks – Tanu Malik (JHU CS grad student) – Tamas Budavari (JHU astro postdoc) – With help from Szalay, Thakar, Gray • Implemented in C# and. NET • Allows queries like: SELECT o. obj. Id, o. r, o. type, t. obj. Id FROM SDSS: Photo. Primary o, TWOMASS: Photo. Primary t WHERE XMATCH(o, t)<3. 5 AND AREA(181. 3, -0. 76, 6. 5) AND o. type=3 and (o. I - t. m_j)>2
 My. DB added to Sky. Query • Moves analysis to the data • Users can cooperate (share My. DB) • Still exploring this • Let users add personal DB 1 GB for now. • Use it as a workbook. • Online and batch queries. INT Image Cutout SDSS Sky. Query Portal My. DB FIRST 2 MASS
 Outline • The Evolution of X-Info • The World Wide Telescope as Archetype • Data Mining the Sloan Digital Sky Survey Experiments & f Instruments acts Other Archives facts Literature Simulations facts ts fac ? questions answers The Big Problems • • • Data ingest Managing a petabyte Common schema How to organize it? How to reorganize it How to coexist with others • Query and Vis tools • Support/training • Performance – Execute queries in a minute – Batch query scheduling
 Working Cross-Culture How to design the database: Scenario Design • Astronomers proposed 20 questions • Typical of things they want to do • Each would require a week of programming in tcl / C++/ FTP • Goal, make it easy to answer questions • DB and tools design motivated by this goal – Implemented utility procedures – JHU Built Query GUI for Linux /Mac/. . clients
 The 20 Queries Q 1: Find all galaxies without unsaturated pixels within 1' of a given point of ra=75. 327, dec=21. 023 Q 2: Find all galaxies with blue surface brightness between and 23 and 25 mag per square arcseconds, and 10
 Two kinds of SDSS data in an SQL DB (objects and images all in DB) • 100 M Photo Objects ~ 400 attributes 400 K Spectra with ~30 lines/ spectrum
 An easy one: Q 7: Provide a list of star-like objects that are 1% rare. • Found 14, 681 buckets, first 140 buckets have 99% time 104 seconds • Disk bound, reads 3 disks at 68 MBps. Select cast((u-g) as int) as ug, cast((g-r) as int) as gr, cast((r-i) as int) as ri, cast((i-z) as int) as iz, count(*) as Population from stars group by cast((u-g) as int), cast((g-r) as int), cast((r-i) as int), cast((i-z) as int) order by count(*)
 An easy one Q 15: Provide a list of moving objects consistent with an asteroid. • Sounds hard but there are 5 pictures of the object at 5 different times (colors) and so can compute velocity. • Image pipeline computes velocity. • Computing it from the 5 color x, y would also be fast • Finds 285 objects in 3 minutes, 140 MBps. select obj. Id, -- return object ID sqrt(power(rowv, 2)+power(colv, 2)) as velocity from photo. Obj -- check each object. where (power(rowv, 2) + power(colv, 2)) -- square of velocity between 50 and 1000 -- huge values =error
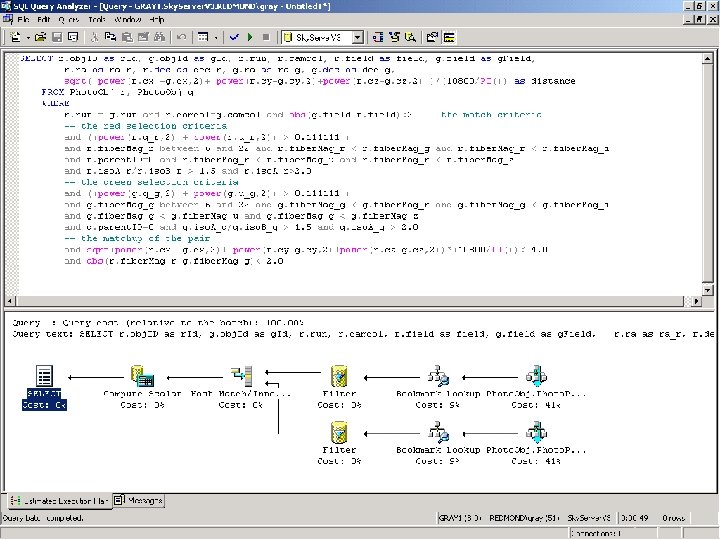
 Q 15: Fast Moving Objects • Find near earth asteroids: SELECT r. obj. ID as r. Id, g. obj. Id as g. Id, r. run, r. camcol, r. field as field, g. field as g. Field, r. ra as ra_r, r. dec as dec_r, g. ra as ra_g, g. dec as dec_g, sqrt( power(r. cx -g. cx, 2)+ power(r. cy-g. cy, 2)+power(r. cz-g. cz, 2) )*(10800/PI()) as distance FROM Photo. Obj r, Photo. Obj g WHERE r. run = g. run and r. camcol=g. camcol and abs(g. field-r. field)<2 -- the match criteria -- the red selection criteria and ((power(r. q_r, 2) + power(r. u_r, 2)) > 0. 111111 ) and r. fiber. Mag_r between 6 and 22 and r. fiber. Mag_r < r. fiber. Mag_g and r. fiber. Mag_r < r. fiber. Mag_i and r. parent. ID=0 and r. fiber. Mag_r < r. fiber. Mag_u and r. fiber. Mag_r < r. fiber. Mag_z and r. iso. A_r/r. iso. B_r > 1. 5 and r. iso. A_r>2. 0 -- the green selection criteria and ((power(g. q_g, 2) + power(g. u_g, 2)) > 0. 111111 ) and g. fiber. Mag_g between 6 and 22 and g. fiber. Mag_g < g. fiber. Mag_r and g. fiber. Mag_g < g. fiber. Mag_i and g. fiber. Mag_g < g. fiber. Mag_u and g. fiber. Mag_g < g. fiber. Mag_z and g. parent. ID=0 and g. iso. A_g/g. iso. B_g > 1. 5 and g. iso. A_g > 2. 0 -- the matchup of the pair and sqrt(power(r. cx -g. cx, 2)+ power(r. cy-g. cy, 2)+power(r. cz-g. cz, 2))*(10800/PI())< 4. 0 and abs(r. fiber. Mag_r-g. fiber. Mag_g)< 2. 0 • Finds 3 objects in 11 minutes – (or 27 seconds with an index) • Ugly, but consider the alternatives (c programs an files and…) –
 • Run times: on 15 k$ HP Server (2") Performance (on current SDSS data) • Run times: on 15 k$ HP Server (2 cpu, 1 GB , 8 disk) • Some take 10 minutes • Some take 1 minute • Median ~ 22 sec. • Ghz processors are fast! – (10 mips/IO, 200 ins/byte) – 2. 5 m rec/s/cpu ~1, 000 IO/cpu sec ~ 64 MB IO/cpu sec
Performance (on current SDSS data) • Run times: on 15 k$ HP Server (2 cpu, 1 GB , 8 disk) • Some take 10 minutes • Some take 1 minute • Median ~ 22 sec. • Ghz processors are fast! – (10 mips/IO, 200 ins/byte) – 2. 5 m rec/s/cpu ~1, 000 IO/cpu sec ~ 64 MB IO/cpu sec
 Call to Action • If you do data visualization: we need you (and we know it). • If you do databases: here is some data you can practice on. • If you do distributed systems: here is a federation you can practice on. • If you do data mining here is a dataset to test your algorithms. • If you do astronomy educational outreach here is a tool for you.
 Sky. Server references http: //Sky. Server. SDSS. org/ http: //research. microsoft. com/pubs/ http: //research. microsoft. com/Gray/SDSS/ (download personal Sky. Server) http: //research. microsoft. com/Gray • Data Mining the SDSS Sky. Server Database • Jim Gray; Peter Kunszt; Donald Slutz; Alex Szalay; Ani Thakar; Jan Vandenberg; Chris Stoughton Jan. 2002 40 p. An earlier paper described the Sloan Digital Sky Survey’s (SDSS) data management needs [Szalay 1] by defining twenty database queries and twelve data visualization tasks that a good data management system should support. We built a database and interfaces to support both the query load and also a website for ad-hoc access. This paper reports on the database design, describes the data loading pipeline, and reports on the query implementation and performance. The queries typically translated to a single SQL statement. Most queries run in less than 20 seconds, allowing scientists to interactively explore the database. This paper is an in-depth tour of those queries. Readers should first have studied the companion overview paper “The SDSS Sky. Server – Public Access to the Sloan Digital Sky Server Data” [Szalay 2]. • SDSS Sky. Server–Public Access to Sloan Digital Sky Server Data • Jim Gray; Alexander Szalay; Ani Thakar; Peter Z. Zunszt; Tanu Malik; Jordan Raddick; Christopher Stoughton; Jan Vandenberg November 2001 11 p. : Word 1. 46 Mbytes PDF 456 Kbytes The Sky. Server provides Internet access to the public Sloan Digital Sky Survey (SDSS) data for both astronomers and for science education. This paper describes the Sky. Server goals and architecture. It also describes our experience operating the Sky. Server on the Internet. The SDSS data is public and well-documented so it makes a good test platform for research on database algorithms and performance. • The World-Wide Telescope • Jim Gray; Alexander Szalay August 2001 6 p. : Word 684 Kbytes PDF 84 Kbytes All astronomy data and literature will soon be online and accessible via the Internet. The community is building the Virtual Observatory, an organization of this worldwide data into a coherent whole that can be accessed by anyone, in any form, from anywhere. The resulting system will dramatically improve our ability to do multi-spectral and temporal studies that integrate data from multiple instruments. The virtual observatory data also provides a wonderful base for teaching astronomy, scientific discovery, and computational science. • Designing and Mining Multi-Terabyte Astronomy Archives • Robert J. Brunner; Jim Gray; Peter Kunszt; Donald Slutz; Alexander S. Szalay; Ani Thakar June 1999 8 p. : Word (448 Kybtes) PDF (391 Kbytes) The next-generation astronomy digital archives will cover most of the sky at fine resolution in many wavelengths, from X-rays, through ultraviolet, optical, and infrared. The archives will be stored at diverse geographical locations. One of the first of these projects, the Sloan Digital Sky Survey (SDSS) is creating a 5 -wavelength catalog over 10, 000 square degrees of the sky (see http: //www. sdss. org/). The 200 million objects in the multi-terabyte database will have mostly numerical attributes in a 100+ dimensional space. Points in this space have highly correlated distributions. • Representing Polygon Areas and Testing Point-in-Polygon Containment in a Relational Database http: //research. microsoft. com/~Gray/papers/Polygon. doc • A Purely Relational Way of Computing Neighbors on a Sphere , http: //research. microsoft. com/~Gray/papers/Neighbors. doc
 Outline • The Evolution of X-Info • The World Wide Telescope as Archetype • Data Mining the Sloan Digital Sky Survey Experiments & f Instruments acts Other Archives facts Literature Simulations facts ts fac ? questions answers The Big Problems • • • Data ingest Managing a petabyte Common schema How to organize it? How to reorganize it How to coexist with others • Query and Vis tools • Support/training • Performance – Execute queries in a minute – Batch query scheduling