f29ec6d73b04559678607396c9dda679.ppt
- Количество слайдов: 17
 omp. P: A Profiling Tool for Open. MP Karl Fürlinger Michael Gerndt {fuerling, gerndt}@in. tum. de Technische Universität München
 Performance Analysis of Open. MP Applications n Platform specific tools – – n SUN Studio Intel Thread Analyzer. . . Make use of platform/compiler specific knowledge (naming conventions, outlining of parallel regions, . . . ) Platform independent tools – – How can we obtain performance data in a portable way? No standard performance measurement interface for Open. MP yet, POMP proposal for such an inteface [Mohr 02] DMPL proposed as a debugging interface [Cownie 03] omp. P: A Profiling Tool for Open. MP | 2
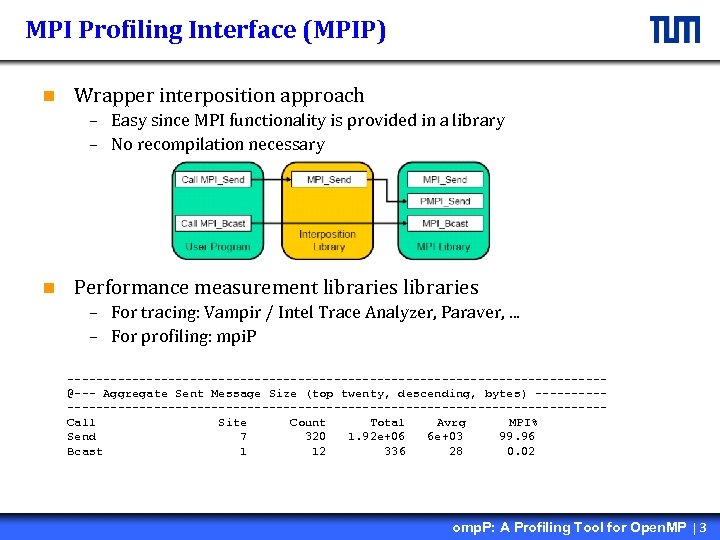 MPI Profiling Interface (MPIP) n Wrapper interposition approach – Easy since MPI functionality is provided in a library – No recompilation necessary n Performance measurement libraries – For tracing: Vampir / Intel Trace Analyzer, Paraver, . . . – For profiling: mpi. P -------------------------------------@--- Aggregate Sent Message Size (top twenty, descending, bytes) ------------------------------------------Call Site Count Total Avrg MPI% Send 7 320 1. 92 e+06 6 e+03 99. 96 Bcast 1 12 336 28 0. 02 omp. P: A Profiling Tool for Open. MP | 3
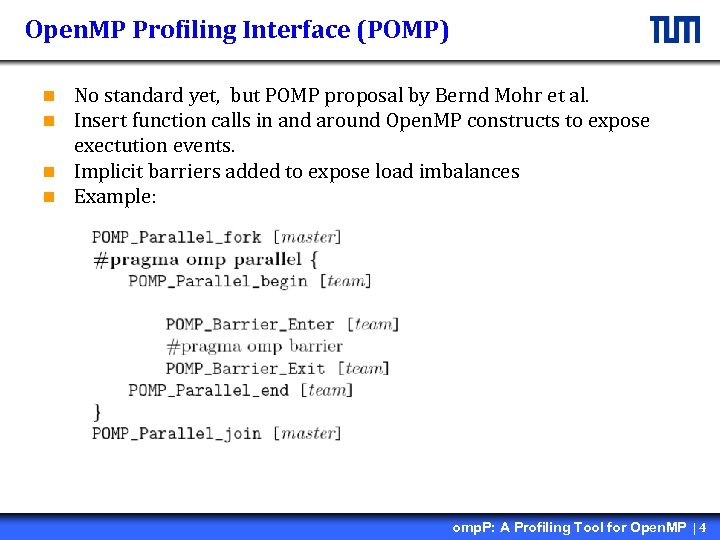 Open. MP Profiling Interface (POMP) No standard yet, but POMP proposal by Bernd Mohr et al. Insert function calls in and around Open. MP constructs to expose exectution events. n Implicit barriers added to expose load imbalances n Example: n n omp. P: A Profiling Tool for Open. MP | 4
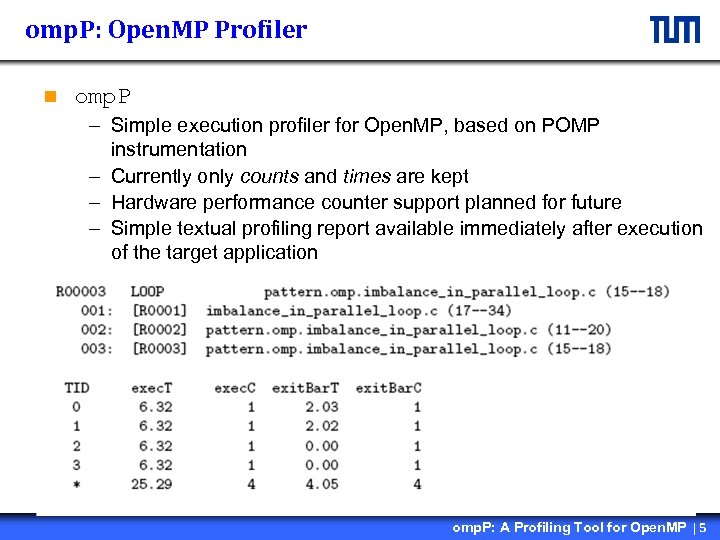 omp. P: Open. MP Profiler n omp. P – Simple execution profiler for Open. MP, based on POMP instrumentation – Currently only counts and times are kept – Hardware performance counter support planned for future – Simple textual profiling report available immediately after execution of the target application omp. P: A Profiling Tool for Open. MP | 5
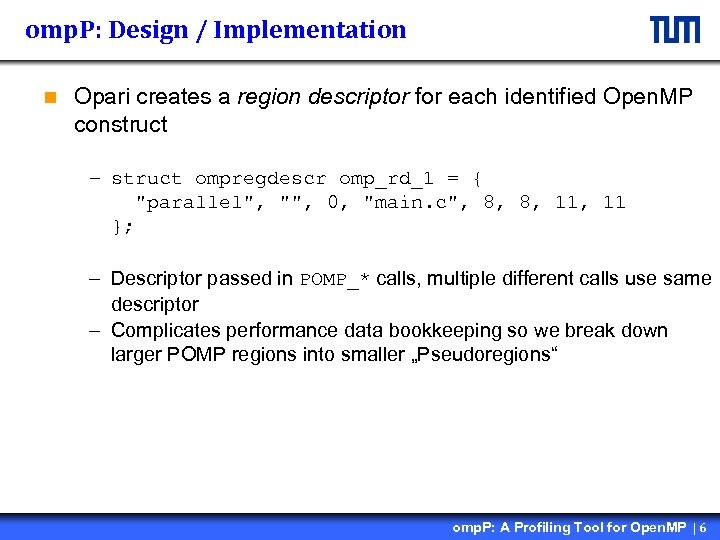 omp. P: Design / Implementation n Opari creates a region descriptor for each identified Open. MP construct – struct ompregdescr omp_rd_1 = { "parallel", "", 0, "main. c", 8, 8, 11 }; – Descriptor passed in POMP_* calls, multiple different calls use same descriptor – Complicates performance data bookkeeping so we break down larger POMP regions into smaller „Pseudoregions“ omp. P: A Profiling Tool for Open. MP | 6
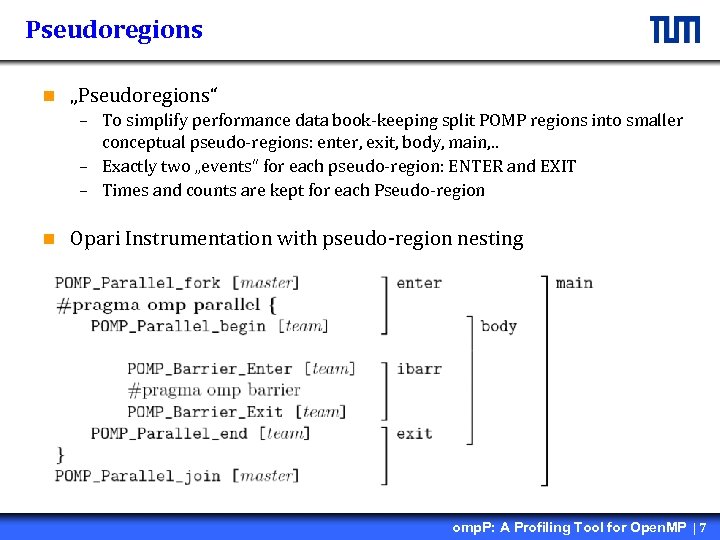 Pseudoregions n „Pseudoregions“ – To simplify performance data book-keeping split POMP regions into smaller conceptual pseudo-regions: enter, exit, body, main, . . – Exactly two „events“ for each pseudo-region: ENTER and EXIT – Times and counts are kept for each Pseudo-region n Opari Instrumentation with pseudo-region nesting omp. P: A Profiling Tool for Open. MP | 7
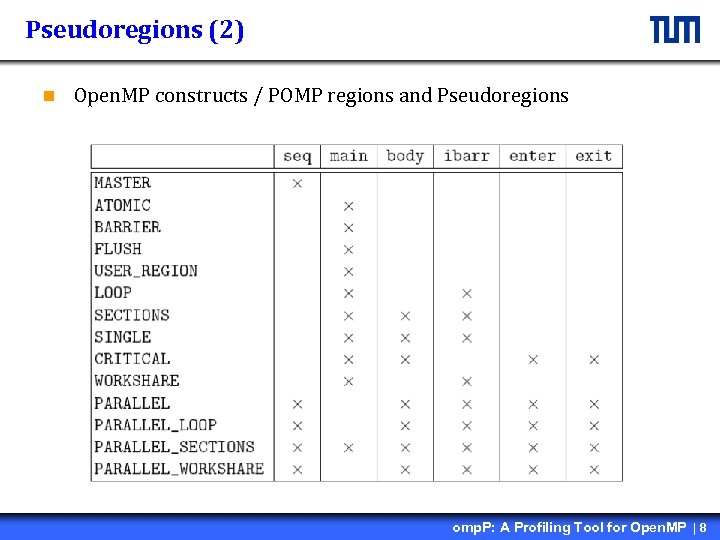 Pseudoregions (2) n Open. MP constructs / POMP regions and Pseudoregions omp. P: A Profiling Tool for Open. MP | 8
 Performance Data Reporting n Regionstack – Stack of entered POMP regions is maintained – Performance data is attributed to stack, not to entered region itself (similar to callgraph profile vs. flat profile) n Profiling report contains: – Header with general information: date and time of the program run, number of threads, . . . – List of all identified POMP regions with their type (PARALLEL, ATOMIC, BARRIER, . . . ) – Region summary list: Performance data is summed over threads, list is sorted according to the summed execution time – Detailled region profile omp. P: A Profiling Tool for Open. MP | 9
 Columns of the detailled region profile n exec. T, exec. C: number of executions and total inclusive time, derived from main or body n exit. Bar. T, exit. Bar. C derived from ibarr pseudo region and correspond to time spent in the implicit “exit barrier” in worksharing constructs or parallel regions. load for detecting load imbalances n startup. T and startup. C derived from enter pseudo region, defined for parallel regions n shutdown. T and shutdown. C defined for parallel regions, derived from exit n single. Body. T and single. Body. C for single regions, time spent inside the single region n section. T and section. C, defined for sections construct, time spent inside a section construct n enter. T, enter. C, exit. T and exit. C for critical constructs, omp. P: A Profiling Tool for Open. MP | 10
 Usage Examples n Platform: – – n 4 -way Itanium-2 SMP system 1. 3 GHz, 3 MB third level cache and 8 GB main memory Intel compiler version 8. 0 Suse Linux 2. 4. 21 kernel Test Applications: – APART Test Suite – Quicksort code from the Open. MP source code repository omp. P: A Profiling Tool for Open. MP | 11
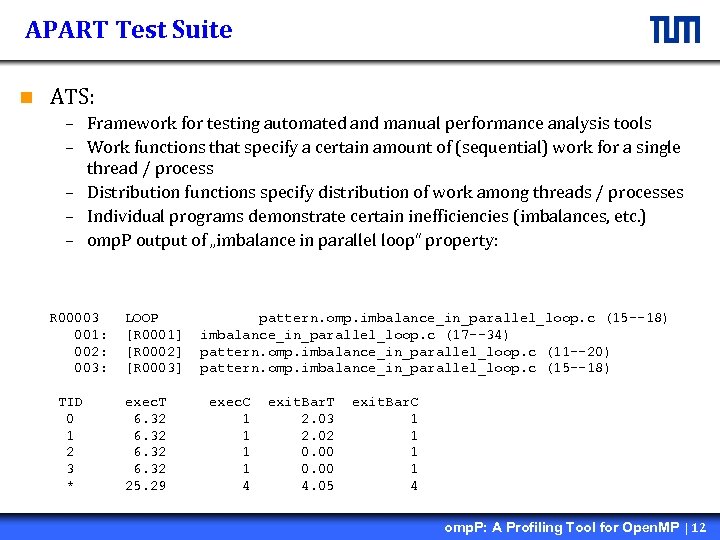 APART Test Suite n ATS: – Framework for testing automated and manual performance analysis tools – Work functions that specify a certain amount of (sequential) work for a single thread / process – Distribution functions specify distribution of work among threads / processes – Individual programs demonstrate certain inefficiencies (imbalances, etc. ) – omp. P output of „imbalance in parallel loop“ property: R 00003 001: 002: 003: TID 0 1 2 3 * LOOP [R 0001] [R 0002] [R 0003] exec. T 6. 32 25. 29 pattern. omp. imbalance_in_parallel_loop. c (15 --18) imbalance_in_parallel_loop. c (17 --34) pattern. omp. imbalance_in_parallel_loop. c (11 --20) pattern. omp. imbalance_in_parallel_loop. c (15 --18) exec. C 1 1 4 exit. Bar. T 2. 03 2. 02 0. 00 4. 05 exit. Bar. C 1 1 4 omp. P: A Profiling Tool for Open. MP | 12
![Quicksort (1) n Parallel implementations of the quicksort algorithm are compared in [Suess 04] Quicksort (1) n Parallel implementations of the quicksort algorithm are compared in [Suess 04]](https://present5.com/presentation/f29ec6d73b04559678607396c9dda679/image-13.jpg) Quicksort (1) n Parallel implementations of the quicksort algorithm are compared in [Suess 04] n Code available in the Open. MP Sourcecode repositroy (Omp. SCR: http: //www. pcg. ull. es/ompscr/ ) n We compare two versions: 1. Global stack of work elements. Access is protected by two critical sections 2. Local stack of work elements (global stack is only accessed when local stack is empty) omp. P: A Profiling Tool for Open. MP | 13
Quicksort (1) n Parallel implementations of the quicksort algorithm are compared in [Suess 04] n Code available in the Open. MP Sourcecode repositroy (Omp. SCR: http: //www. pcg. ull. es/ompscr/ ) n We compare two versions: 1. Global stack of work elements. Access is protected by two critical sections 2. Local stack of work elements (global stack is only accessed when local stack is empty) omp. P: A Profiling Tool for Open. MP | 13
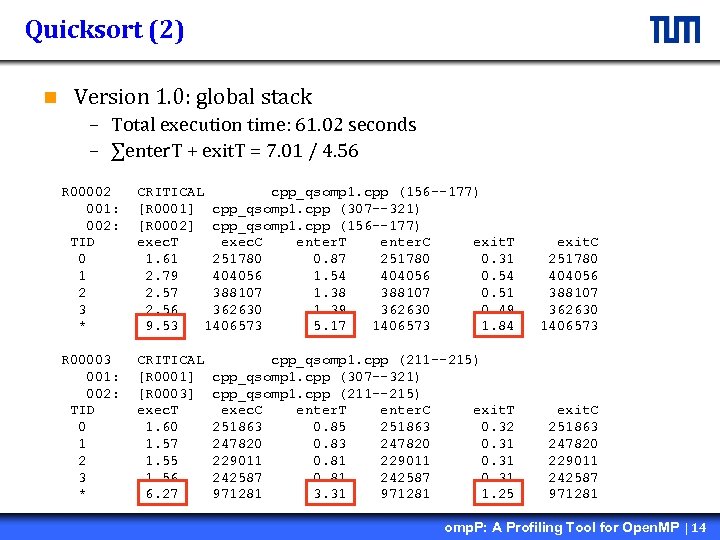 Quicksort (2) n Version 1. 0: global stack – Total execution time: 61. 02 seconds – ∑enter. T + exit. T = 7. 01 / 4. 56 R 00002 001: 002: TID 0 1 2 3 * CRITICAL cpp_qsomp 1. cpp (156 --177) [R 0001] cpp_qsomp 1. cpp (307 --321) [R 0002] cpp_qsomp 1. cpp (156 --177) exec. T exec. C enter. T enter. C exit. T 1. 61 251780 0. 87 251780 0. 31 2. 79 404056 1. 54 404056 0. 54 2. 57 388107 1. 38 388107 0. 51 2. 56 362630 1. 39 362630 0. 49 9. 53 1406573 5. 17 1406573 1. 84 R 00003 001: 002: TID 0 1 2 3 * CRITICAL [R 0001] [R 0003] exec. T 1. 60 1. 57 1. 55 1. 56 6. 27 cpp_qsomp 1. cpp (211 --215) cpp_qsomp 1. cpp (307 --321) cpp_qsomp 1. cpp (211 --215) exec. C enter. T enter. C exit. T 251863 0. 85 251863 0. 32 247820 0. 83 247820 0. 31 229011 0. 81 229011 0. 31 242587 0. 81 242587 0. 31 971281 3. 31 971281 1. 25 exit. C 251780 404056 388107 362630 1406573 exit. C 251863 247820 229011 242587 971281 omp. P: A Profiling Tool for Open. MP | 14
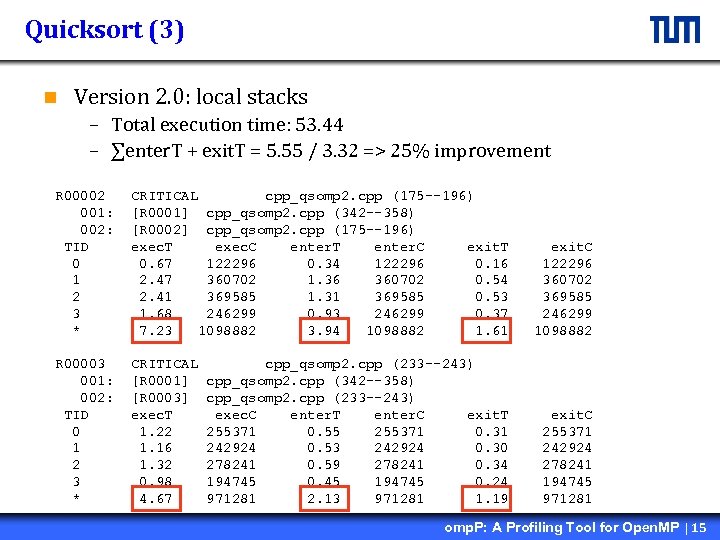 Quicksort (3) n Version 2. 0: local stacks – Total execution time: 53. 44 – ∑enter. T + exit. T = 5. 55 / 3. 32 => 25% improvement R 00002 001: 002: TID 0 1 2 3 * CRITICAL cpp_qsomp 2. cpp (175 --196) [R 0001] cpp_qsomp 2. cpp (342 --358) [R 0002] cpp_qsomp 2. cpp (175 --196) exec. T exec. C enter. T enter. C exit. T 0. 67 122296 0. 34 122296 0. 16 2. 47 360702 1. 36 360702 0. 54 2. 41 369585 1. 31 369585 0. 53 1. 68 246299 0. 93 246299 0. 37 7. 23 1098882 3. 94 1098882 1. 61 R 00003 001: 002: TID 0 1 2 3 * CRITICAL [R 0001] [R 0003] exec. T 1. 22 1. 16 1. 32 0. 98 4. 67 cpp_qsomp 2. cpp (233 --243) cpp_qsomp 2. cpp (342 --358) cpp_qsomp 2. cpp (233 --243) exec. C enter. T enter. C exit. T 255371 0. 55 255371 0. 31 242924 0. 53 242924 0. 30 278241 0. 59 278241 0. 34 194745 0. 45 194745 0. 24 971281 2. 13 971281 1. 19 exit. C 122296 360702 369585 246299 1098882 exit. C 255371 242924 278241 194745 971281 omp. P: A Profiling Tool for Open. MP | 15
 Summary n omp. P: simple profiling tool for Open. MP, based on POMP instrumentation – Simple, but can be very effective as a first step in performance tuning – Platform independent, can be used to compare performance on different platforms – Dependent on POMP instrumentation approach – We would really like to have a standard profiling interface n Availablility: Thank You! – First version was written in C++, → problems when linking with the omp. P library (C++ run-time needs to be included as well. . . ) – omp. P v 2. 0: C-only version, same functionality – will be available soon from http: //wwwbode. informatik. tu-muenchen. de/~fuerling/ompp omp. P: A Profiling Tool for Open. MP | 16
 References n Suess 04: Michael Süß and Claudia Leopold. A user’s experience with parallel sorting and Open. MP. In Proceedings of the Sixth Workshop on Open. MP (EWOMP’ 04), October 2004. n Cownie 03: James Cownie, John Del. Signore Jr. , Bronis R. de Supinski, and Karen Warren. DMPL: An Open. MP DLL debugging interface. In Proceedings of the Workshop on Open. MP Applications and Tools (WOMPAT 2003), pages 137 -146, 2003. n Mohr 02: Bernd Mohr, Allen D. Malony, Hans-Christian Hoppe, Frank Schlimbach, Grant Haab, Jay Hoeinger, and Sanjiv Shah. A performance monitoring interface for Open. MP. In Proceedings of the Fourth Workshop on Open. MP (EWOMP 2002), September 2002. omp. P: A Profiling Tool for Open. MP | 17


