4e2780fd5e2175da638fd0be01c6469d.ppt
- Количество слайдов: 161

October 27, 2010 The Upside The 7 Strategies for Turning Big Threats Into Growth Breakthroughs Adrian Slywotzky C O N F I D E N T I A L | www. oliverwyman. com

$ BB Value Migration® US Steel Nucor Sears Wal-Mart Compaq Dell Motorola Nokia © Oliver Wyman www. oliverwyman. com AJS 20101027 CIRT, Santa Fe. ppt 2

Net Profit (1995 $BB) No profit zone: Airline industry example Industry Net Profit 1971 2008 Source: Air Transport Association of America. © Oliver Wyman www. oliverwyman. com AJS 20101027 CIRT, Santa Fe. ppt 3

Evolving no profit zones § Airlines § Beverage in Grocery § Consumer Electronics § Films § PCs § Agriculture § Homeowner’s Insurance § Environmental Remediation § Cars § Lots of Manufacturing © Oliver Wyman www. oliverwyman. com AJS 20101027 CIRT, Santa Fe. ppt 4

Customer priorities trajectory 2013 Customer Priorities 2010 Customer Priorities 2005 Customer Priorities 1. 2. 3. © Oliver Wyman www. oliverwyman. com AJS 20101027 CIRT, Santa Fe. ppt 5

Coca-Cola: Multiple customer thinking Bottler Type 1 Grocer Fountain Vending Local franchise Convenience Hotel chains store Consumer Taste Regional Local grocer Type 2 Type 3 Large, sophisticated, businessdriven © Oliver Wyman www. oliverwyman. com Restaurants Large regional chains National chains Office buildings Price Local Availability organizations AJS 20101027 CIRT, Santa Fe. ppt 6

Supplier Power Index Product Customers Suppliers/ Customers Unique Highly fragmented 90/10 Strongly differentiated Fragmented 70/30 Differentiated Moderately concentrated 50/50 Weakly differentiated Concentrated 30/70 Pure commodity Highly concentrated 10/90 © Oliver Wyman www. oliverwyman. com AJS 20101027 CIRT, Santa Fe. ppt 7

Automotive – 1970 s Profitability GM Ford Chrysler Market Share © Oliver Wyman www. oliverwyman. com AJS 20101027 CIRT, Santa Fe. ppt 8

Profitability Automotive – 1990 Chrysler Ford GM Market Share © Oliver Wyman www. oliverwyman. com AJS 20101027 CIRT, Santa Fe. ppt 9

Profitability Automotive – 2002 GM Chrysler Ford Market Share © Oliver Wyman www. oliverwyman. com AJS 20101027 CIRT, Santa Fe. ppt 10

Profitability Automotive – 2008 Ford GM Chrysler Market Share © Oliver Wyman www. oliverwyman. com AJS 20101027 CIRT, Santa Fe. ppt 11

No-Profit Zones § Cars § Consumer electronics § Music § Newspapers § Grocery § Telco networks © Oliver Wyman www. oliverwyman. com AJS 20101027 CIRT, Santa Fe. ppt 12

My business design Today Next Customer Selection Unique Value Proposition Profit Model Strategic Control Scope © Oliver Wyman www. oliverwyman. com AJS 20101027 CIRT, Santa Fe. ppt 13

Business Design Example: Airline Industry Within a particular industry, companies may pursue very different Business Designs United • International & domestic; coach, business and firstclass travelers • Broad network & loyalty program Southwest • Domestic travelers; coach only • Low-cost, no-frills w/ highly consistent customer service Value Capture/ Profit Model • Tiered fares based on class, flexibility • Ancillary revenues • Every-day low prices • High asset utilization Scope • Global hub-and-spoke route system • US-only point-to-point route system Strategic Control • Controlled-access airports • Lowest costs in key geos • High frequency route • Loyal frequent fliers coverage Organizational Systems • Sophisticated IT • International Sales & Regulatory capability • Cultural emphasis on Southwest way Revenue • $16 BB • $10 BB Market Cap • $4. 7 BB • $10 BB Customer Selection & Value Proposition © Oliver Wyman www. oliverwyman. com Southwest Next? AJS 20101027 CIRT, Santa Fe. ppt 14

Industry Risk © Oliver Wyman www. oliverwyman. com AJS 20101027 CIRT, Santa Fe. ppt 15

Compete/collaborate: Timing Collaboration should begin Industry profit margin Collaboration begins Change the compete/collaborate ratio soon enough to make a difference © Oliver Wyman www. oliverwyman. com AJS 20101027 CIRT, Santa Fe. ppt 16

Compete/collaborate: Ratio Compete 100 0 90 10 80 20 70 30 60 40 50 © Oliver Wyman www. oliverwyman. com Collaborate 50 AJS 20101027 CIRT, Santa Fe. ppt 17

Compete/collaborate Too late? Still in play? § Textiles § Utilities § Apparel § Cars § Steel § Chemicals § DRAMs § Hollywood § Consumer electronics § Pharma § Music § Aerospace § Computing § Airlines? © Oliver Wyman www. oliverwyman. com AJS 20101027 CIRT, Santa Fe. ppt 18

Current Economic Situation – A Short Recap © Oliver Wyman www. oliverwyman. com AJS 20101027 CIRT, Santa Fe. ppt 19

© Oliver Wyman www. oliverwyman. com AJS 20101027 CIRT, Santa Fe. ppt 20

© Oliver Wyman www. oliverwyman. com AJS 20101027 CIRT, Santa Fe. ppt 21

The Bermuda Triangle Debt Savings © Oliver Wyman www. oliverwyman. com Income AJS 20101027 CIRT, Santa Fe. ppt 22

Total HH debt to total HH income 165% 113% 70% Total HH debt includes: Mortgage debt, home equity debt, non revolving consumer credit and revolving consumer credit. Source: Federal Reserve Board. © Oliver Wyman www. oliverwyman. com AJS 20101027 CIRT, Santa Fe. ppt 23

Percentage Personal savings as a percent of disposable personal income Source: Bureau of Economic Analysis © Oliver Wyman www. oliverwyman. com AJS 20101027 CIRT, Santa Fe. ppt 24

Of the roughly 130 million jobs in the U. S. , only 20 percent pay more than $60 K a year, while the remaining 80 percent average $33 K. >$60, 000 a year $33, 000 a year © Oliver Wyman www. oliverwyman. com AJS 20101027 CIRT, Santa Fe. ppt 25

Average U. S. unemployment rate ? Source: United States Department of Labor, Bureau of Labor Statistics © Oliver Wyman www. oliverwyman. com AJS 20101027 CIRT, Santa Fe. ppt 26

The “Seven-Lean Years” Economy? © Oliver Wyman www. oliverwyman. com AJS 20101027 CIRT, Santa Fe. ppt 27

Before reaching for the bottle of antidepressants … § The tale of two economies § Turnaround breakthroughs § Next Generation business design © Oliver Wyman www. oliverwyman. com AJS 20101027 CIRT, Santa Fe. ppt 28

The Tale of Two Economies © Oliver Wyman www. oliverwyman. com AJS 20101027 CIRT, Santa Fe. ppt 29

Four-Chain World © Oliver Wyman www. oliverwyman. com AJS 20101027 CIRT, Santa Fe. ppt 30

The Four-Chain World Technology Media/Content/Advertising Telco Consumer Electronics © Oliver Wyman www. oliverwyman. com AJS 20101027 CIRT, Santa Fe. ppt 31

The Four-Chain World Consumer Jennifer Stone: 50 year old, Small Business Owner © Oliver Wyman www. oliverwyman. com AJS 20101027 CIRT, Santa Fe. ppt 32

The Four-Chain World Consumer Jennifer Stone: 50 year old, Small Business Owner © Oliver Wyman www. oliverwyman. com AJS 20101027 CIRT, Santa Fe. ppt 33

Bloomberg: Simplifying the Trader’s Hassle Map Without Bloomberg: Multiple connections/ subscriptions It takes time and is expensive to connect to up to 200 exchanges, communicate with thousands of brokers, subscribe to countless news and research sources, and hook up voice communication Multiple logins Accessing each exchange and each news source takes time, and I need data that is current up-to-the-second A la carte pricing It’s hard to keep track of what everyone charges, and it’s expensive to buy data access and services a la carte Many screens and computers To see all of the data at once I need to have a bunch of computers and screens at my desk. Best alternative is to toggle between windows, which takes time Incomplete information No matter how much research I do or how many people I talk to, I’m never sure if I have as good and as current market information as our competitors do Data comparison/ download problems Some data pricing information is not comparable across sources and not all of the data I have can be easily downloaded into Excel for additional analysis With Bloomberg: Single comprehensive platform © Oliver Wyman www. oliverwyman. com Sleek dualscreen terminal Easy to manipulate: access and downloading AJS 20101027 CIRT, Santa Fe. ppt 34

Hassle Map © Oliver Wyman www. oliverwyman. com AJS 20101027 CIRT, Santa Fe. ppt 35

A Far Better Deal for the Customer © Oliver Wyman www. oliverwyman. com AJS 20101027 CIRT, Santa Fe. ppt 36

§ High growth § Premium price § Stronger allegiance © Oliver Wyman www. oliverwyman. com AJS 20101027 CIRT, Santa Fe. ppt 37

Value Migration 2001 Value 2009 Value 21 Leaders $2. 0 trillion $1. 5 trillion 7 cross-chain players $24 billion $503 billion 2% 25% Share of value Note: Bloomberg numbers are estimates since company financial data is not released. © Oliver Wyman www. oliverwyman. com AJS 20101027 CIRT, Santa Fe. ppt 38

Turnaround § Focus § Mindset § Energy © Oliver Wyman www. oliverwyman. com AJS 20101027 CIRT, Santa Fe. ppt 39

Turnaround successes § Apple § Hyundai § Autodesk § IBM § Best Buy § Kellogg's § Burberry § LG Mobile § Colgate § Morrisons § Continental AG § Nissan § Eastman Kodak § Porsche § Fiat § Samsung § Ford § Volkswagen § Harrah’s § Xerox § Hewlett Packard © Oliver Wyman www. oliverwyman. com AJS 20101027 CIRT, Santa Fe. ppt 40

Can you reverse a no-profit zone? © Oliver Wyman www. oliverwyman. com AJS 20101027 CIRT, Santa Fe. ppt 41

Value Added Compete On Price In the Same Way Differently Compete © Oliver Wyman www. oliverwyman. com AJS 20101027 CIRT, Santa Fe. ppt 42

ROIC vs. Growth for Top U. K. Grocers, 2005 -2008 ROIC (%) Tesco Sainsbury’s Morrisons Growth (%) Sources: Morrisons 2009 Annual Report; Tesco 2009 5 year record; Sainsbury 5 year record; Compustat Global Vantage © Oliver Wyman www. oliverwyman. com AJS 20101027 CIRT, Santa Fe. ppt 43

Customer Perception Map North American grocery retailers Excellent Offer Perception Poor High Low Price © Oliver Wyman www. oliverwyman. com AJS 20101027 CIRT, Santa Fe. ppt 44

© Oliver Wyman www. oliverwyman. com AJS 20101027 CIRT, Santa Fe. ppt 45

TWO No-Profit Zones § Memory chips § Consumer electronics © Oliver Wyman www. oliverwyman. com AJS 20101027 CIRT, Santa Fe. ppt 46

$BB Sony vs. Samsung Sony © Oliver Wyman www. oliverwyman. com AJS 20101027 CIRT, Santa Fe. ppt 47

$BB Sony vs. Samsung Sony © Oliver Wyman www. oliverwyman. com AJS 20101027 CIRT, Santa Fe. ppt 48

$BB Sony vs. Samsung Sony © Oliver Wyman www. oliverwyman. com AJS 20101027 CIRT, Santa Fe. ppt 49

Sony vs. Samsung $BB Samsung Sony © Oliver Wyman www. oliverwyman. com AJS 20101027 CIRT, Santa Fe. ppt 50

Price Ford stock price: 2007 to 2010 2007 2008 2009 2010 Date Source: Yahoo! Finance. © Oliver Wyman www. oliverwyman. com AJS 20101027 CIRT, Santa Fe. ppt 51

EBIT Value chain profitability Tier 1 New Car Sales Auto Mfg. Ext. Warr. Fin. Used Car Sales Leasing Parts Mfg. Ins. Take-Care Prdct. Mfg. Add-On Prdct. Mfg. Parts Ret. Svcs. & Repair Energy Rental Veh. Utility Fleet Mgmt. * Source: Annual Reports, Compustat, Analyst Reports. Note: Operating margin on net value added revenue. © Oliver Wyman www. oliverwyman. com AJS 20101027 CIRT, Santa Fe. ppt 52

§ How much to collaborate? § How much to improve the customer experience? § How much turnaround energy to tap? § How quickly can I evolve my business design? © Oliver Wyman www. oliverwyman. com AJS 20101027 CIRT, Santa Fe. ppt 53

My business design Today Next Customer Selection Unique Value Proposition Profit Model Strategic Control Scope © Oliver Wyman www. oliverwyman. com AJS 20101027 CIRT, Santa Fe. ppt 54

Which would you prefer? Business Design “A” Business Design “B” Revenue $10 billion $8 billion Profit $50 million $300 million © Oliver Wyman www. oliverwyman. com AJS 20101027 CIRT, Santa Fe. ppt 55

Value Added Compete On Price In the Same Way Differently Compete © Oliver Wyman www. oliverwyman. com AJS 20101027 CIRT, Santa Fe. ppt 56

Vision of Next Decade? § Capacity § Compete/Collaborate Ratio § Creative Business Design – Compare: To other companies Today vs. 5 years ago Hassle map Revisit value chain Resource-sharing © Oliver Wyman www. oliverwyman. com AJS 20101027 CIRT, Santa Fe. ppt 57

Value Added Compete On Price In the Same Way Differently Compete © Oliver Wyman www. oliverwyman. com AJS 20101027 CIRT, Santa Fe. ppt 58

Creative Business Design © Oliver Wyman www. oliverwyman. com AJS 20101027 CIRT, Santa Fe. ppt 59

Systems economics The Customers’ Total Economic Equation “Big Box” Product “Little Box” © Oliver Wyman www. oliverwyman. com AJS 20101027 CIRT, Santa Fe. ppt 60

My Little Box/Big Box § What more should I sell? § What economic problems should I solve? My Product © Oliver Wyman www. oliverwyman. com AJS 20101027 CIRT, Santa Fe. ppt 61

Demand Matrix – Benefits and Buyers More Sales Greater Differentiation Viewing the customer through an economic lens Reduce Errors Cut Cycles Cut Capital Cut Costs Product Functionality Purchasing Engineer Agent © Oliver Wyman www. oliverwyman. com Plant Manager Business Manager Function Head C-level Executive AJS 20101027 CIRT, Santa Fe. ppt 62

Consumer “Big Box” Time Savings Affinity Reduced Uncertainty Peace of Mind Reduced Hassle Faster Response “Big Box” More Options Personalization Health/Wellness Plannability My Product Easier on Budget Excellent Experience Information Convenience Great Service “Little Box” © Oliver Wyman www. oliverwyman. com AJS 20101027 CIRT, Santa Fe. ppt 63

Using hidden assets to create new value for customers Market position: Johnson Controls R&D Design Engineering Testing Market Research Manufacturing Seats © Oliver Wyman www. oliverwyman. com Doors Instrument Panels Interiors Electronics Integration AJS 20101027 CIRT, Santa Fe. ppt 64

Using hidden assets to create new value for customers Market position: Johnson Controls R&D 15% Design Engineering Testing Market Research 3% Manufacturing Seats © Oliver Wyman www. oliverwyman. com Doors Instrument Panels Interiors Electronics Integration AJS 20101027 CIRT, Santa Fe. ppt 65

Johnson Controls: Financial performance Revenues Operating Income Market Value 1991 -2005 16 CAGR: 14% CAGR: 10% CAGR: 18% $BB $MM 12 8 4 0 1991 1996 2001 2006 AJS 20101027 CIRT, Santa Fe. ppt 66 Source: Compustat. © Oliver Wyman www. oliverwyman. com

Johnson Controls: Market value vs. components suppliers Indexed Market Value Johnson Controls Indexed Market Value (1995=100) Average of Components Manufacturers 1 Source: Compustat. , Data are for January of the year indicated. 1 Arithmetic average of the following companies: Intermet, Superior Industries, Modine Mfg, Tomkins PLC, Dana Corp, Eaton Corp. © Oliver Wyman www. oliverwyman. com AJS 20101027 CIRT, Santa Fe. ppt 67

JCI Customer selection § Purchasing agent § Senior managers Value proposition § Low-cost components § Lower fixed cost – Design staff – Capital equipment § High quality § Lower inventory § Lower system cost § Faster response Profit model § Gross margin § Multi-year/program contract Strategic control § None § Senior management relationship/information flow § Comfort Labs – Proprietary information Scope § Parts Organization structure § “Manufacturer” © Oliver Wyman www. oliverwyman. com § Systems § “Solutions provider” AJS 20101027 CIRT, Santa Fe. ppt 68

Air Liquide: Putting hidden assets to work (1991 to 2001) Supply Chain Effectiveness Energy Costs Safety & Environmental Risk Reduction Production Costs & Asset Maintenance Raw Material Cost & Supply IT systems: Tracking/Supply Chain, Remote Monitoring, … Energy efficiency & on-site waste-gas electricity generation Management of other production processes Management of all Gas (& Chemical) production processes Management of on-site Gas raw material distribution Supply of Gas raw materials Hidden Assets Leveraged: Gas production expertise Process/energy expertise Haz. Mat expertise 1 For Semiconductor Fabs only, following acquisition of TI’s chemical operations. © Oliver Wyman www. oliverwyman. com AJS 20101027 CIRT, Santa Fe. ppt 69

Air Liquide’s services strategy helped fuel strong growth Operating Profit Three-year rolling annual growth rate Revenues Year © Oliver Wyman www. oliverwyman. com AJS 20101027 CIRT, Santa Fe. ppt 70

Tetra Pak © Oliver Wyman www. oliverwyman. com AJS 20101027 CIRT, Santa Fe. ppt 71

§ Refrigeration § Logistics § Handling § Storage © Oliver Wyman www. oliverwyman. com AJS 20101027 CIRT, Santa Fe. ppt 72

§ 800 design and development specialists § 3, 000 food processing and packaging experts (engineers, microbiologists, etc. ) § Living with the customer © Oliver Wyman www. oliverwyman. com AJS 20101027 CIRT, Santa Fe. ppt 73

Tetra Pak: “Life Cycle Partnership” means long-term customer relationships Employing more than 3, 000 food processing and packaging experts, Tetra Pak helps reduce costs along the entire value chain from manufacturing to retail Food and Beverage Manufacturing: Tetra Pak’s “Life Cycle Partnership” E. g. Dairy Manufacturer Equipment upgrades & process flow improvements Channel selection Supply chain analysis Equipment selection & financing Installation & start-up Start-up training Operational fine-tuning & process flow Equipment maintenance and parts Wholesale and retail distribution process flow Operational training Tetra Pak key activities One Tetra Pak key account manager for each customer § Determine food packaging and performance objectives: – Product quality – Liters of output per hour – Sustainability targets § Determine distribution requirements : – Shipping frequency and method – Wholesale and retail shelf space – Weight constraints § Select machinery and packaging § Provide equipment financing § Management training – 15 “Train the Trainer” centers § Test machinery and factory process flow § Quality testing with distributors § Hone product quality § On-site operational and maintenance training § Increase employee productivity with professional development to maximize availability of equipment – Human error accounts for most equipment failure § Optimize parts inventory management – 4 distribution centers for parts § Optimize QC: Who does what to what equipment, when and how – Access to 65 tech service centers § Periodic factory review to avoid “if it ain’t broke, don’t fix it”mentality § Periodically obtain feedback from wholesaler and retailers § Incorporate feedback into next iteration of food processing and packaging design Source: http: //www. fao. org/ag/AGS/publications/docs/AGST_Working. Documents/J 7193_e. pdf © Oliver Wyman www. oliverwyman. com AJS 20101027 CIRT, Santa Fe. ppt 74

Project Risk © Oliver Wyman www. oliverwyman. com AJS 20101027 CIRT, Santa Fe. ppt 75

“Delusions of Success” – Harvard Business Review, July 2003 © Oliver Wyman www. oliverwyman. com AJS 20101027 CIRT, Santa Fe. ppt 76

Project risk: Failure rates § New products (food) 78% § New products (Rx) 96% § M&A 60%+ § IT projects 76% § VC/new business projects 80% © Oliver Wyman www. oliverwyman. com AJS 20101027 CIRT, Santa Fe. ppt 77

© Oliver Wyman www. oliverwyman. com AJS 20101027 CIRT, Santa Fe. ppt 78

§ Overinvest § Business design © Oliver Wyman www. oliverwyman. com AJS 20101027 CIRT, Santa Fe. ppt 79

5% “ 20 moves" to raise the odds” § § § § § 90% © Oliver Wyman www. oliverwyman. com AJS 20101027 CIRT, Santa Fe. ppt 80

The Checklist Manifesto, by Atul Gawande Chapter 3 © Oliver Wyman www. oliverwyman. com AJS 20101027 CIRT, Santa Fe. ppt 81

“Hybrid” business designs Honda Toyota Customer selection § Moderate income § High income Unique value proposition § Energy efficiency § Drive, style, electronics Profit model § Lower-margin cars § High-margin cars Strategic control § Patents § Brand evolution © Oliver Wyman www. oliverwyman. com AJS 20101027 CIRT, Santa Fe. ppt 82

“Hybrid” business design comparison Toyota Prius Lexus RX 400 h Toyota Highlander Honda Civic Honda Accord Days to sell 8 10 16 10 36 56 45 Estimated annual sales 105, 000 22, 000 20, 000 147 28, 000 20, 000 48 Premium over regular model $1, 150* $11, 110 $6, 590 $5 K $2, 790 $3, 290 $3 K Source: Business. Week. *Compared to four cylinder Camry. © Oliver Wyman www. oliverwyman. com AJS 20101027 CIRT, Santa Fe. ppt 83

The Toyota Way (Chapter 6) – Jeffrey Liker © Oliver Wyman www. oliverwyman. com AJS 20101027 CIRT, Santa Fe. ppt 84

What are three different business designs for each new growth initiative? © Oliver Wyman www. oliverwyman. com AJS 20101027 CIRT, Santa Fe. ppt 85

000 s Number of On. Star subscribers ’ 99 Revenue: $43 MM Source: Literature Searches, Harvard Business School Case N 9 602 082. © Oliver Wyman www. oliverwyman. com AJS 20101027 CIRT, Santa Fe. ppt 86

On. Star Business Design I II III Customer selection § Luxury § All GM drivers § GM and others Value proposition § “Accessory” § Safety/security § Remote diagnostics § Safety security § Remote diagnostic § Information, entertainment § Growing suite of applications Profit model § Sell more cars § Subscription § Maximum volume § Service tiers Strategic control § § Cost position/ installed base § De facto standard § Brand Go-to-market § Dealer install § Factory install, GM, and other OEMs © Oliver Wyman www. oliverwyman. com ? AJS 20101027 CIRT, Santa Fe. ppt 87

000 s Number of On. Star subscribers ’ 02 Revenue: $1 BB ’ 99 Revenue: $43 MM Source: Literature Searches, Harvard Business School Case N 9 602 082. © Oliver Wyman www. oliverwyman. com AJS 20101027 CIRT, Santa Fe. ppt 88

Tale of Two Economies © Oliver Wyman www. oliverwyman. com AJS 20101027 CIRT, Santa Fe. ppt 89

Stagnation Risk © Oliver Wyman www. oliverwyman. com AJS 20101027 CIRT, Santa Fe. ppt 90

Mystery of Demand © Oliver Wyman www. oliverwyman. com AJS 20101027 CIRT, Santa Fe. ppt 91

Building from the customer up Scope Strategic Control Profit Model Unique Value Proposition Customer Selection Demand: ambiguity of The messy the market it happen? § How does place § Why does it not? § How does it change? § Why does it always surprise us? © Oliver Wyman www. oliverwyman. com AJS 20101027 CIRT, Santa Fe. ppt 92

The Underneath-the-Surface World of Dali and Bosch © Oliver Wyman www. oliverwyman. com AJS 20101027 CIRT, Santa Fe. ppt 93

© Oliver Wyman www. oliverwyman. com AJS 20101027 CIRT, Santa Fe. ppt 94

© Oliver Wyman www. oliverwyman. com AJS 20101027 CIRT, Santa Fe. ppt 95

© Oliver Wyman www. oliverwyman. com AJS 20101027 CIRT, Santa Fe. ppt 96

© Oliver Wyman www. oliverwyman. com AJS 20101027 CIRT, Santa Fe. ppt 97

© Oliver Wyman www. oliverwyman. com AJS 20101027 CIRT, Santa Fe. ppt 98

© Oliver Wyman www. oliverwyman. com AJS 20101027 CIRT, Santa Fe. ppt 99

© Oliver Wyman www. oliverwyman. com AJS 20101027 CIRT, Santa Fe. ppt 100

© Oliver Wyman www. oliverwyman. com AJS 20101027 CIRT, Santa Fe. ppt 101

© Oliver Wyman www. oliverwyman. com AJS 20101027 CIRT, Santa Fe. ppt 102

© Oliver Wyman www. oliverwyman. com AJS 20101027 CIRT, Santa Fe. ppt 103

Proceed with Caution © Oliver Wyman www. oliverwyman. com AJS 20101027 CIRT, Santa Fe. ppt 104

What separates the winners from the rest? i. Pod vs. Zune Zipcar vs. Hertz Nespresso vs. Lavazza Kindle vs. Nook © Oliver Wyman www. oliverwyman. com AJS 20101027 CIRT, Santa Fe. ppt 105

What separates the winners from the rest? Netflix vs. Blockbuster Salesforce vs. Oracle Eurostar vs. Air France Prius vs. Honda Civic © Oliver Wyman www. oliverwyman. com AJS 20101027 CIRT, Santa Fe. ppt 106

How does this happen? 76 M Zune vs. i. Pod Air France vs. Eurostar © Oliver Wyman www. oliverwyman. com Nook vs. Kindle Blockbuster vs. Netflix Lavazza vs. Nespresso Honda Civic vs. Prius Hertz vs. Zipcar Oracle vs. Salesforce AJS 20101027 CIRT, Santa Fe. ppt 107

Masters of the Demand Equation § Nespresso § Fact. Set § Care. More (Health) § Eurostar § Dassault Systems § Salesforce. com § Netflix § Kindle by Amazon § Bloomberg § Tetra Pak § Bang & Olufsen § Pret A Manger § Zipcar § On. Star by GM § Facebook § Growing Power § Apple § Capital IQ § Wegman’s § Capital One § Virgin Atlantic © Oliver Wyman www. oliverwyman. com AJS 20101027 CIRT, Santa Fe. ppt 108

The Demand Equation How magnetic? Behind the screen: Are all pieces in place? Response rate drivers How fast are we getting better? How many different types ? © Oliver Wyman www. oliverwyman. com AJS 20101027 CIRT, Santa Fe. ppt 109
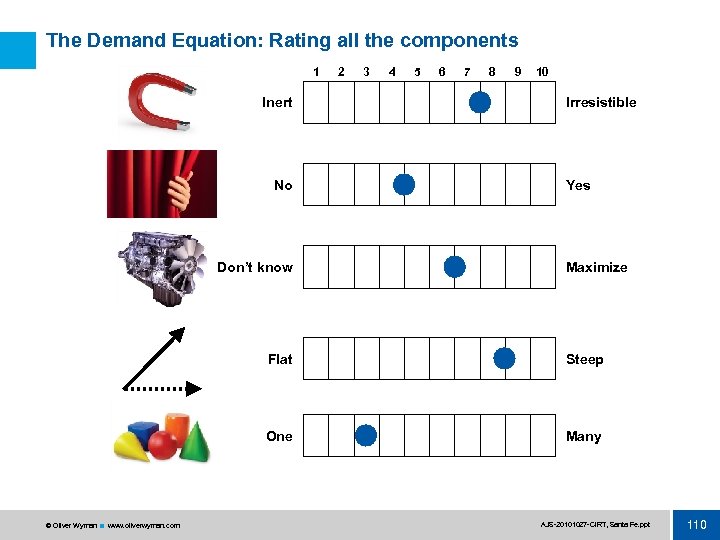
The Demand Equation: Rating all the components 1 Inert No Don’t know 2 3 4 5 6 7 8 9 10 Irresistible Yes Maximize Flat One © Oliver Wyman www. oliverwyman. com Steep Many AJS 20101027 CIRT, Santa Fe. ppt 110
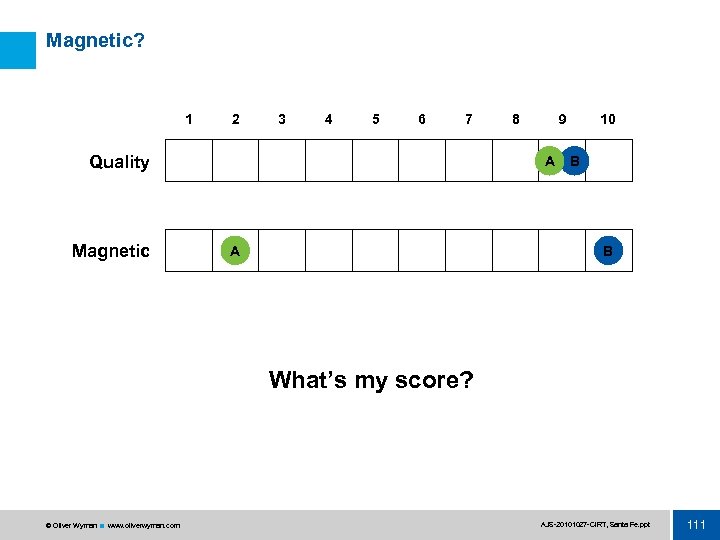
Magnetic? 1 2 3 4 5 6 7 Quality Magnetic 8 9 A A 10 B B What’s my score? © Oliver Wyman www. oliverwyman. com AJS 20101027 CIRT, Santa Fe. ppt 111
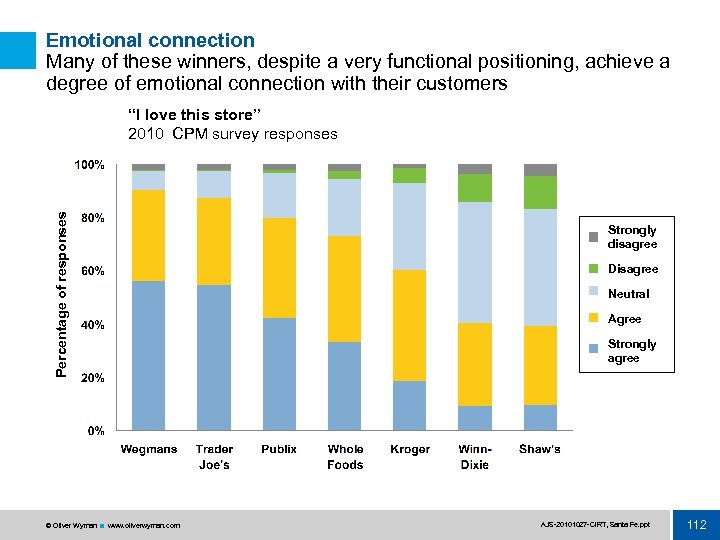
Emotional connection Many of these winners, despite a very functional positioning, achieve a degree of emotional connection with their customers Percentage of responses “I love this store” 2010 CPM survey responses © Oliver Wyman www. oliverwyman. com Strongly disagree Disagree Neutral Agree Strongly agree AJS 20101027 CIRT, Santa Fe. ppt 112
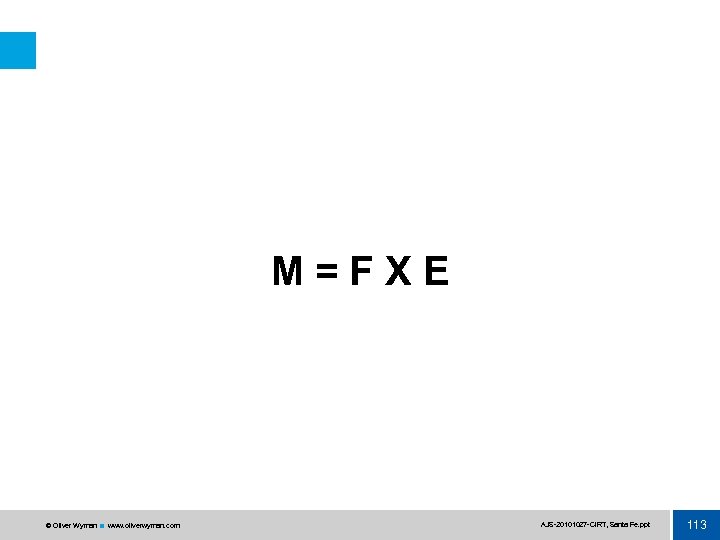
M=FXE © Oliver Wyman www. oliverwyman. com AJS 20101027 CIRT, Santa Fe. ppt 113
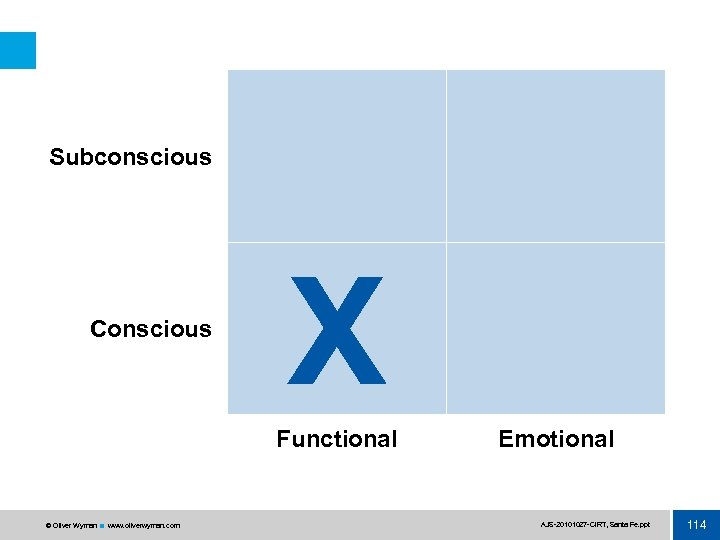
Subconscious Conscious X Functional © Oliver Wyman www. oliverwyman. com Emotional AJS 20101027 CIRT, Santa Fe. ppt 114
Not first mover, but … © Oliver Wyman www. oliverwyman. com First to create and capture the emotional space. AJS 20101027 CIRT, Santa Fe. ppt 115
Biggest Mistake #1 Stopping before we get to magnetic © Oliver Wyman www. oliverwyman. com AJS 20101027 CIRT, Santa Fe. ppt 116
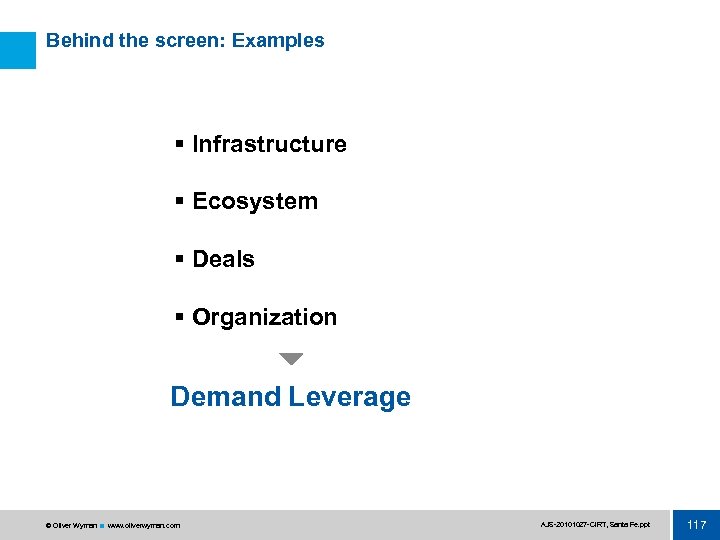
Behind the screen: Examples § Infrastructure § Ecosystem § Deals § Organization Demand Leverage © Oliver Wyman www. oliverwyman. com AJS 20101027 CIRT, Santa Fe. ppt 117
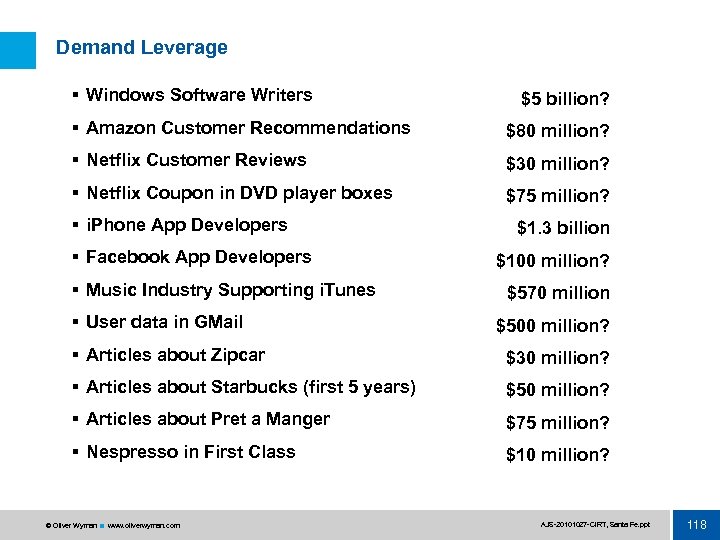
Demand Leverage § Windows Software Writers $5 billion? § Amazon Customer Recommendations $80 million? § Netflix Customer Reviews $30 million? § Netflix Coupon in DVD player boxes $75 million? § i. Phone App Developers § Facebook App Developers § Music Industry Supporting i. Tunes § User data in GMail $1. 3 billion $100 million? $570 million $500 million? § Articles about Zipcar $30 million? § Articles about Starbucks (first 5 years) $50 million? § Articles about Pret a Manger $75 million? § Nespresso in First Class $10 million? © Oliver Wyman www. oliverwyman. com AJS 20101027 CIRT, Santa Fe. ppt 118
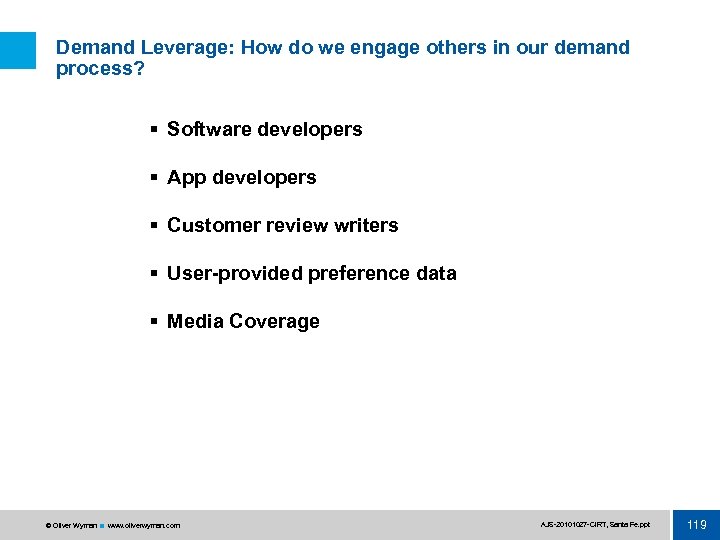
Demand Leverage: How do we engage others in our demand process? § Software developers § App developers § Customer review writers § User-provided preference data § Media Coverage © Oliver Wyman www. oliverwyman. com AJS 20101027 CIRT, Santa Fe. ppt 119
Biggest Mistake #2 Assuming magnetic is enough © Oliver Wyman www. oliverwyman. com AJS 20101027 CIRT, Santa Fe. ppt 120
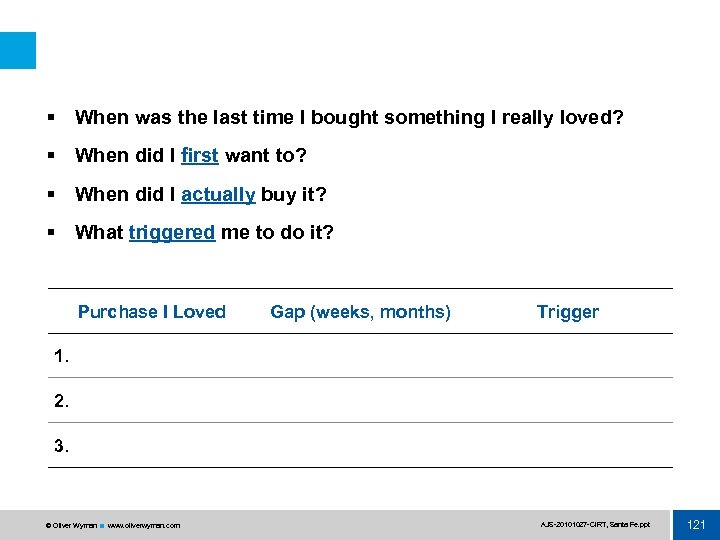
§ When was the last time I bought something I really loved? § When did I first want to? § When did I actually buy it? § What triggered me to do it? Purchase I Loved Gap (weeks, months) Trigger 1. 2. 3. © Oliver Wyman www. oliverwyman. com AJS 20101027 CIRT, Santa Fe. ppt 121
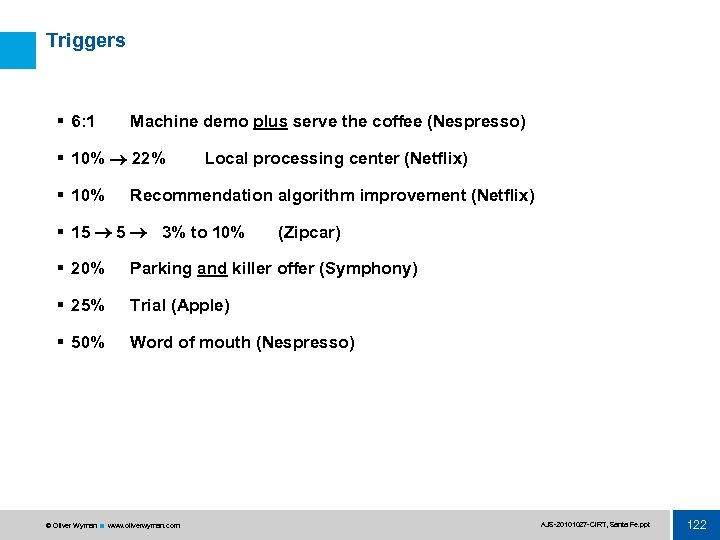
Triggers § 6: 1 Machine demo plus serve the coffee (Nespresso) § 10% 22% § 10% Local processing center (Netflix) Recommendation algorithm improvement (Netflix) § 15 5 3% to 10% (Zipcar) § 20% Parking and killer offer (Symphony) § 25% Trial (Apple) § 50% Word of mouth (Nespresso) © Oliver Wyman www. oliverwyman. com AJS 20101027 CIRT, Santa Fe. ppt 122
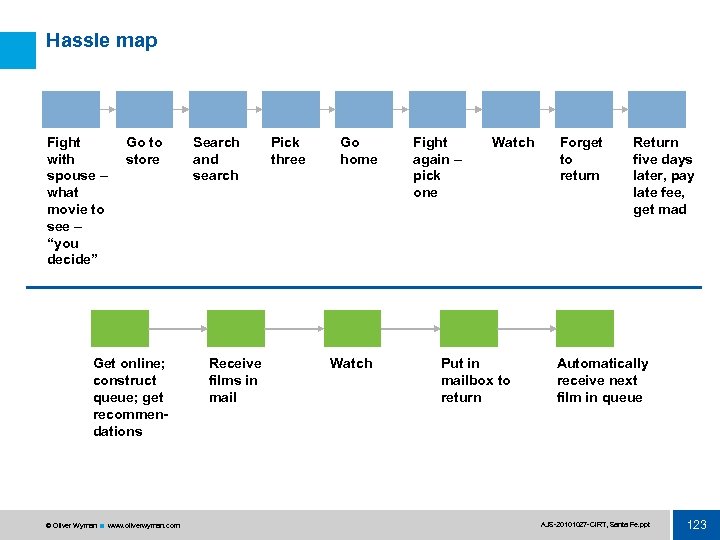
Hassle map Fight with spouse – what movie to see – “you decide” Go to store Get online; construct queue; get recommendations © Oliver Wyman www. oliverwyman. com Search and search Receive films in mail Pick three Go home Watch Fight again – pick one Watch Put in mailbox to return Forget to return Return five days later, pay late fee, get mad Automatically receive next film in queue AJS 20101027 CIRT, Santa Fe. ppt 123
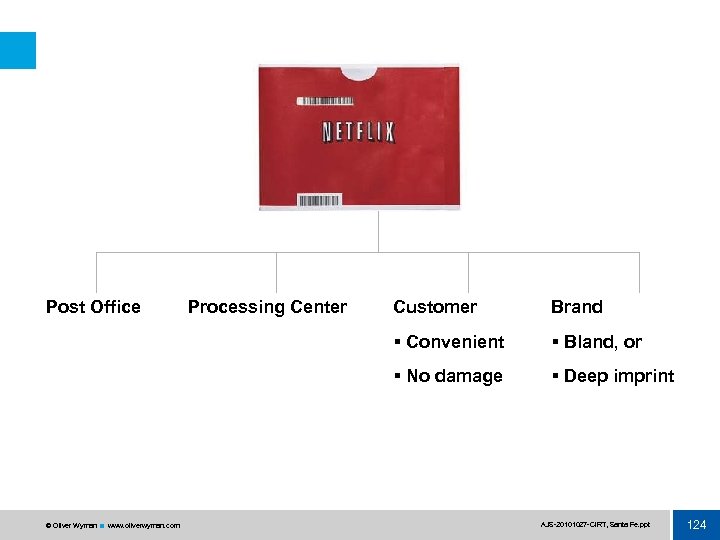
Post Office Customer Brand § Convenient § Bland, or § No damage © Oliver Wyman www. oliverwyman. com Processing Center § Deep imprint AJS 20101027 CIRT, Santa Fe. ppt 124
Non-Obvious Response Rate Drivers? © Oliver Wyman www. oliverwyman. com AJS 20101027 CIRT, Santa Fe. ppt 125
§ Word of mouth § 99. 9 percent § Recommendation engine § Processing centers (4 1) © Oliver Wyman www. oliverwyman. com AJS 20101027 CIRT, Santa Fe. ppt 126
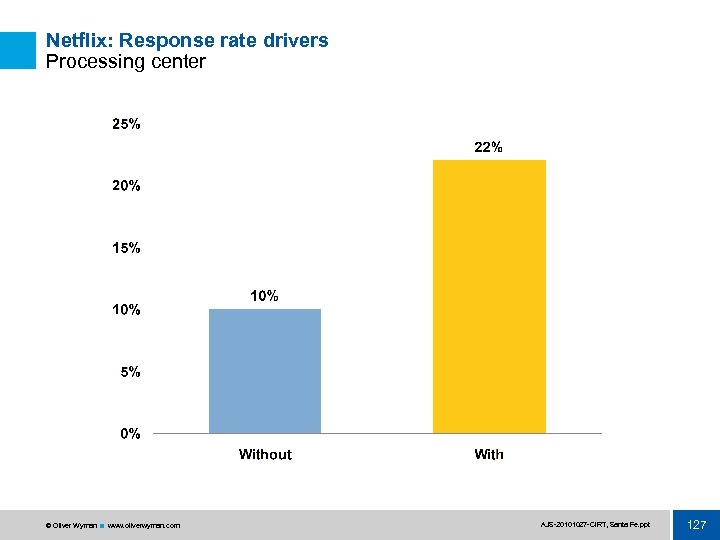
Netflix: Response rate drivers Processing center © Oliver Wyman www. oliverwyman. com AJS 20101027 CIRT, Santa Fe. ppt 127
© Oliver Wyman www. oliverwyman. com AJS 20101027 CIRT, Santa Fe. ppt 128
When you’ve won, you can: a) Coast b) Keep it dynamic © Oliver Wyman www. oliverwyman. com AJS 20101027 CIRT, Santa Fe. ppt 129
Dynamic § “Get better fast” § Meaningful variation You take an idea, and develop it to its full potential © Oliver Wyman www. oliverwyman. com AJS 20101027 CIRT, Santa Fe. ppt 130
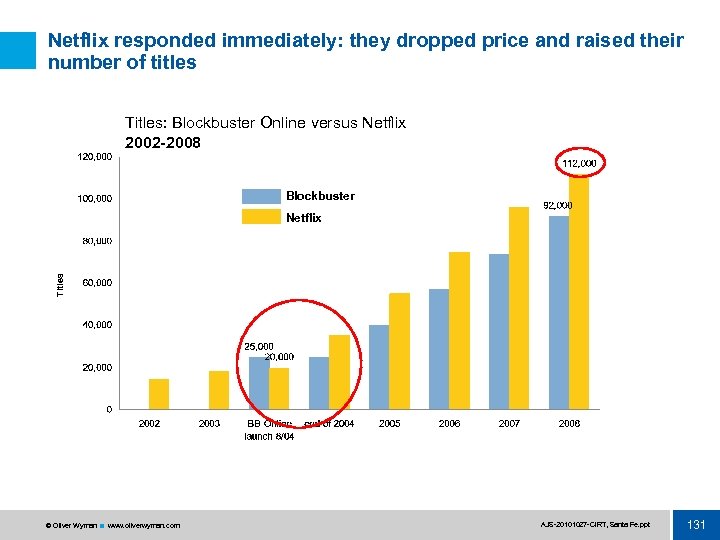
Netflix responded immediately: they dropped price and raised their number of titles Titles: Blockbuster Online versus Netflix 2002 -2008 Blockbuster Titles Netflix © Oliver Wyman www. oliverwyman. com AJS 20101027 CIRT, Santa Fe. ppt 131
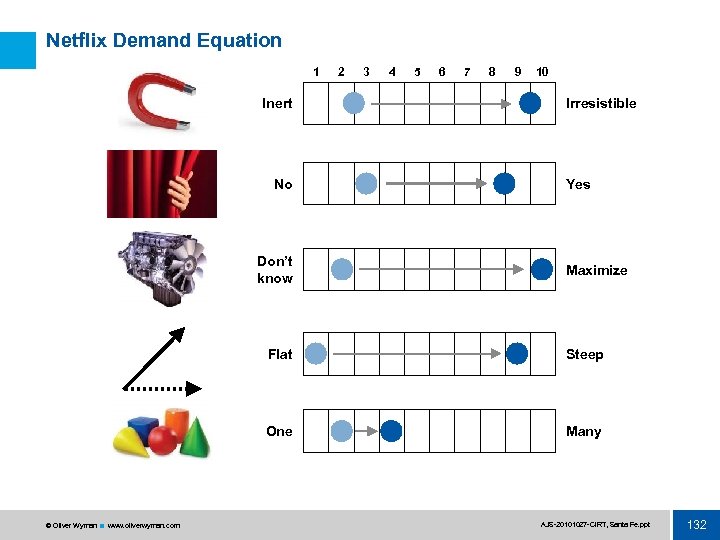
Netflix Demand Equation 1 Inert No Don’t know 2 3 4 5 6 7 8 9 10 Irresistible Yes Maximize Flat One © Oliver Wyman www. oliverwyman. com Steep Many AJS 20101027 CIRT, Santa Fe. ppt 132
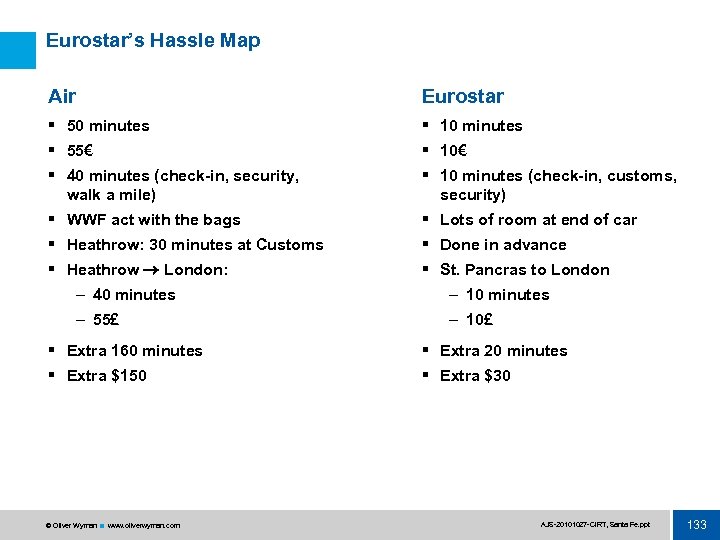
Eurostar’s Hassle Map Air Eurostar § 50 minutes § 10 minutes § 55€ § 10€ § 40 minutes (check-in, security, walk a mile) § 10 minutes (check-in, customs, security) § WWF act with the bags § Lots of room at end of car § Heathrow: 30 minutes at Customs § Done in advance § Heathrow London: § St. Pancras to London – 40 minutes – 10 minutes – 55£ – 10£ § Extra 160 minutes § Extra 20 minutes § Extra $150 § Extra $30 © Oliver Wyman www. oliverwyman. com AJS 20101027 CIRT, Santa Fe. ppt 133
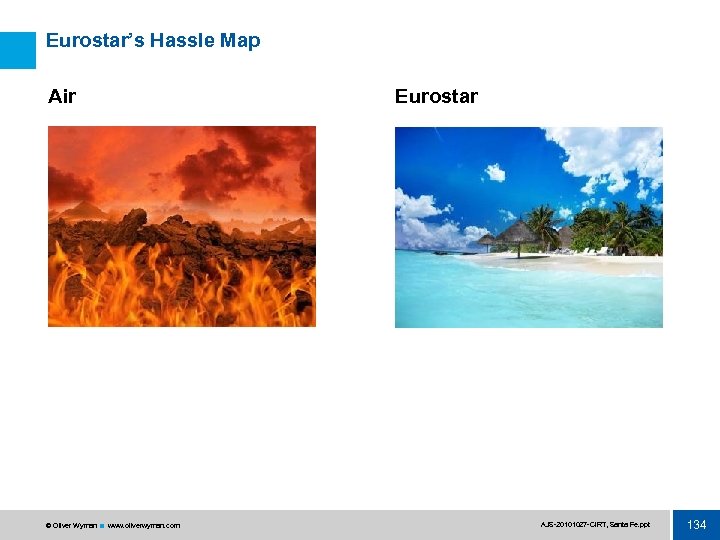
Eurostar’s Hassle Map Air © Oliver Wyman www. oliverwyman. com Eurostar AJS 20101027 CIRT, Santa Fe. ppt 134
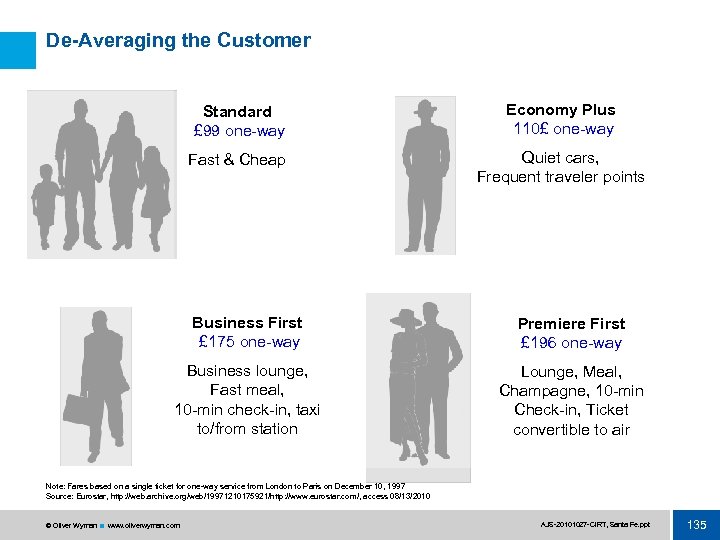
De-Averaging the Customer Standard £ 99 one way Economy Plus 110£ one way Fast & Cheap Quiet cars, Frequent traveler points Business First £ 175 one way Premiere First £ 196 one way Business lounge, Fast meal, 10 min check in, taxi to/from station Lounge, Meal, Champagne, 10 min Check in, Ticket convertible to air Note: Fares based on a single ticket for one way service from London to Paris on December 10, 1997 Source: Eurostar, http: //web. archive. org/web/19971210175921/http: //www. eurostar. com/, access 08/13/2010 © Oliver Wyman www. oliverwyman. com AJS 20101027 CIRT, Santa Fe. ppt 135
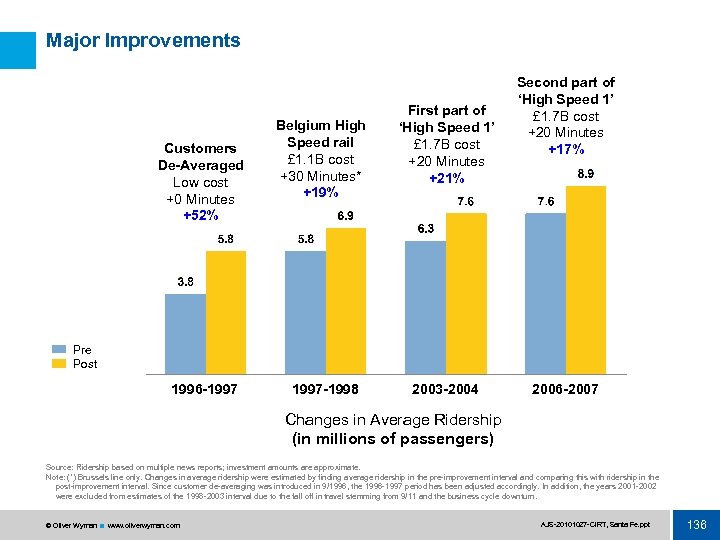
Major Improvements Customers De-Averaged Low cost +0 Minutes +52% Belgium High Speed rail £ 1. 1 B cost +30 Minutes* +19% First part of ‘High Speed 1’ £ 1. 7 B cost +20 Minutes +21% Second part of ‘High Speed 1’ £ 1. 7 B cost +20 Minutes +17% Pre Post 1996 -1997 -1998 2003 -2004 2006 -2007 Changes in Average Ridership (in millions of passengers) Source: Ridership based on multiple news reports; investment amounts are approximate. Note: (*) Brussels line only. Changes in average ridership were estimated by finding average ridership in the pre improvement interval and comparing this with ridership in the post improvement interval. Since customer de averaging was introduced in 9/1996, the 1996 1997 period has been adjusted accordingly. In addition, the years 2001 2002 were excluded from estimates of the 1998 2003 interval due to the fall off in travel stemming from 9/11 and the business cycle downturn. © Oliver Wyman www. oliverwyman. com AJS 20101027 CIRT, Santa Fe. ppt 136
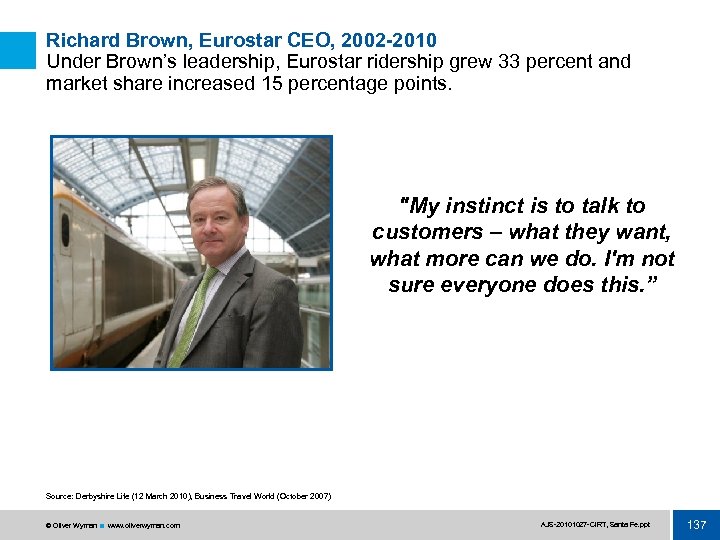
Richard Brown, Eurostar CEO, 2002 -2010 Under Brown’s leadership, Eurostar ridership grew 33 percent and market share increased 15 percentage points. "My instinct is to talk to customers – what they want, what more can we do. I'm not sure everyone does this. ” Source: Derbyshire Life (12 March 2010), Business Travel World (October 2007) © Oliver Wyman www. oliverwyman. com AJS 20101027 CIRT, Santa Fe. ppt 137
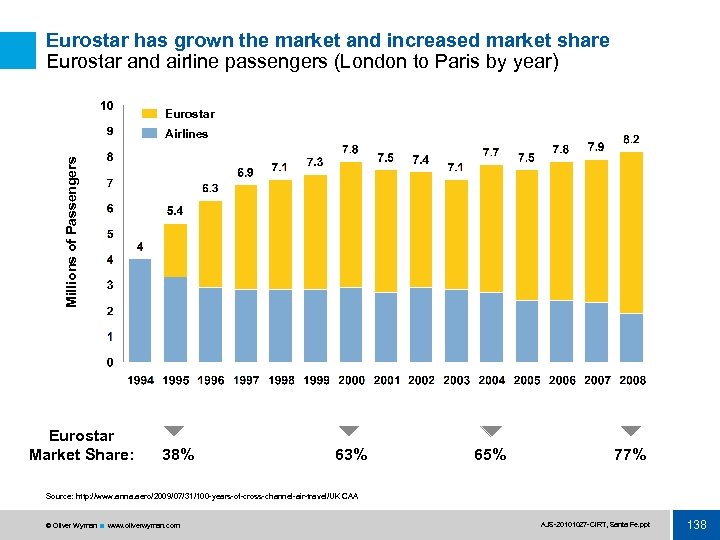
Eurostar has grown the market and increased market share Eurostar and airline passengers (London to Paris by year) Eurostar Millions of Passengers Airlines Eurostar Market Share: 38% 63% 65% 77% Source: http: //www. anna. aero/2009/07/31/100 years of cross channel air travel/UK CAA © Oliver Wyman www. oliverwyman. com AJS 20101027 CIRT, Santa Fe. ppt 138
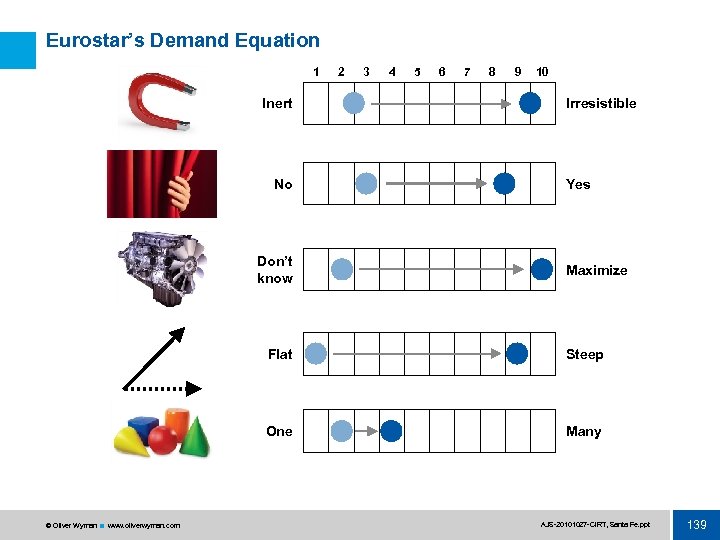
Eurostar’s Demand Equation 1 Inert No Don’t know 2 3 4 5 6 7 8 9 10 Irresistible Yes Maximize Flat One © Oliver Wyman www. oliverwyman. com Steep Many AJS 20101027 CIRT, Santa Fe. ppt 139
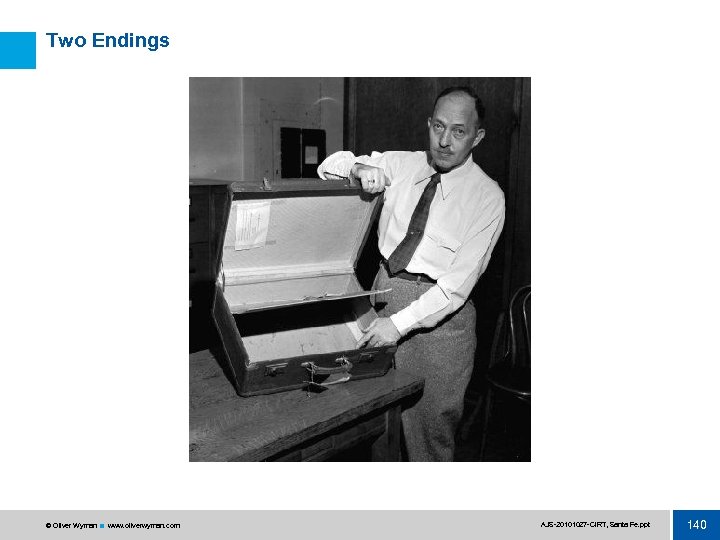
Two Endings © Oliver Wyman www. oliverwyman. com AJS 20101027 CIRT, Santa Fe. ppt 140
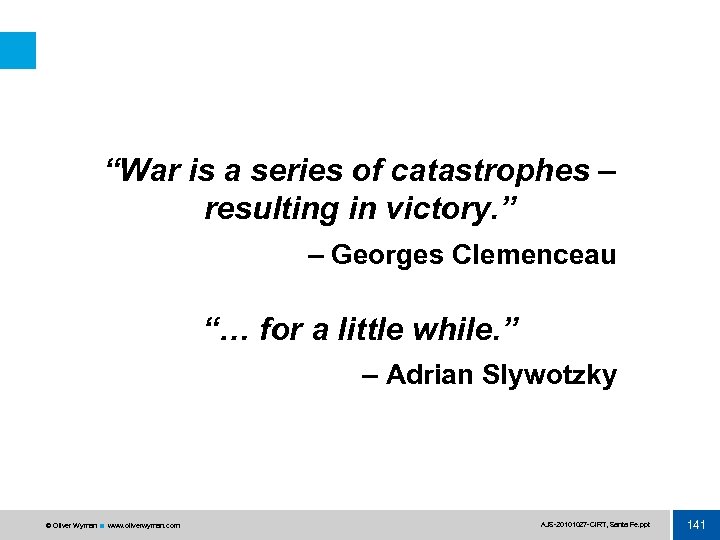
“War is a series of catastrophes – resulting in victory. ” – Georges Clemenceau “… for a little while. ” – Adrian Slywotzky © Oliver Wyman www. oliverwyman. com AJS 20101027 CIRT, Santa Fe. ppt 141
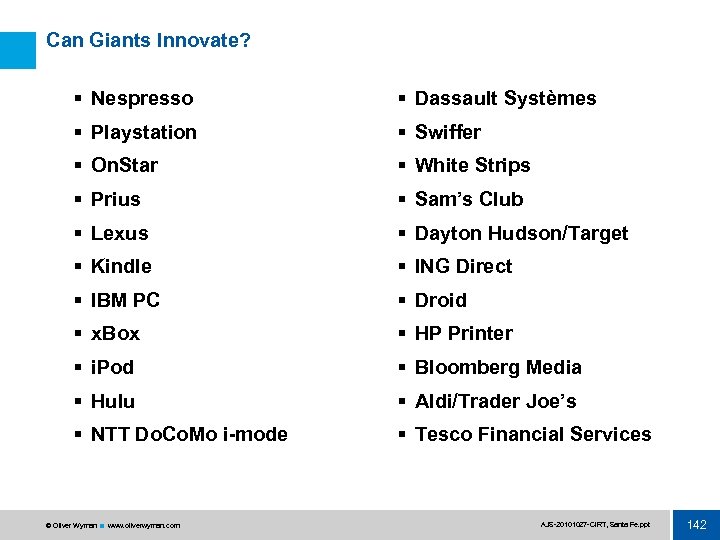
Can Giants Innovate? § Nespresso § Dassault Systèmes § Playstation § Swiffer § On. Star § White Strips § Prius § Sam’s Club § Lexus § Dayton Hudson/Target § Kindle § ING Direct § IBM PC § Droid § x. Box § HP Printer § i. Pod § Bloomberg Media § Hulu § Aldi/Trader Joe’s § NTT Do. Co. Mo i-mode § Tesco Financial Services © Oliver Wyman www. oliverwyman. com AJS 20101027 CIRT, Santa Fe. ppt 142
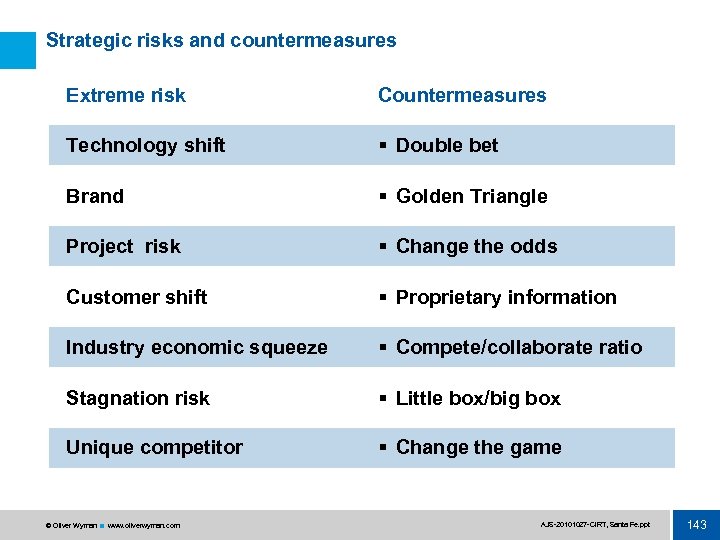
Strategic risks and countermeasures Extreme risk Countermeasures Technology shift § Double bet Brand § Golden Triangle Project risk § Change the odds Customer shift § Proprietary information Industry economic squeeze § Compete/collaborate ratio Stagnation risk § Little box/big box Unique competitor § Change the game © Oliver Wyman www. oliverwyman. com AJS 20101027 CIRT, Santa Fe. ppt 143
Technology Shift © Oliver Wyman www. oliverwyman. com AJS 20101027 CIRT, Santa Fe. ppt 144
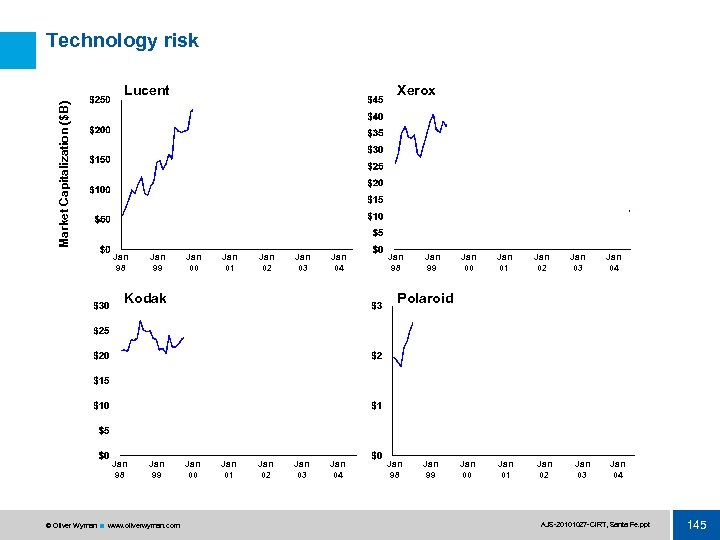
Technology risk Xerox Market Capitalization ($B) Lucent Jan 98 Jan 99 Jan 00 Jan 01 Jan 02 Jan 03 Jan 04 Kodak Jan 98 Jan 99 © Oliver Wyman www. oliverwyman. com Jan 98 Jan 99 Jan 00 Jan 01 Jan 02 Jan 03 Jan 04 Polaroid Jan 00 Jan 01 Jan 02 Jan 03 Jan 04 Jan 98 Jan 99 Jan 02 Jan 03 Jan 04 AJS 20101027 CIRT, Santa Fe. ppt 145
© Oliver Wyman www. oliverwyman. com AJS 20101027 CIRT, Santa Fe. ppt 146
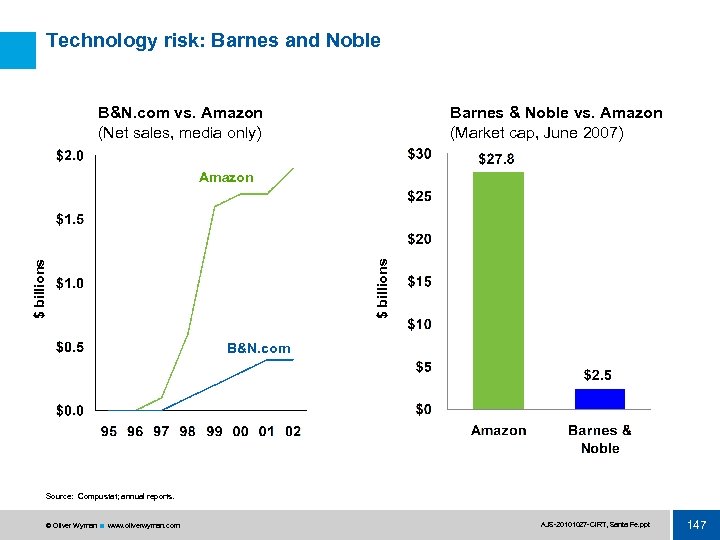
Technology risk: Barnes and Noble B&N. com vs. Amazon (Net sales, media only) Barnes & Noble vs. Amazon (Market cap, June 2007) $ billions Amazon B&N. com Source: Compustat; annual reports. © Oliver Wyman www. oliverwyman. com AJS 20101027 CIRT, Santa Fe. ppt 147
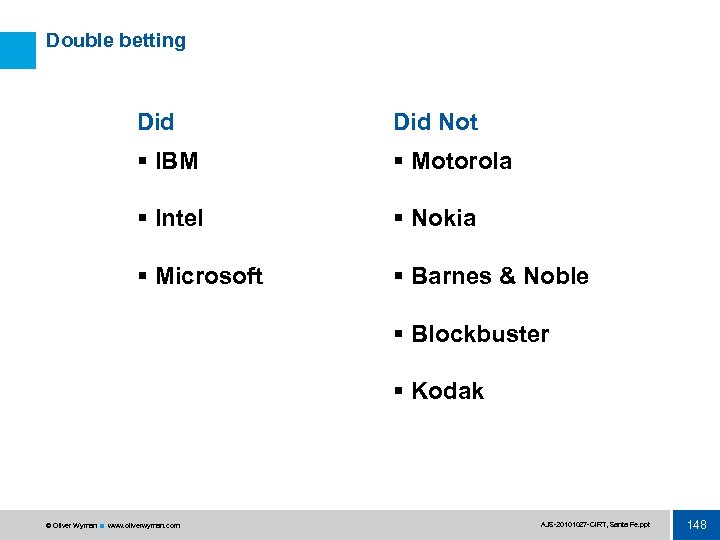
Double betting Did Not § IBM § Motorola § Intel § Nokia § Microsoft § Barnes & Noble § Blockbuster § Kodak © Oliver Wyman www. oliverwyman. com AJS 20101027 CIRT, Santa Fe. ppt 148
“When you come to a fork in the road, take it. ” – Yogi Berra © Oliver Wyman www. oliverwyman. com AJS 20101027 CIRT, Santa Fe. ppt 149
Brand Risk © Oliver Wyman www. oliverwyman. com AJS 20101027 CIRT, Santa Fe. ppt 150
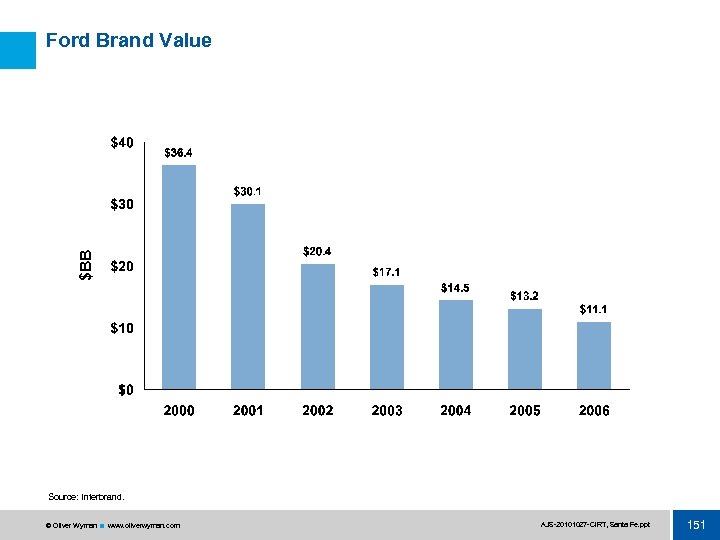
$BB Ford Brand Value Source: Interbrand. © Oliver Wyman www. oliverwyman. com AJS 20101027 CIRT, Santa Fe. ppt 151
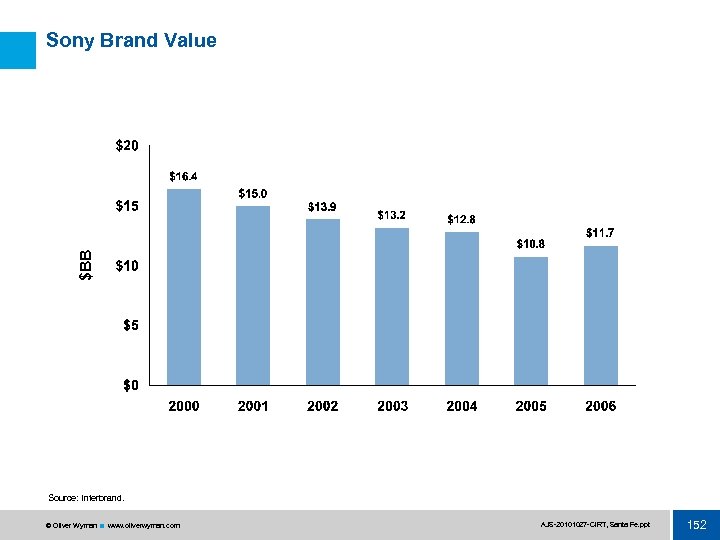
$BB Sony Brand Value Source: Interbrand. © Oliver Wyman www. oliverwyman. com AJS 20101027 CIRT, Santa Fe. ppt 152
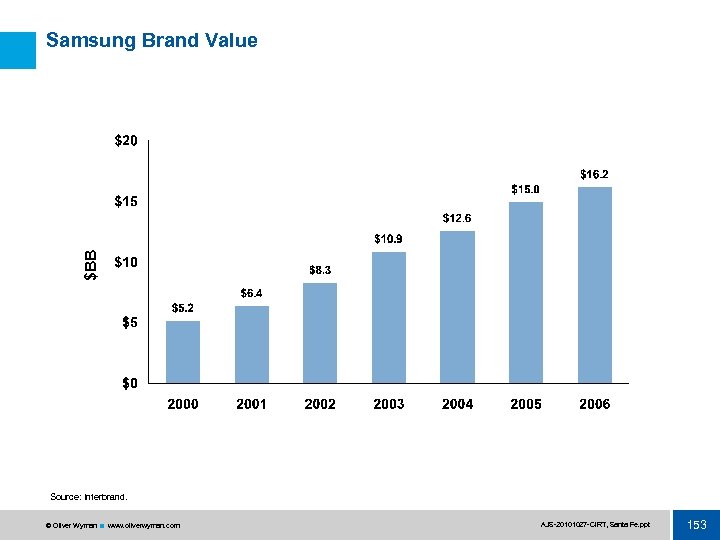
$BB Samsung Brand Value Source: Interbrand. © Oliver Wyman www. oliverwyman. com AJS 20101027 CIRT, Santa Fe. ppt 153
© Oliver Wyman www. oliverwyman. com AJS 20101027 CIRT, Santa Fe. ppt 154
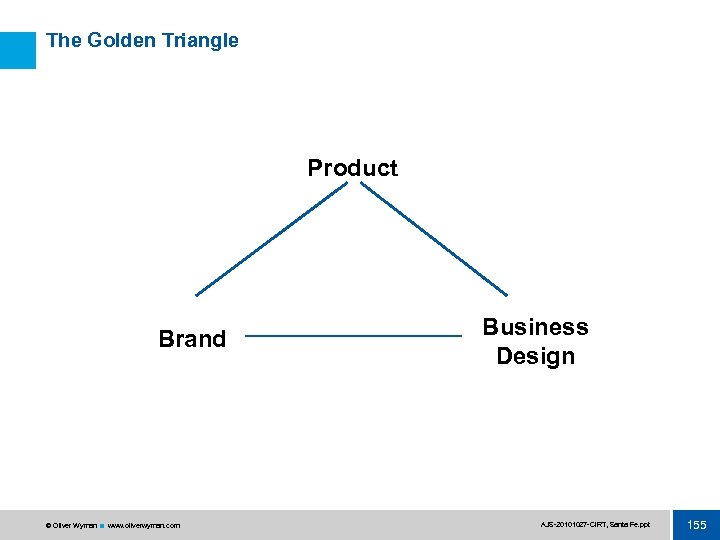
The Golden Triangle Product Brand © Oliver Wyman www. oliverwyman. com Business Design AJS 20101027 CIRT, Santa Fe. ppt 155
Customer Shift © Oliver Wyman www. oliverwyman. com AJS 20101027 CIRT, Santa Fe. ppt 156
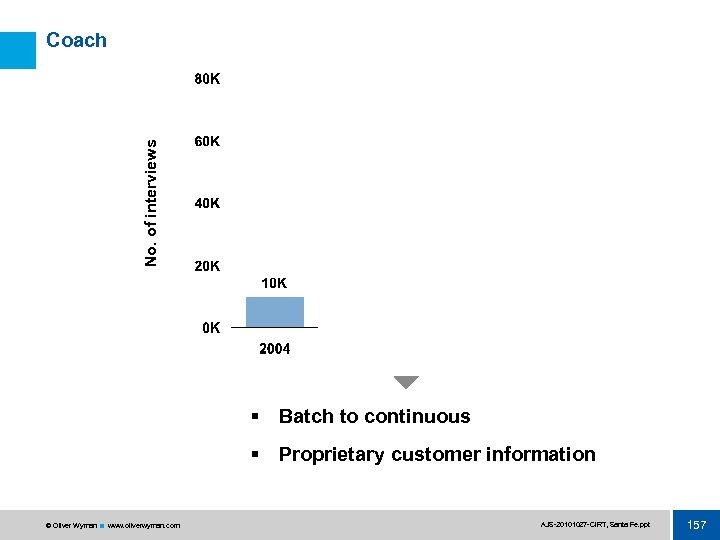
No. of interviews Coach § Batch to continuous § Proprietary customer information © Oliver Wyman www. oliverwyman. com AJS 20101027 CIRT, Santa Fe. ppt 157
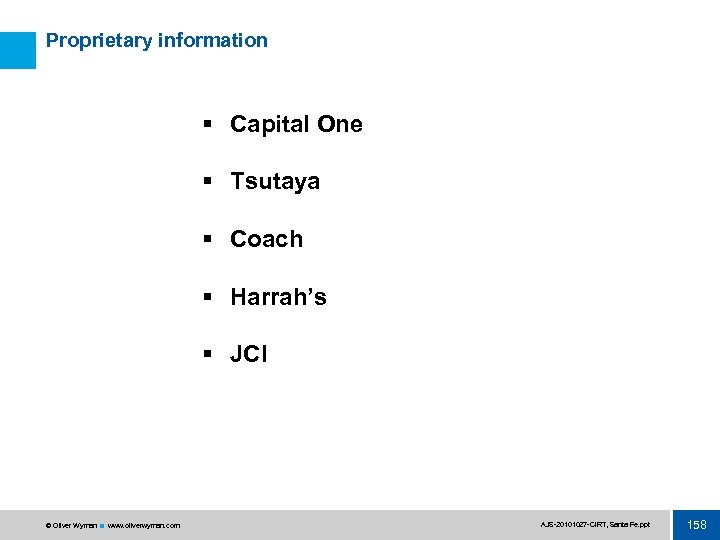
Proprietary information § Capital One § Tsutaya § Coach § Harrah’s § JCI © Oliver Wyman www. oliverwyman. com AJS 20101027 CIRT, Santa Fe. ppt 158
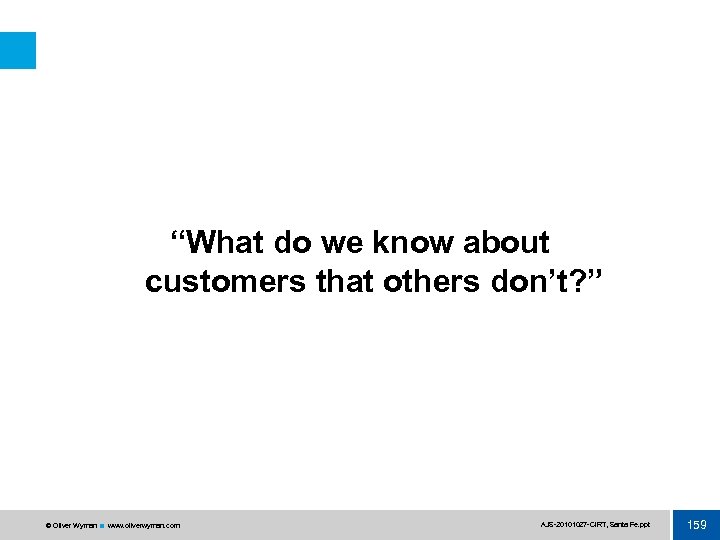
“What do we know about customers that others don’t? ” © Oliver Wyman www. oliverwyman. com AJS 20101027 CIRT, Santa Fe. ppt 159
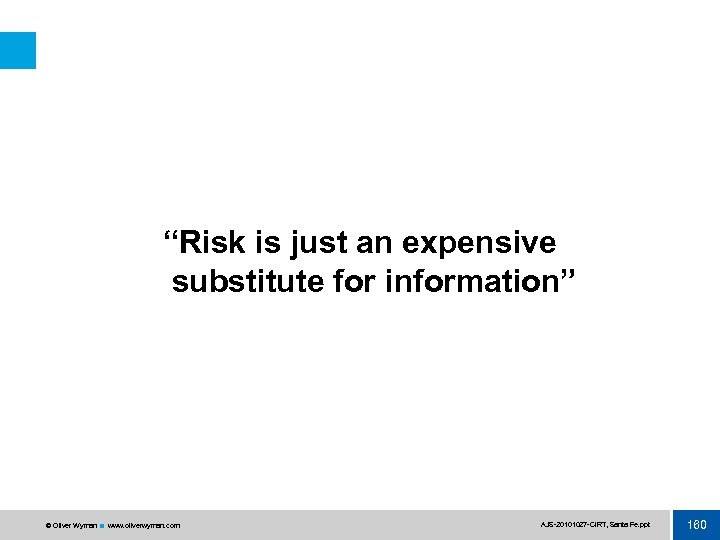
“Risk is just an expensive substitute for information” © Oliver Wyman www. oliverwyman. com AJS 20101027 CIRT, Santa Fe. ppt 160
© Oliver Wyman www. oliverwyman. com AJS 20101027 CIRT, Santa Fe. ppt 161
4e2780fd5e2175da638fd0be01c6469d.ppt