22e7993bdc1436246816dff174e31023.ppt
- Количество слайдов: 39


Ocean Renewable Energy: Overview & Progress Moo-Hyun Kim Professor Ocean Engineering Program Dept. of Civil Engineering Texas A&M University

Fossil Fuels • US oil consumption = 25% • US oil production = 3% • More than 70% oil imported • Energy Independence: #1 Economy, Security

Ocean Renewable Energy • Wave • Wind • Current • Tide • OTEC • Salinity (Osmotic Pressure)
 Coal & Oil 3 -5 Nuclear 11 -14 Hydro 4")
Ex. Relative Cost (cents/kwh) Coal & Oil 3 -5 Nuclear 11 -14 Hydro 4 -10 bio 6 -11 Wind 5 -7 (6 -8) Wave 7 -9 Solar 10 -15

Wave & tidal power distribution

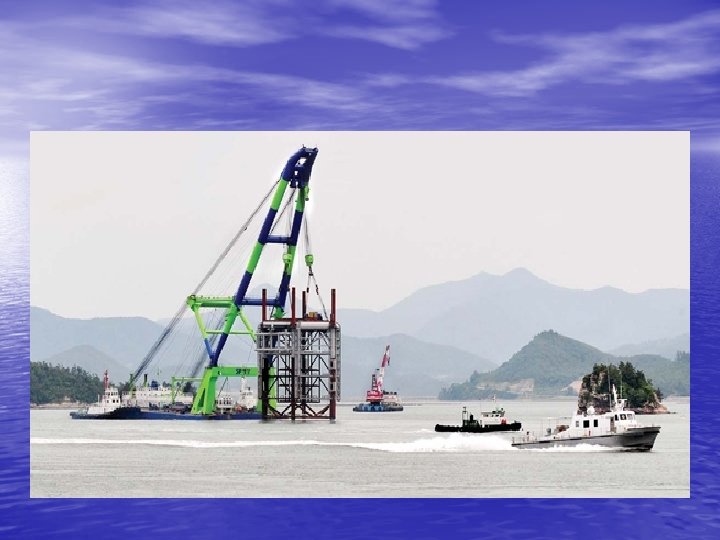
Man-made Tidal Energy Plant France La Rance dam and typical turbine/generator configuration: environmental concern

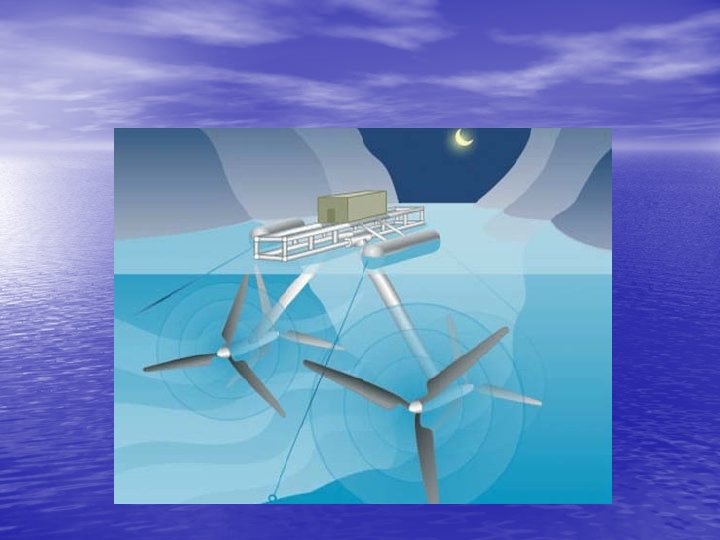
Natural Tidal-Current Energy Promising West Coast Sites

Natural Current Power: Korea

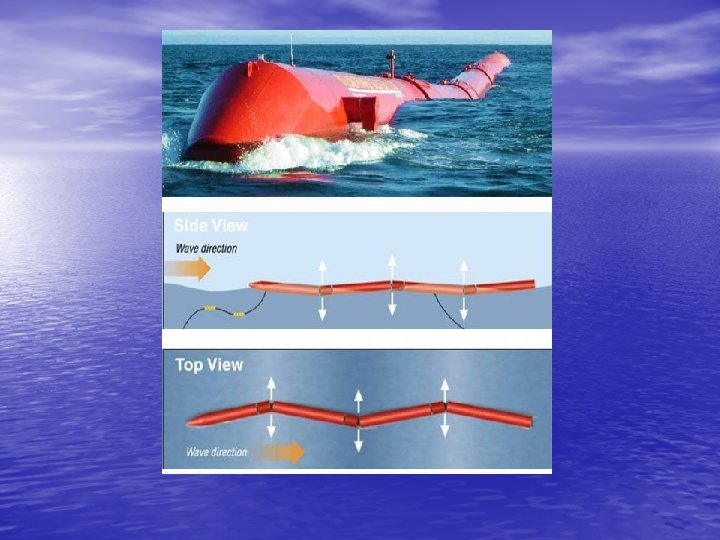
Wave Enegy Resource 2 TW of energy, the equivalent of twice the world’s electricity production, could be harvested from the world’s oceans

Wave Energy Conversion Fixed Oscillating Water Column Floating Overtopping Floating Attenuator Floating Point Absorber

Land-based OWC Oscillating Water Column Islay, Scotland

Wind Energy

2007 Wind Energy Use • Worldwide Wind Total=74 GW Less than 1% of the global electricity use Rapidly Growing Green-Wind Industry: Annual Growth Rate = 25%

Winner of 2006: US, Ger, India, Spain

Texas Wind Energy Projection

Wind Energy Pros & Cons Pros • Endless/renewable • No CO 2 Emission • No Land Space (Offshore) • No cooling, No pollution, No waste Cons • Noise, Shade, Unsightly, Birds • Survive? Severe Environment (Offshore)

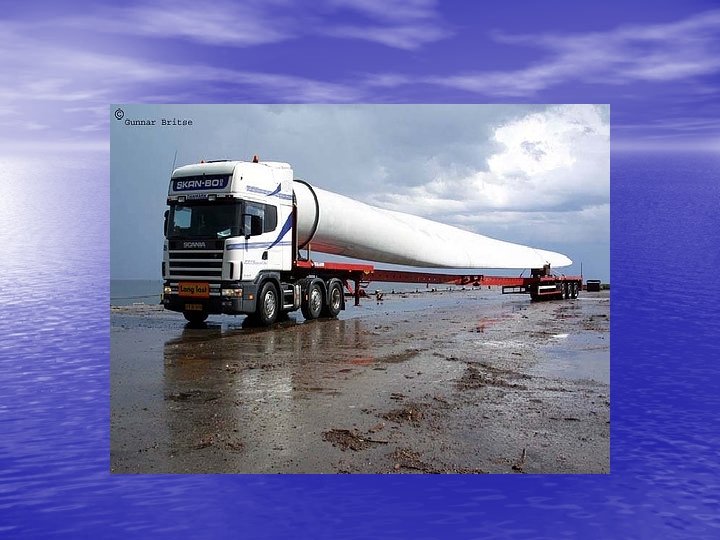
Wind-Energy Turbine
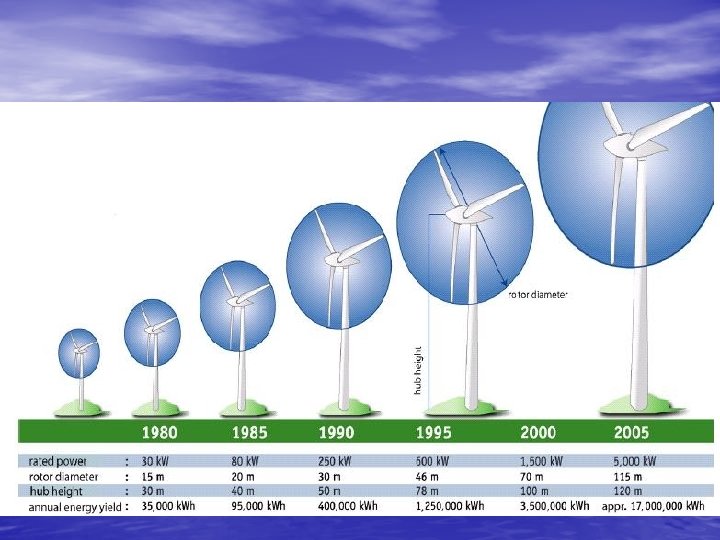
 height (m) 70 55 Power")
Feasibility/Economy grows with blade size Blade Hub Dia (m) height (m) 70 55 Power (MW) 1. 6 Ref (# of homes) 500 100 70 3. 6 1200 120 80 5 1600

What 500 -MW Wind-E Farm Can Do! • Provide clean energy for 160 K homes • Eliminating (per year) - 60 -mil lb of CO 2 (leading green-house gas) - 130 K lb of NOx (main comp. of smog) - 300 K lb of Sulfur Dioxide (leading precursor of acid rain)

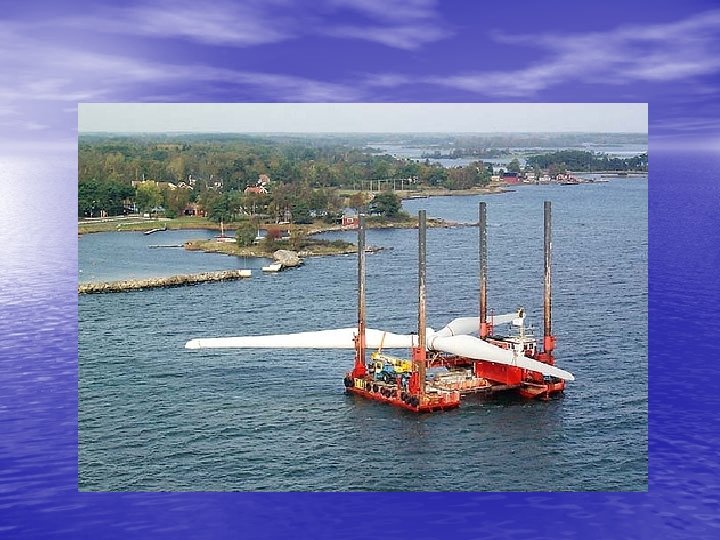
Why Offshore Wind-Farm? Future • Stronger-steadier quality wind (20 -30% better • • wind, 30 -40% more cost) More space Easier regulatory approval Less noise constraint (operable at higher speed) No visual pollution
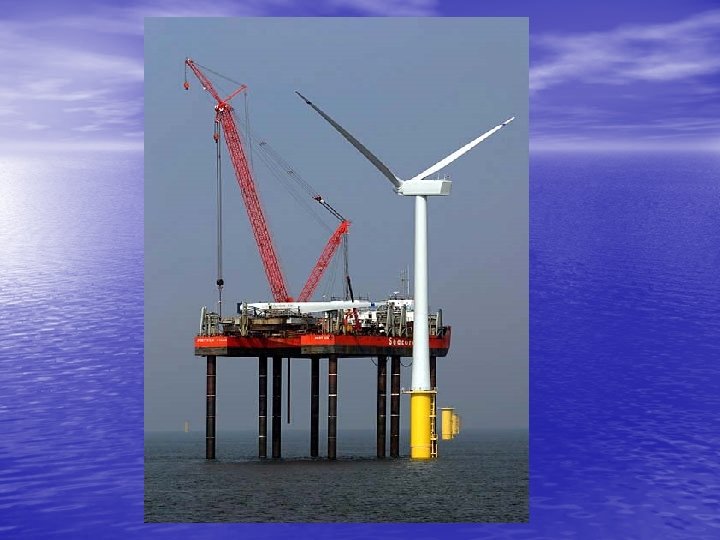
 44 m depth 5 mw")
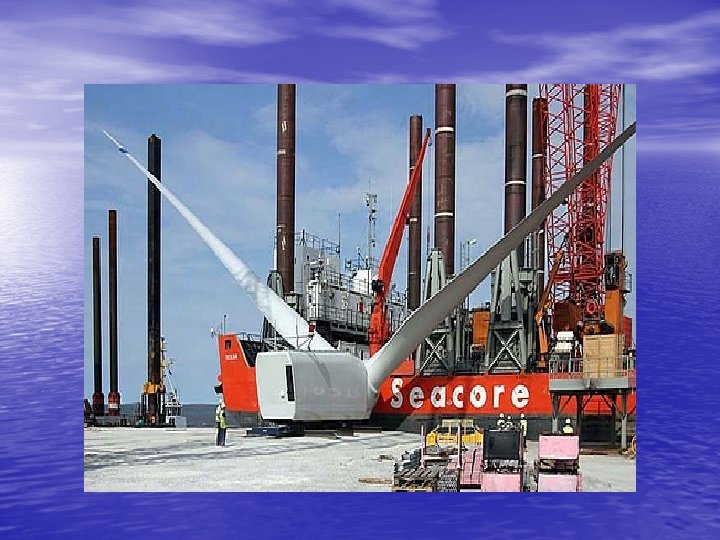
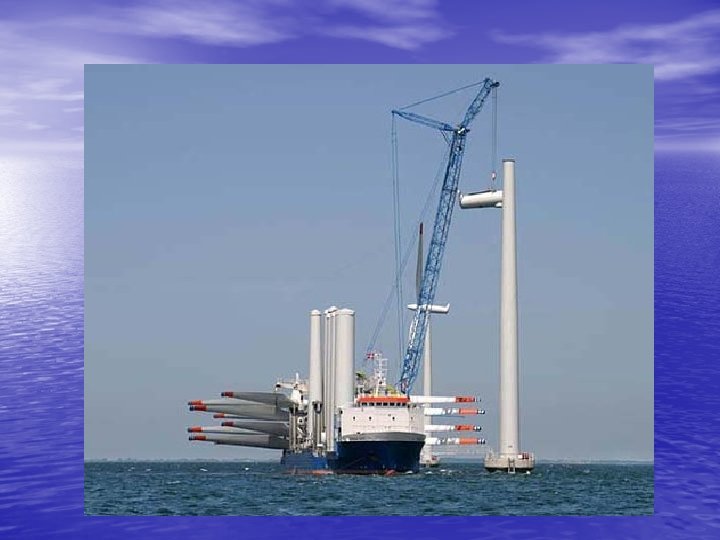
Offshore Wind Energy: stronger-steadier REpower - Scotland Fixed (tower) 44 m depth 5 mw 126 m rotor diameter Norskhydro - Norway Floating (spar) >200 m 3 mw demo unit underway 90 m rotor diameter

Various Types of Floating WF

Status of Offshore Wind Current Future - 2010 § Offshore ~900 MW of 75, 000 MW+ world-wide – less than § 2% 11, 000 MW+ offshore is projected for 2010

Wind Energy Cost Trends 1981: 40 cents/k. Wh • Increased Turbine Size • R&D Advances 2007: 9 -12 cents/k. Wh • Manufacturing Improvements • Multi-megawatt Turbines • High reliability systems • Infrastructure Improvements Land-based Class 4 2007: 5 - 9 cents/k. Wh 2012: 3. 6 cents/k. Wh? Offshore Class 6 2014: 5 cents/k. Wh

KEY: Synergy & Storage 3 times more valuable if provided on demand

Synergy with Fish Farm

Structural Failure!

Floating Wind-F: Dynamic/Fatigue Failure • Rotor dynamics and control • Platform motions and mooring dynamics

Questions?

22e7993bdc1436246816dff174e31023.ppt