

7c2a42fe4cd8317016c14f62a7c3e7b6.ppt
- Количество слайдов: 55
 NYS-DOH Report of PCI 2011 -13 Data on Top 10 Volume Centers in NY State 30 -Day RAMR PCI Statistics 2011 -13 # cases All cases Non. Emergency cases 1. Mount Sinai Hospital 13, 906 0. 75** 0. 49** 2. 17 2. Columbia Presbyterian Hosp. 8, 342 0. 76** 0. 52 2. 00 3. Saint Francis Hospital 7, 230 0. 97 0. 62 3. 00 4. St. Josephs Hospital 6, 283 0. 92 0. 69 2. 02 5. LIJ Medical Center 5, 158 0. 88 0. 73 1. 31 6. Lenox Hill Hospital 4, 862 0. 75 0. 40** 2. 70 7. Rochester General Hospital 4, 824 1. 25 0. 66 4. 30* 8. Buffalo General Hospital 4, 730 1. 43* 0. 97* 3. 68 9. North Shore Univ. Hospital 4, 507 0. 69** 0. 54 1. 40** 10. Beth Israel Medical Center 4, 484 1. 14 0. 79 3. 05 NYS Total http: // www. nyhealth. gov Emergency cases 145, 247 1. 04 0. 68 2. 81 *Risk-Adjusted Mortality Rate (RAMR) significantly higher than NY Statewide rate **Risk Adjusted Mortality Rate (RAMR) significantly lower than NY Statewide rate
 NYS-DOH Report of PCI 2013 Data on Top 10 Volume Centers in NY State 30 -Day RAMR PCI Statistics 2013 # cases All cases Non. Emergency cases 1. Mount Sinai Hospital 4, 522 0. 92 0. 56 0. 74 2. Columbia Presbyterian Hosp. 2, 541 1. 05 0. 87 1. 25 3. Saint Francis Hospital 2, 289 0. 82 0. 49 1. 10 4. Saint Joseph’s Hospital 2, 073 0. 99 0. 68 1. 28 5. Buffalo General Hospital 1, 735 1. 59 0. 91 1. 20 6. Long Island Jewish Med Ctr. 1, 695 1. 02 0. 78 0. 92 7. North Shore Univ. Hosp. 1, 683 0. 78 0. 54 1. 22 8. Beth Israel Hospital 1, 610 1. 49 0. 97 0. 95 9. Rochester General Hospital 1, 569 1. 46 0. 85 1. 04 10. Lenox Hill Hospital 1, 552 0. 59 0. 34 0. 75 NYS Total 47, 965 1. 14 0. 74 http: // www. nyhealth. gov Emergency cases
 NYS-DOH 30 -day RAMR for PCI at MSH for last 5 Reports Years/ # cases All cases RAMR % Non-Emergency cases RAMR % **Interventionalist 3, 925 2011 -2013/ 2, 883 439 0. 56** 0. 60 0. 18** 0. 31** 0. 16 Dr. Sharma Dr. Kini Dr. Dangas 4, 052 2010 -2012/ 2, 874 0. 51** 0. 29** 0. 35** 0. 21** Dr. Sharma Dr. Kini 2009 -2011/ 3, 063 0. 47** 0. 33 Dr. Kini 2008 -2010/ 1, 447 0. 29** 0. 24 Dr. Moreno 2006 -2008/ 3, 790 0. 44** 0. 32** Dr. Sharma http: //www. nyhealth. gov **Risk-Adjusted Mortality Rate (RAMR) significantly lower than NY Statewide rate
 NYS-DOH 30 -day RAMR for PCI 2011 -2013 Number of cases All cases RAMR % Non-Emergency cases RAMR % 1. Dr. S. Sharma 3, 925 0. 56** 0. 38** Mount Sinai Hospital 2. Dr. A. Kini 2, 883 0. 60 0. 31** Mount Sinai Hospital 3. Dr. R. Shlofmitz 2, 526 0. 86 0. 54 St. Francis Hospital Interventionalist Hospital 4. Dr. M. Kim 1, 539 1. 10 0. 67 Elmhurst Hosp. ; Lenox Hill Hosp. , LIJ Med. Ctr. , Mount Sinai Hosp. , North Shore Univ Hosp 5. Dr. LS Ong 1, 459 1. 60 0. 77 Rochester Hospital; Unity Hospital 6. Dr. R. Jauhar 1, 343 0. 89 0. 88 LIJ Med. Ctr. , North Shore Univ Hosp. 7. Dr. R. Caputo 1, 297 0. 75 0. 65 St. Josephs Hospital 8. Dr. Z. El-Khally 1, 278 0. 61 0. 49 St. Josephs Hospital 9. Dr. J. Moses 1, 277 0. 44 0. 34 Columbia Presb. Hosp. , Weill Cornell Hosp. 10. Dr. B. Kaplan 1, 259 0. 72 0. 61 LIJ Med. Ctr. , North Shore Univ Hosp. 21. Dr. W. Morris 1, 005 1. 22 0. 98 Buffalo Med. Ctr. , Mercy Hosp. , Millard Fillmore Hosp. http: //www. nyhealth. gov **Risk Adjusted Mortality Rate (RAMR) significantly lower than NY Statewide rate
 http: // www. nyhealth. gov **Risk-adjusted readmission rate significantly lower than NY Statewide rate based on 95% CI
 Complex Coronary Cases Supported by: • Abbott Vascular Inc • Boston Scientific Corp • Terumo Vascular Corp • Vascular Solutions Inc • Cardiovascular Science Inc • St Judes medical • Abiomed Inc • Trireme Medical
 Disclosures Samin K. Sharma, MBBS, FACC Speaker’s Bureau – Boston Scientific Corporation, Abbott Vascular Inc, ABIOMED, CSI, Trireme Medical Annapoorna S. Kini, MBBS, FACC Nothing to disclose Sameer Mehta, MBBS, FACC Consulting Fees – Medtronic Inc
 Sept 20 th 2016 Case #87: BA, 45 yrs M Presentation: Patient presented with new onset CCS class IV angina and lateral ST-T changes. A cardiac cath on June 27 th 2016 revealed 3 V CAD; 100% prox RCA, 90% mid LAD, 70% LCx. OM 2 and LVEF 65% (Syntax score 17). Pt underwent successful PCI of culprit mid LAD lesion using Promus Premier (3. 5/16 mm) DES. Aggressive CAD risk factor modifications with MMT contd. A stress MPI test revealed moderate infero-posterior ischemia. Prior History: Hypertension, +F/H Medications: All once daily dosage ASA 81 mg, Clopidogrel 75 mg, Lisinopril 10 mg, ISMN 30 mg, Metoprolol XL 50 mg, Atorvastatin 80 mg
 Case# 87: cont… SYNTAX Score was: 17 Cardiac Cath 6/28/2016: Right Dominance III V CAD with LVEF 65% LM: no obstruction LAD: 30% prox and 90% mid LAD lesions LCx: 70% OM 2 lesion RCA: 100% proximal occlusion, distal vessel fills LADseptal collaterals Pt had PCI of m. LAD with Promus Premier DES (3. 5/16 mm) Plan Today: Planned for retrograde recanalization technique for p. RCA CTO PCI using LAD-Septal collaterals
 Appropriateness Criteria for Coronary Revascularization
 Issues Involving The Case • Optimal strategy for CAD in DM: OMT or PCI or CABG • Key ESC 2016 Trials: DOCTORS, NORSTENT, PRAGUE 18
 Issues Involving The Case • Optimal strategy for CAD in DM: OMT or PCI or CABG • Key ESC 2016 Trials: DOCTORS, NORSTENT, PRAGUE 18
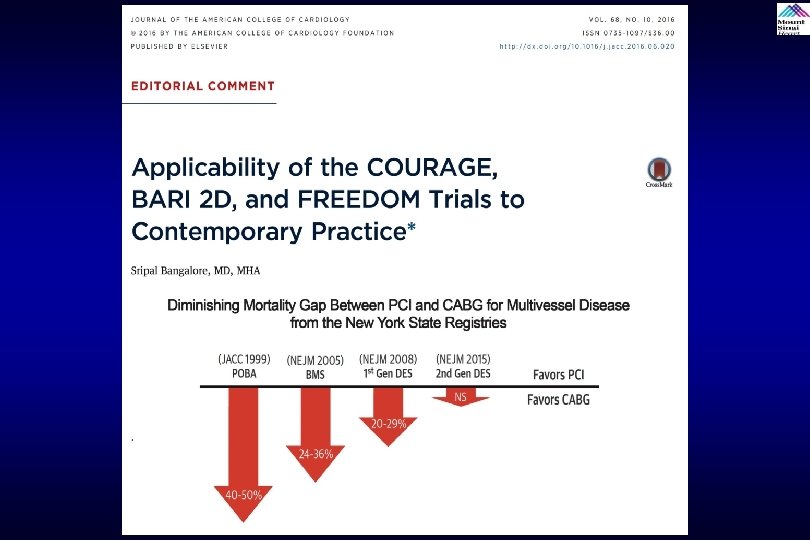
 32% OMT, 42% PCI+OMT, 26% CABG+OMT Pooled analysis of 5034 pts (Courage 766, BARI 2 D 2368, FREEDOM 1900)
 OMT (n=1588) PCI (n=2108) 5 -Year Rate of Death/MI/Stroke") Unadjusted Events Curves CABG (n=1316) OMT (n=1588) PCI (n=2108) 5 -Year Rate of Death/MI/Stroke 5 -Year Rate of MI 5 -Year Rate of Death 5 -Year Rate of Stroke Mancini et al. , J Am Coll Cardiol 2016; 68: 985
Unadjusted Events Curves CABG (n=1316) OMT (n=1588) PCI (n=2108) 5 -Year Rate of Death/MI/Stroke 5 -Year Rate of MI 5 -Year Rate of Death 5 -Year Rate of Stroke Mancini et al. , J Am Coll Cardiol 2016; 68: 985
 Forest Plots for Analyses of Composite Endpoint, Subgroups Defined by Angiographic Parameters Mancini et al. , J Am Coll Cardiol 2016; 68: 985
 Revascularization Strategies for Patients with Coronary Disease and Type 2 Diabetes Mellitus: Trial-Adjusted Hazard Ratios for 5 Years Mancini et al. , J Am Coll Cardiol 2016; 68: 985
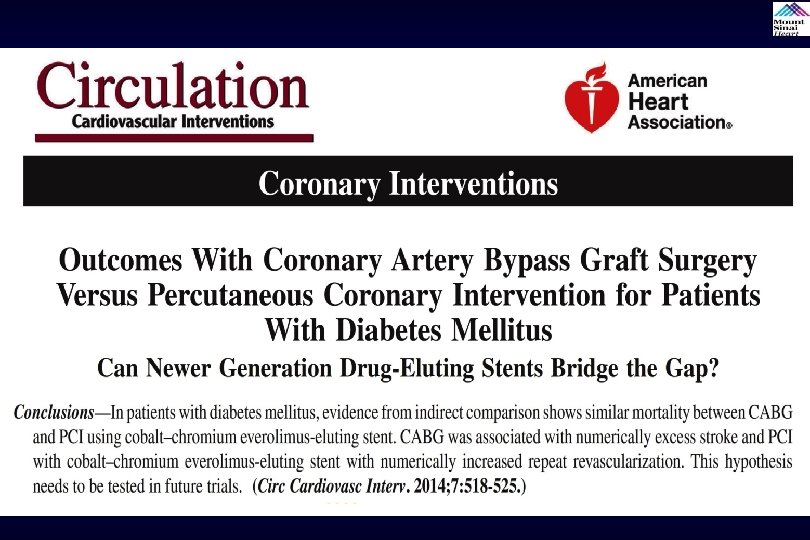
 Mixed Treatment Comparison Analyses for CABG vs. PCI Outcomes All-Cause Mortality Myocardial Infarction Bangalore et al. , Circ Cardiovasc Interv. 2014; 7: 518
 Mixed Treatment Comparison Analyses for CABG vs. PCI Outcomes Stroke Repeat Revascularization Bangalore et al. , Circ Cardiovasc Interv. 2014; 7: 518
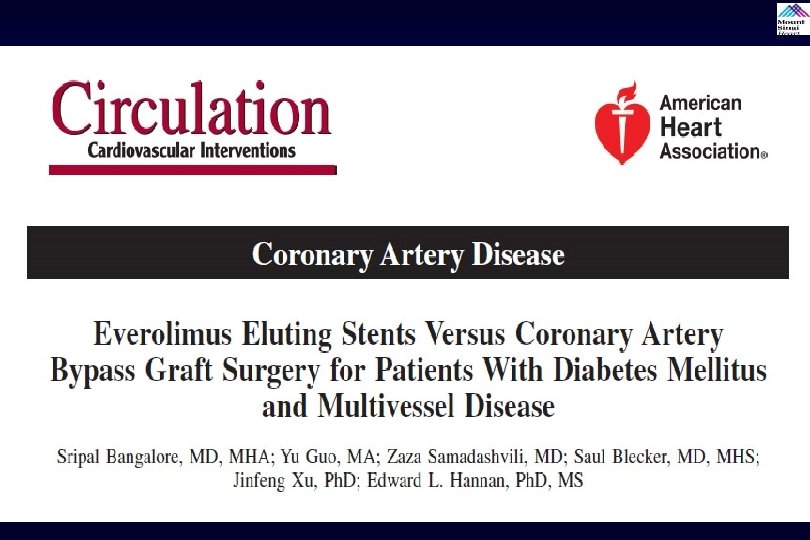
 EES vs CABG in Diabetic MV CAD: Short-Term Outcomes Within 30 Days Bangalore et al. , Circ Cardiovasc Interv; e. Pub July 8, 2015
 EES vs CABG in Diabetic MV CAD: Long-Term Outcomes Includes First 30 Days EES (n=1692) CABG (n=1158) p=<0. 0001 p=0. 16 % p=<0. 0001 p=0. 04 n=425 n=414 n=260 n=166 n=118 n=157 n=889 n=421 Bangalore et al. , Circ Cardiovasc Interv 2015; 8: e 002626
 Why Lower Mortality With CABG vs PCI in Diabetic Patients PCI CABG Cardiovascular events as a function of non-culprit lesions: Treats significant culprit lesions only; diabetic patients undergoing PCI are vulnerable to plaque rupture with consequent MI and death from non-culprit lesions, which are likely to be numerous Treats culprit lesions as well as non-culprit lesions throughout the bypassed segments, therefore providing more protection against both MI and death resulting from subsequent plaque rupture and disease progression Cardiovascular events as a function of culprit lesions: With PTCA and stent related events with a risk of acute vessel closure , late stent thrombosis and restenosis Some of the relative benefits of CABG have been attributed to the long-term benefits and reduced repeat procedures
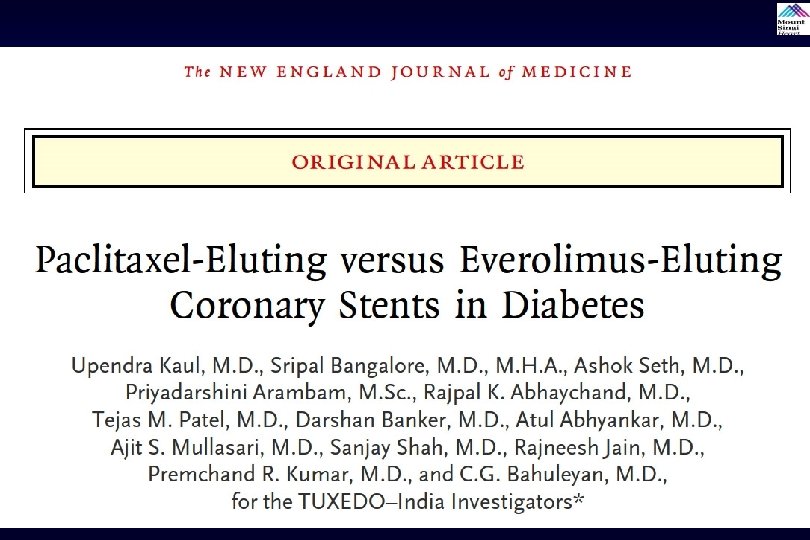
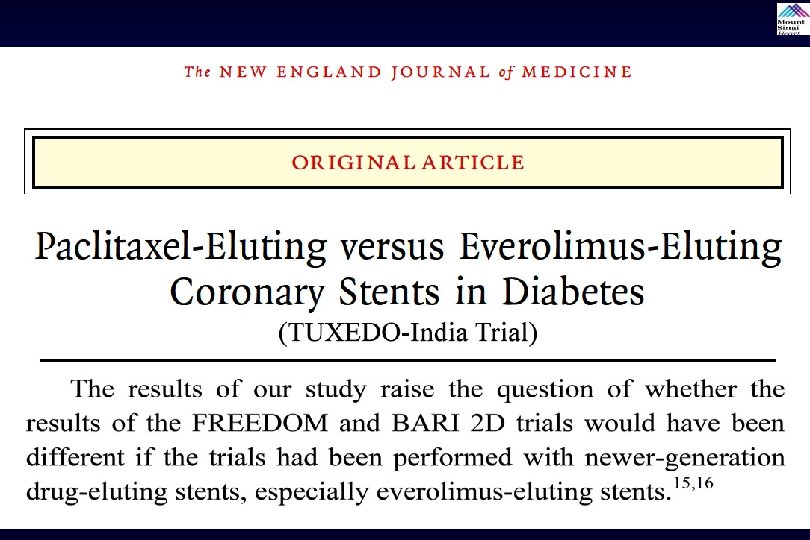
 Xience") Tuxedo India Study: PES vs EES in Diabetics 1 Year Endpoints Taxus (n=914) Xience (n=916) p=0. 005 p=0. 004 % p=0. 75 p=0. 69 p=0. 01 p=0. 002 Kaul et al. , New Engl J Med 2015; 373: 18
Tuxedo India Study: PES vs EES in Diabetics 1 Year Endpoints Taxus (n=914) Xience (n=916) p=0. 005 p=0. 004 % p=0. 75 p=0. 69 p=0. 01 p=0. 002 Kaul et al. , New Engl J Med 2015; 373: 18
 TUXEDO Trail: Cumulative Incidence of TVF Based on Insulin Use Status and Stent Type Bangalore et al. , JAMA Cardiol 2016; 1: 266
 Revascularization Strategies for Patients with Coronary Disease and Type 2 Diabetes Mellitus: Trial-Adjusted Hazard Ratios for 5 Years Newer DES PCI vs CABG may have different outcomes; - Similar death, - Lower stroke - Slightly higher MI and - Higher TVR Mancini et al. , J Am Coll Cardiol 2016; 68: 985
 Issues Involving The Case • Optimal strategy for CAD in DM: OMT or PCI or CABG • Key ESC 2016 Trials: DOCTORS, NORSTENT, PRAGUE 18
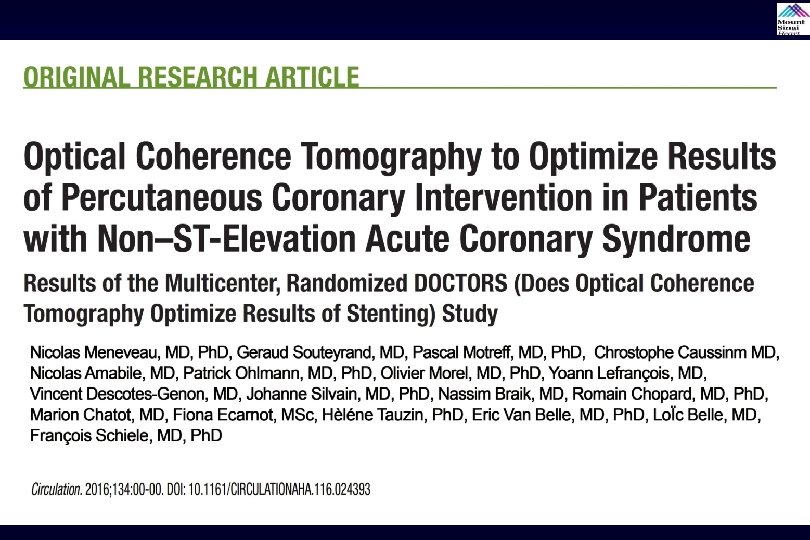
 DOCTORS Does Optical Coherence Tomography Optimise Results of Stenting ? N. Meneveau et al. , ESC 2016
 Pts fulfilling the inclusion criteria OCT-guided group OCT run before PCI : - quantitative OCT measures - plaque morphology, presence of thrombus or calcifications OCT run after stent implantation : - quantitative OCT measures - presence of thrombus, edge dissection, prolapse, optimal lesion coverage, stent malapposition or underexpansion. Angiography-guided group Randomization - Choice of stent length and diameter based on quantitative OCT measures. - IIb/IIIa inhibitors, thrombectomy, or rotational atherectomy considered in case of thrombus or calcifications PCI guided by fluoroscopy alone, performed before and after stent implantation according to standard of care - Additional balloon overdilation to be performed if stent underexpansion* - Additional stent implantation(s) to be performed if incomplete lesion coverage. - Management of malapposition & edge dissection at operator’s discretion. Final FFR measurements** Several OCT runs could be performed. The run with a satisfactory result considered as the final run. *Stent under-expansion was defined as a ratio **once the operator considers the of in-stent MLA to reference lumen area ≤ 80%. result of PCI to be optimal Final FFR measurements** Meneveau et al. , ESC 2016
 DOCTORS Trial: Design and Study Population Flowchart Meneveau et al. , Circulation 2016 Epub
 Representative OCT findings Distal reference Area : 11. 83 mm² Minimal lumen area Area : 7. 06 mm² Proximal reference Area : 8. 23 mm² Edge dissection Stent expansion : 70. 3% Stent malapposition Stent underexpansion Tissue prolapse Prati et al Eur Heart J 2012; 33: 2513; Tearney et al. J Am Coll Cardiol 2012; 59: 1058
 Fractional Flow Reserve Outcomes FFR Primary Endpoint Post-PCI FFR >0. 90 Meneveau et al. , ESC 2016
 56 (47%)*") Impact of Pre-PCI OCT Variable Angio-guided group OCT-guided group P value (n=120) 56 (47%)* 83 (69%)† 0. 0004 11 (9%)* 55 (45. 8%)† < 0. 0001 Plaque rupture - 44/88 (50%)† - Lipid-rich plaque/fibrous plaq - 92/28 (77%/23%)† - 4 (3. 3%) 2 (1. 7%) 0. 41 43 (35. 8%) 64 (53. 3%) 0. 007 - Stent length, mm 17. 3± 5. 5 17. 9± 5. 6 0. 44 - Stent diameter, mm 3. 11± 0. 41 0. 94 Presence of thrombus Presence of calcifications Procedural strategy - Aspiration thrombectomy - GP IIb/IIIa inhibitors *by visual assessment. †as visualized by OCT Meneveau et al. , ESC 2016
Impact of Pre-PCI OCT Variable Angio-guided group OCT-guided group P value (n=120) 56 (47%)* 83 (69%)† 0. 0004 11 (9%)* 55 (45. 8%)† < 0. 0001 Plaque rupture - 44/88 (50%)† - Lipid-rich plaque/fibrous plaq - 92/28 (77%/23%)† - 4 (3. 3%) 2 (1. 7%) 0. 41 43 (35. 8%) 64 (53. 3%) 0. 007 - Stent length, mm 17. 3± 5. 5 17. 9± 5. 6 0. 44 - Stent diameter, mm 3. 11± 0. 41 0. 94 Presence of thrombus Presence of calcifications Procedural strategy - Aspiration thrombectomy - GP IIb/IIIa inhibitors *by visual assessment. †as visualized by OCT Meneveau et al. , ESC 2016
 DOCTORS Trial: Quantitative Findings as Assessed by OCT Variable Pre-Stenting Immediately Post-OCT P value* post-stenting optimization Reference diameter, mm 2. 92± 0. 53 3. 10± 0. 45 3. 11± 0. 48 0. 27 MLD , mm 1. 21± 0. 33 2. 79± 0. 46 2. 84± 0. 43 0. 001 Diameter stenosis, % 58. 4± 10. 9 9. 5± 6. 1 8. 4± 3. 9 <0. 0001 Reference area, mm² 7. 0± 2. 23 7. 62± 2. 42 7. 72± 2. 43 0. 10 MLA, mm² 1. 28± 0. 71 5. 99± 2. 11 6. 41± 1. 99 <0. 0001 Area stenosis, % 81. 1± 9. 82 21. 1± 12. 4 15. 9± 7. 3 <0. 0001 Meneveau et al. , Circulation 2016 Epub
 DOCTORS Trial: Quantitative OCT Parameters That Best Predict FFR >0. 90 Youden AUC 95%CI index criterion MLA Stent expansi on MLD Diam. Stenosi 0. 79 [0. 71 ; 0. 86] 0. 77 [0. 69 ; 0. 84] 0. 72 [0. 63 ; 0. 80] 0. 69 [0. 60 ; >5. 44 mm² >79. 4 % >2. 73 mm ≤ 11. 5 % Se Spe (%) 91. 3 83. 7 65. 2 39. 60. 2 65. 2 73. 5 94. 9 Meneveau et al. , Circulation 2016 Epub 0. 77] 1
 Impact of Post-PCI OCT Meneveau et al. , ESC 2016
 (n=120)") Clinical Outcomes at 6 Months Variable Angio-guided group OCT-guided group P value (n=119*) (n=120) Death from any cause 0 1 (0. 8%) 0. 32 Myocardial infarction 1 (0. 8%)† 1 0 0 Target vessel revascularization 1 (0. 8%) 2 (1. 6%) 0. 57 ≥ 1 of the above 2 (1. 6%) 3 (2. 5%) 0. 66 Stent thrombosis * One pt lost to FUP (death registries indicated the pts was still alive at study cut-off date) † Both unrelated to target vessel Meneveau et al. , ESC 2016
Clinical Outcomes at 6 Months Variable Angio-guided group OCT-guided group P value (n=119*) (n=120) Death from any cause 0 1 (0. 8%) 0. 32 Myocardial infarction 1 (0. 8%)† 1 0 0 Target vessel revascularization 1 (0. 8%) 2 (1. 6%) 0. 57 ≥ 1 of the above 2 (1. 6%) 3 (2. 5%) 0. 66 Stent thrombosis * One pt lost to FUP (death registries indicated the pts was still alive at study cut-off date) † Both unrelated to target vessel Meneveau et al. , ESC 2016
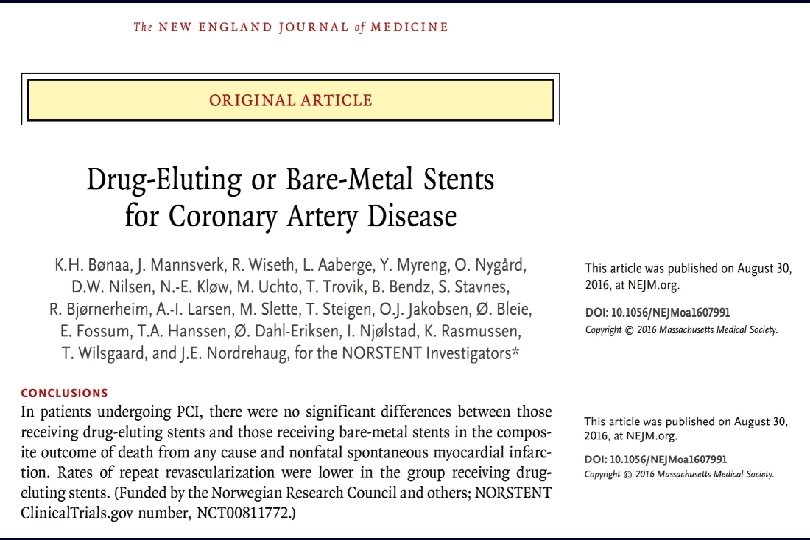
 NORSTENT Trial Study Design Bønaa et al. , N Engl J Med Epub August 30, 2016
 NORSTENT Trial: Clinical Events During Follow-Up and Cumulative Rates at 6 Years Drug-Eluting Stents (n=4504) Bare-Metal Stents (n=4509) p=<0. 001 p=0. 66 p=0. 14 p=0. 22 p=0. 88 p=0. 10 p=0. 05 BARC 3, 4, or 5 Bønaa et al. , N Engl J Med Epub August 30, 2016
 NORSTENT Trial: Clinical Outcomes at 6 Years Death and MI Death 17. 1% 16. 6 % 8. 5% 8. 4% Definite ST Revasc (PCI or CABG) 19. 8% 16. 5% 1. 2% 0. 8% Bønaa et al. , N Engl J Med Epub August 30, 2016
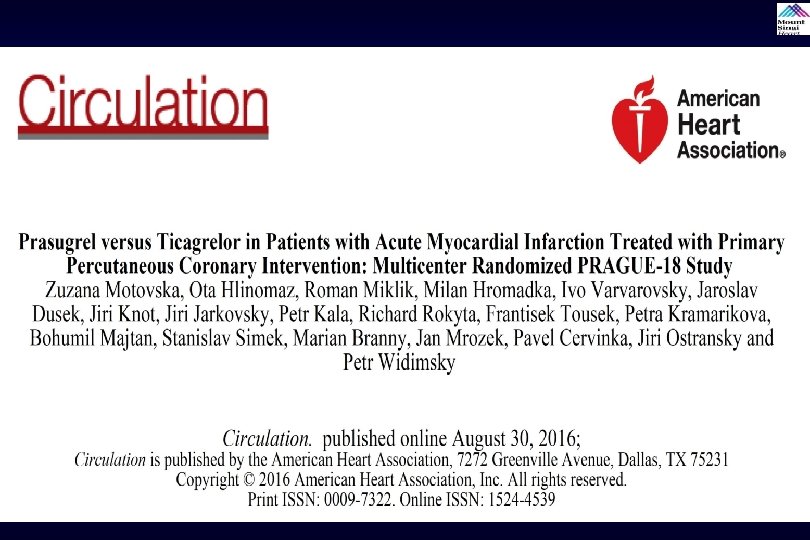
") PRAGUE-18 Trial: Primary Endpoint at Day 7 (death, re-infarction, urgent revasc, stroke, serious bleeding) p=0. 94 % (n=596) Motovska et al. , Circulation Epub August 30, 2016
PRAGUE-18 Trial: Primary Endpoint at Day 7 (death, re-infarction, urgent revasc, stroke, serious bleeding) p=0. 94 % (n=596) Motovska et al. , Circulation Epub August 30, 2016
 Ticagrelor (n=596) p=0. 64 p=0.") PRAGUE-18 Trial: Secondary Endpoint at 30 Days Prasugrel (n=634) Ticagrelor (n=596) p=0. 64 p=0. 86 p=0. 90 % p=0. 43 p=0. 61 BARC 2/3 Motovska et al. , Circulation Epub August 30, 2016
PRAGUE-18 Trial: Secondary Endpoint at 30 Days Prasugrel (n=634) Ticagrelor (n=596) p=0. 64 p=0. 86 p=0. 90 % p=0. 43 p=0. 61 BARC 2/3 Motovska et al. , Circulation Epub August 30, 2016
 Take Home Message: Optimal management of Diabetic CAD and latest RCTs from ESC ü Pooled analysis of >5000 DM pts with BMS or 1 st G DES showed that CABG is superior to PCI or OMT in terms of reduction of primary endpoint of death/MI/stroke and TVR. Data with newer DES vs CABG showed that mortality is similar between 2 groups but higher stroke rate with CABG and higher MI and TVR with PCI ü First randomized trial of OCT guided PCI in ACS pts showed higher FFR post-PCI & better stent optimization in OCT group but no difference in clinical outcomes at 6 mths. DES has similar long-term outcomes to BMS except for lower TLR. Trial comparing Ticagrelor vs Prasugrel showed similar efficacy, MACE & bleeding outcomes in STEMI pts.
 Question # 1 Following statement is true regarding the published data about optimal management of CAD in DM except: A. PCI with 1 st G DES has higher mortality vs CABG B. PCI with 1 st G DES has higher MACE vs CABG C. PCI has higher TVR vs CABG D. PCI has lower stroke rate vs CABG E. PCI with 2 nd generation DES has higher mortality vs CABG
 Question # 2 TUXEDO India Trial showed the following except; A. EES has lower TVF vs PES B. EES has similar ST vs PES C. EES has lower MI vs PES D. EES has similar mortality vs PES E. IDDM has higher MACE vs NIDDM irrespective of stent type
 Question # 3 DOCTORS study evaluating the impact of OCT guided PCI revealed the following except: A. Higher post PCI FFR in OCT vs angio-guided group B. Higher % of pts achieving FFR >0. 90 in the OCT vs angio group C. Higher post PCI optimization in OCT group vs angio group D. Lower 6 mths MACE rates in OCT group vs angio group E. Better stent expansion in OCT group vs angio group
 Question # 1 Following statement is true regarding the published data about optimal management of CAD in DM except: A. PCI with 1 st G DES has higher mortality vs CABG B. PCI with 1 st G DES has higher MACE vs CABG C. PCI has higher TVR vs CABG D. PCI has lower stroke rate vs CABG E. PCI with 2 nd generation DES has higher mortality vs CABG The correct answer is E
 Question # 2 TUXEDO India Trial showed the following except; A. EES has lower TVF vs PES B. EES has similar ST vs PES C. EES has lower MI vs PES D. EES has similar mortality vs PES E. IDDM has higher MACE vs NIDDM irrespective of stent type The correct answer is B
 Question # 3 DOCTORS study evaluating the impact of OCT guided PCI revealed the following except: A. Higher post PCI FFR in OCT vs angio-guided group B. Higher % of pts achieving FFR >0. 90 in the OCT vs angio group C. Higher post PCI optimization in OCT group vs angio group D. Lower 6 mths MACE rates in OCT group vs angio group E. Better stent expansion in OCT group vs angio group The correct answer is D