Numerical Methods2 12(1).ppt
- Количество слайдов: 18
 Numerical Methods 2
 Measures of Spread There are 4 commonly used measures which give information about the spread or dispersion of a set of data ¡ The Range ¡ The Variance ¡ The Standard Deviation ¡ The Quartiles ¡
 Why measure spread? A measure of centre or location is not sufficient on its own ¡ Data set 1 : 0 48 49 51 52 100 ¡ Data set 2 : 47 48 49 51 52 53 ¡ Consider the two data sets - both have the same mean and median but they are quite different ¡
 The Range The simplest way of measuring the spread of a set of data is to calculate the range ¡ The range is simply the difference between the largest and the smallest data values ¡ The range is simply a number ¡ It is calculated using only 2 items of data (the smallest and the largest) ¡
 Example Data set 1 : Range = 100 ¡ Data set 2 : Range = 6 ¡ Now, consider data set 3: 0 1 1 99 99 100 ¡ Mean = 50, median = 50, Range = 100 ( The same as data set 1) ¡ The range ignores the majority of data and only considers 2 values ¡
 The Variance The variance is a measure of spread which takes account of every item of data ¡ It is defined as the sum of the squared deviations of the data from their mean divided by the number of items of data minus 1 ¡ For a sample, s 2 = (xi- )2/n-1 ¡
 Example Data set 1 : s 2 = 1002 ¡ Data set 3: s 2 = 2920. 8 ¡ Data set 3 has a larger variance as it is much more spread out than data set 1 ¡ A quicker formula to use for calculating the variance is s 2 = [ x 2 - ( x)2/n]/n-1 ¡
 The Standard Deviation The sample standard deviation is simply the square root of the sample variance ¡ A corresponding measure for the population is called , where 2 = (xi-µ)2/N ¡ We divide by n-1 because for small n (xi- )2/n-1 tends to be a better estimate of 2 than (xi- )2/n ¡
 Chebysheff’s Theorem This gives us some idea of the proportion of data which lies within a particular distance of the mean ¡ A proportion of at least 1 - 1/k 2 of the values in a sample lie within ks of the sample mean, where s is the sample standard deviation ¡
 Example We read in a report that a sample has mean 50 and variance 25 ¡ We do not have actual data ¡ What can we say about the proportion of data that lies within a particular distance of the mean? ¡
 Solution At least 75% of values are between 40 and 60 ¡ At least 89% of values are between 35 and 65 ¡ At least 93. 75% of values are between 30 and 70 ¡
 The Quartiles The median is the value such that 1/2 the data is smaller than it and 1/2 the data is larger than it ¡ 1/4 of the data is smaller than the lower quartile, 3/4 is smaller than the upper quartile ¡ The distance between the quartiles is called the inter-quartile range ¡
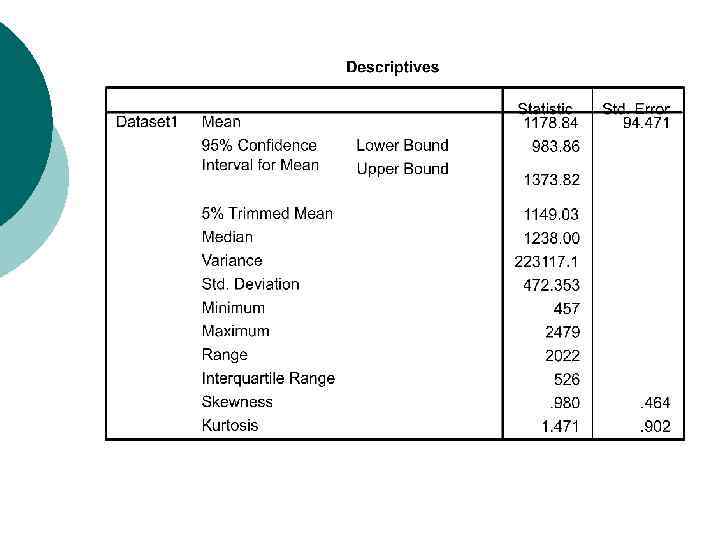
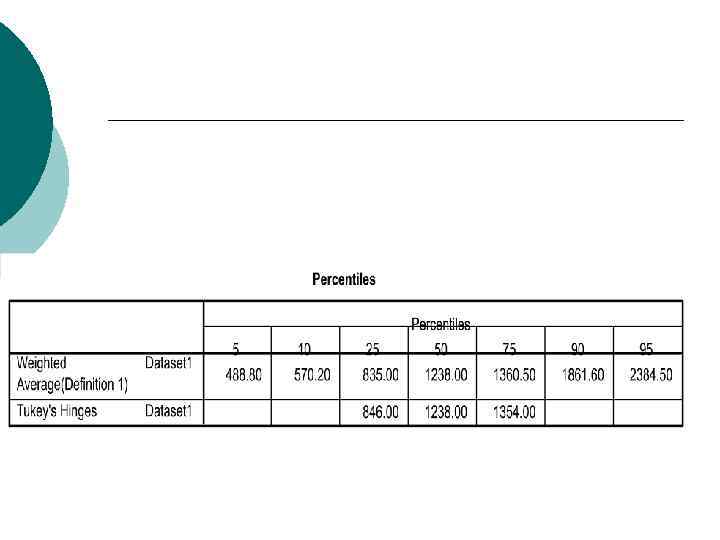
 Using a computer ¡ ¡ In SPSS/PASW, use Analyse > Descriptive Statistics > Explore to produce a variety of numerical statistics describing the data set In Excel, use Tools > Data Analysis > Descriptive Statistics
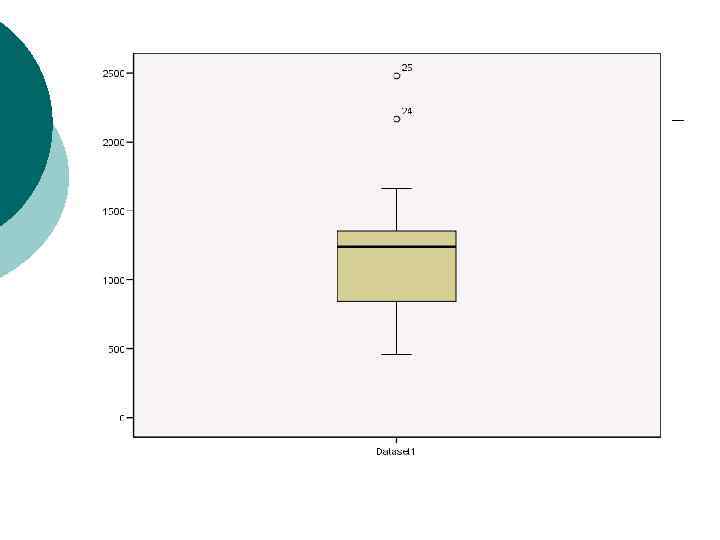
 Box Plots A box plot is a graphical display that describes several features of the data at the same time e. g. centre, spread departure from symmetry and also describes the behaviour of observations which lie unusually far from the main bulk of the data (outliers) ¡ A box encloses the IQR with lines extending to the extreme values ¡
 Box Plots continued Lower edge of box is LQ ¡ Upper edge of box is UQ ¡ Line through box at median ¡ Whiskers to extreme values ¡ Outliers more than 1. 5 x IQR from edge ¡ Extreme outliers 3 x IQR from edge ¡