

3da2945e3a11eeafb455a9b6efbbf7fb.ppt
- Количество слайдов: 50
 NOWPAP POMRAC Northwest Pacific Action Plan UNEP Pollution Monitoring Regional Activity Centre Website – http: //pomrac. dvo. ru Major trends of activity for river basin and coastal area management within UNEP Northwest Pacific Action Plan for nature protection (NOWPAP) Kachur Anatoly Director NOWPAP POMRAC Hangzhou, China, 2007
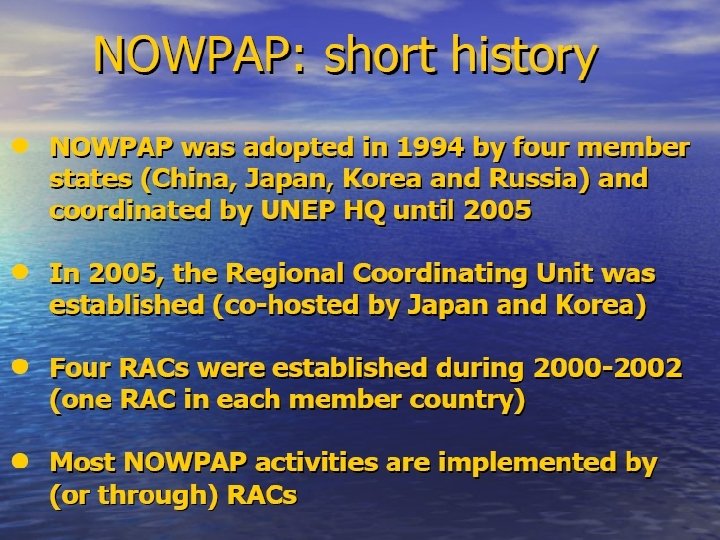
 10 to 12 November 1993. UNEP in Bangkok at the Third Meeting of Experts and National Focal Points the North West Pacific Action Plan was discussed and agreed. According to an agreement between China, Japan, ROK, and Russia (1994) based on United Nation principals, the NOWPAP region includes marine, coastal and offshore basins at 33 52 N and 121 143 E
 with Rivers") NOWPAP Region (within dashed line) with Rivers
NOWPAP Region (within dashed line) with Rivers
 As is in this document, the overall goal of the Northwest Pacific Action Plan is “The wise use, development and management of the coastal and marine environment so as to obtain the utmost long-term benefits for the human populations of the region, while protecting human health, ecological integrity and the region's sustainability for future generations”. According to the Plan, one of the most important results of accomplishment of the Plan should have become development of wise management strategy for the Northwest Pacific coastal and marine environment. The strategy for wise management of the Northwest Pacific coastal and marine environment should consist of 5 main elements: • monitoring and assessment of the environmental condition • creation of an efficient and effective information base • integrated coastal area planning • integrated coastal area management • establishment of a collaborative and cooperative framework
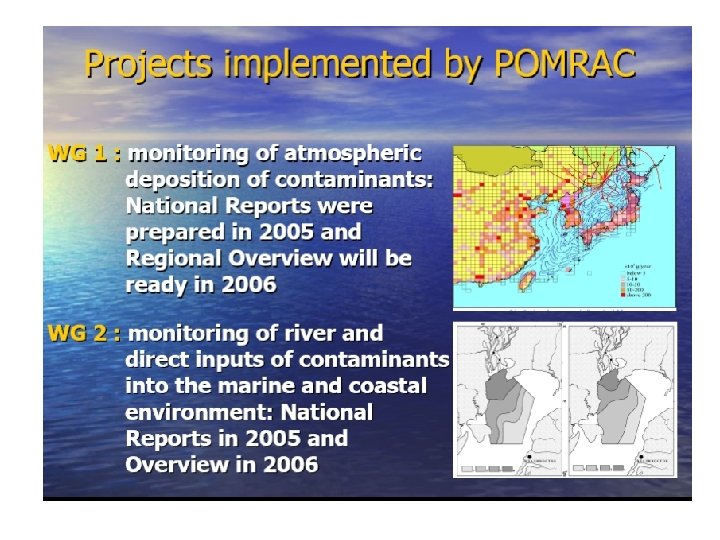
 POMRAC and the Working Groups First Meeting of the Coordinating Committee for the Establishment of a Collaborative Regional Monitoring Programme (NOWPAP/3) (Beijing, China, 21 22 May 2001): After careful consideration the Coordinating Committee approved the division of responsibility for regional implementation of these activities between the RACs as follows: POMRAC (Vladivostok): Working Group 1 - Atmospheric Deposition of Contaminants; Working Group 2 River Inputs and Direct Inputs of Contaminants;
 Sources for Developing the Overviews ØNOWPAP POMRAC Focal Points Meetings reports ØWorking Group meeting reports ØNational reports (heavily relied on) ØWebsites
 The first goal of this Overview is to give a comparative description of the national programs of China, Japan, Korea and Russia for evaluating contaminant inputs into marine environments directly or via rivers. The second goal of this Regional Overview is to present available information on the concentrations of some chemical substances in river water and to assess contaminant run off into marine environments directly and via rivers at the regional level.
 • The major river basins of the China part of region include Songhua River, Liaohe River, Haihe River, Yellow River, Huaihe River and Yangtze River, with overall annual (2002) input of 1, 193 km 3 directly or indirectly related to the NOWPAP marine area. • The Yangtze River provides 80% of this water discharge. • When the Yangtze and Songhua Rivers are excluded, annual river input is about 177 km 3. All rivers have peak runoff in summer and minimum discharge in winter.
 There are five main rivers of Korean Part of Region: Han River, Guem River, Yongsan River, Somjin River and Nakdong River with total annual input of about 46 km 3
 N Major Rivers Exerting an Impact on the south part of NOWPAP Region River * Province, region, subregion, Coast l e n g t h, k m 4, 000 (1, 634 1) China Watershe d squa re, 103 km 2 10, 054 1, 809 2, 498 Discharg e, m 3/s (200 2) 1 Yangtze Jiangsu 2 Huaihe Jiangsu/Shan dong 269 1, 972 3 Yihe Shandong nd nd 4 Yellow Shandong 752 5 Haihe Hebei/Tianjin 264 723 6 Luanhe** Liaoning 44 144. 3 7 Dalinghe** Liaoning 14. 4 8 Daliaohe Liaoning 229 469 9 Yalu** Liaoning/Jilin 61. 9 1, 200 Jilin/Heilongj iang 557 2, 416 10 Songhua Korea 68. 1 1728 1828 6, 050 30, 166 2, 087 117. 6
 Characterist ic China Japan Korea Russia MDL, mg/L 7. 5 5 0. 2; 0. 5 CODMn≤ 2 1(lakes ) 1(for lakes) 5 0. 5 CODCr≤ 15 nd nd 15 1. 5 BOD 5 ≤ 3 1 1 2 0. 4; 2. 0 NH 4 - ≤ 0. 15 nd nd 0. 4 0. 002; 0. 05 NO 3 - < nd 10 nd 9. 1 0. 2; 0. 01; 0. 5 TP≤ 0. 02 0. 05 0. 01 (for lakes) 0. 051 0. 001; 0. 01 TN≤ 0. 2 0. 1 0. 2 (for lakes) 9. 51 0. 002; 0. 05 Cu ≤ 0. 01 0. 04 nd 0. 001; 0. 005 Zn ≤ 0. 05 0. 03 nd 0. 01 0. 0005 -0. 05 F- ≤ 1. 0 0. 8 nd 0. 75 0. 05; 0. 2 Se ≤ 0. 01 nd 0. 01 0. 002 As ≤ 0. 05 0. 01 0. 05 0. 0005; 0. 005 Hg ≤ 0. 0000 5 0. 0005 BDL 0. 0005 0. 00005; 0. 0005 Cd ≤ 0. 001 0. 0005; 0. 002 Pb ≤ 0. 01 0. 006 0. 005; 0. 040 Cr 6+ ≤ 0. 01 0. 05 0. 02 0. 004; 0. 010 DO ≥ Comparison of Some EQS (mg/l) for Surface Water in NOWPAP Countries (r iv er s)
 Parameter Japan unfiltered Korea unfiltered Russia* CODMn 0 -5° C H 2 SO 4 (p. H<2) u 0 -5° C CODCr H 2 SO 4 (p. H<2) nd nd u 0 -5° C BOD 5 0 -5° C u 0 -5° C NH 4 - H 2 SO 4 (p. H<2) 0 -5° C H 2 SO 4 (p. H<2) f, CHCl 3 TP Water Sample Preservation Methods Used in NOWPAP Countries China unfiltered H 2 SO 4 (p. H<2) 0 -5° C H 2 SO 4 (p. H<2) nd TN H 2 SO 4 (p. H<2) 0 -5° C H 2 SO 4 (p. H<2) nd Cu, Zn, Cd HNO 3(p. H<1) HCl (p. H<1) HNO 3 (p. H<1) f, HNO 3(p. H<1) Se HNO 3(p. H<1) HCl (p. H<1) HNO 3 (p. H<1) f, HNO 3(p. H<1) As HNO 3(p. H<1) HCl (p. H<1) HNO 3 (p. H<1) f, HNO 3(p. H<1) Hg HNO 3(p. H<1) HCl (p. H<1) HNO 3(p. H<1) f, HNO 3(p. H<1) Pb HNO 3(p. H<1) HCl (p. H<1) HNO 3 (p. H<1) f, HNO 3(p. H<1) Cr 6+ Na. OH (p. H 8 -9) HCl (p. H<1) 0 -5° C f, 0 -5° C CN- Na. OH (p. H 8 -9) Na. OH, p. H>11 Na. OH (p. H>11) u, Na. OH (p. H>11) V-phen H 3 PO 4(p. H<2) nd H 2 SO 4 (p. H<4) u 0 -5° C HCl (p. H<2) nd H 2 SO 4 (p. H<2) u, CCl 4 (2 ml/l) H 2 SO 4(p. H<2) nd 0 -5° C u, CHCl 3(2 ml/l) Oils Surfactan ts
 Paramet er Japan Korea Russia NH 4 - Key Differences in Water Analysis Methods Used in NOWPAP Countries China Colorimetric, 0. 01 -0. 05 mg. N/l Absorptiometri c, 0. 7 mg. N/l Absorptiometr ic, 0. 002 mg. N/l Colorimetric, 0. 05 mg. N/l NO 3 nd Absorptiometri c, 0. 2 mg. N/l IC, 0. 01 mg. N/l Ion selective electrode, 0. 5 mg. N/l F- nd Absorptiometri c, 0. 2 mg/l nd Ion selective electrode, 0. 01 mg/l Phenols 4 -ААР spectroph otometric, 0. 002 mg/l nd Absorptiometr ic 0. 005 mg/l Absorptiometri c, 0. 002 mg/l Oils IR- nd nd spectroph otometry, 0. 01 mg/l IRspectropho to-metry, 0. 02 mg/l
 SS (mg/l) BOD 5 (mg/l) CODMn (mg/l) DO (mg/l)") Rivers Water discharge (m 3/s) SS (mg/l) BOD 5 (mg/l) CODMn (mg/l) DO (mg/l) NH 4 (mg. N/l) NO 2 (mg. N/l) Dalinghe 117. 6** nd 7. 34 8. 68 7. 3 1. 920 nd Luanhe 144. 3** 6. 3 2. 09 3. 20 10. 54 0. 177 0. 042 Yongdingxinhe nd nd 6. 14 6. 46 nd 0. 978 nd Chaobaixinhe nd nd 12. 4 15. 7 nd 9. 0 nd Haihe 723 nd 8. 68 7. 13 nd 16. 4 nd Yellow 2, 087 nd 2. 83 4. 09 8. 27 0. 35 0. 024 Huaihe 1, 972 34. 4 1. 0 3. 49 7. 68 0. 687 0. 033 Yangtze 30, 166 nd 2. 31 2. 51 nd 0. 075 nd nd 3 2 7. 5 0. 15 nd oils (mg/l) Phenols (mg/l) Pb (µg/l) Cd ( g/l) Hg ( g/l) As (µg/l) 0. 384 0. 0073 2. 0 nd 0. 05 4. 0 2. 20 0. 01 0. 001 1. 0 0. 07 0. 01 4. 0 Yongdingxinhe nd 0. 41 0. 009 4. 0 nd 0. 41 nd Chaobaixinhe nd 0. 81 0. 001 10. 0 nd nd nd Haihe nd 0. 037 0. 003 6. 0 nd 0. 24 nd Yellow 3. 15 0. 009 0. 001 8. 0 0. 2 nd nd Huaihe 0. 36 0. 052 0. 001 1. 0 0. 11 4. 0 Yangtze nd 0. 068 0. 001 1. 0 0. 1 0. 02 nd MPC*** nd 0. 05 1. 0 0. 05 50 Chemical Composition of Main Chinese Rivers MPC*** Flowing into the NOWPAP Marine Environment. Rivers Dalinghe Luanhe NO 3 (mg. N/l) nd 0. 002
Rivers Water discharge (m 3/s) SS (mg/l) BOD 5 (mg/l) CODMn (mg/l) DO (mg/l) NH 4 (mg. N/l) NO 2 (mg. N/l) Dalinghe 117. 6** nd 7. 34 8. 68 7. 3 1. 920 nd Luanhe 144. 3** 6. 3 2. 09 3. 20 10. 54 0. 177 0. 042 Yongdingxinhe nd nd 6. 14 6. 46 nd 0. 978 nd Chaobaixinhe nd nd 12. 4 15. 7 nd 9. 0 nd Haihe 723 nd 8. 68 7. 13 nd 16. 4 nd Yellow 2, 087 nd 2. 83 4. 09 8. 27 0. 35 0. 024 Huaihe 1, 972 34. 4 1. 0 3. 49 7. 68 0. 687 0. 033 Yangtze 30, 166 nd 2. 31 2. 51 nd 0. 075 nd nd 3 2 7. 5 0. 15 nd oils (mg/l) Phenols (mg/l) Pb (µg/l) Cd ( g/l) Hg ( g/l) As (µg/l) 0. 384 0. 0073 2. 0 nd 0. 05 4. 0 2. 20 0. 01 0. 001 1. 0 0. 07 0. 01 4. 0 Yongdingxinhe nd 0. 41 0. 009 4. 0 nd 0. 41 nd Chaobaixinhe nd 0. 81 0. 001 10. 0 nd nd nd Haihe nd 0. 037 0. 003 6. 0 nd 0. 24 nd Yellow 3. 15 0. 009 0. 001 8. 0 0. 2 nd nd Huaihe 0. 36 0. 052 0. 001 1. 0 0. 11 4. 0 Yangtze nd 0. 068 0. 001 1. 0 0. 1 0. 02 nd MPC*** nd 0. 05 1. 0 0. 05 50 Chemical Composition of Main Chinese Rivers MPC*** Flowing into the NOWPAP Marine Environment. Rivers Dalinghe Luanhe NO 3 (mg. N/l) nd 0. 002
 River DO (mg/l) COD (mg/l) BOD (mg/l)") Water Quality of Major Korean Rivers (2002) River DO (mg/l) COD (mg/l) BOD (mg/l) SS (mg/l) E-Coli (MPN) TN TP NO 3 NH 4 PO 4 Han 7. 1 6. 2 3. 4 13. 2 1. 3× 10 7. 9 0. 3 2. 2 2. 0 0. 2 Nakdong 9. 2 5. 8 2. 5 16. 1 6. 8× 10² 3. 3 0. 1 2. 4 0. 1 Geum 9. 0 7. 4 3. 3 22. 1 1. 7× 10³ 4. 4 0. 1 2. 6 0. 9 0. 1 Yeongsan 9. 9 5. 7 1. 9 12. 7 2. 8× 10² 5. 2 0. 1 3. 1 0. 3 0. 1 Seomjin 7. 9 2. 9 0. 9 2. 8 1. 1× 10¹ 0. 7 0. 0 0. 4 0. 1 0. 0 WQS >7. 5 6 1 -3 25 50 -1000 0. 2 0. 01 9. 1 0. 2 0. 05
Water Quality of Major Korean Rivers (2002) River DO (mg/l) COD (mg/l) BOD (mg/l) SS (mg/l) E-Coli (MPN) TN TP NO 3 NH 4 PO 4 Han 7. 1 6. 2 3. 4 13. 2 1. 3× 10 7. 9 0. 3 2. 2 2. 0 0. 2 Nakdong 9. 2 5. 8 2. 5 16. 1 6. 8× 10² 3. 3 0. 1 2. 4 0. 1 Geum 9. 0 7. 4 3. 3 22. 1 1. 7× 10³ 4. 4 0. 1 2. 6 0. 9 0. 1 Yeongsan 9. 9 5. 7 1. 9 12. 7 2. 8× 10² 5. 2 0. 1 3. 1 0. 3 0. 1 Seomjin 7. 9 2. 9 0. 9 2. 8 1. 1× 10¹ 0. 7 0. 0 0. 4 0. 1 0. 0 WQS >7. 5 6 1 -3 25 50 -1000 0. 2 0. 01 9. 1 0. 2 0. 05
 Water SS BOD 5 CODMn NH 4 NO 2 NO 3 Luanhe ** 4. 6 28, 669 9, 511 14, 562 805 191 10, 011 Haihe 22. 8 nd 197, 904 162, 564 373, 920 nd nd Yellow 65. 8 nd 186, 214 269, 122 23, 030 1, 579. 2 207, 270 Huaihe 62. 2 2, 139, 680 62, 200 217, 078 42, 731 2, 052. 6 22, 392 Yangze 951. 3 nd 2, 195, 914 2, 390, 141 70, 948 nd nd Total 1144 nd 2, 778, 788 3, 402, 806 548, 470 nd nd Total*** 193 10, 741, 019 582, 874 1, 012, 665 477, 522 9, 077 328, 487 Rivers oils Phenols As Pb Cd Hg 46 4. 6 18. 2 4. 6 0. 3 0. 05 844 68. 4 nd 136. 8 nd 5. 47 592 65. 8 263. 2 526. 4 13. 2 nd 3234 62. 2 248. 8 62. 2 6. 22 6. 84 64, 21 3 951. 3 nd 4, 756. 5 nd 19. 03 Rivers Annual Discharge of Water (km 3) and Some Chemical Substances (tons/year) in Major Chinese Rivers Adjoining NOWPAP Region Luanhe (2002 data) Haihe Yellow Huaihe Yangze *** - without Yangtze River; Total 72, 95 0 1, 179. 84 nd 5, 548. 2 nd 32. 48 8 Total *** 8, 737 228. 54 199. 4 791. 7 34. 52 13. 458
 via rivers in NOWPAP marine areas Marine area") Assessment of dissolved metal input (tons/year) via rivers in NOWPAP marine areas Marine area Fe Mn Zn Cu Pb Cd 2, 756 1, 395 136. 8 136 24. 3 0. 62 14, 599 7, 521 132. 7 327. 3 11. 1 3. 76 12, 738 6, 562 115. 8 285. 6 9. 7 3. 28 1, 861 959 16. 9 41. 7 1. 4 0. 48 Sea Area A (sum) 11, 088 5, 712 100. 8 248. 7 8. 4 2. 86 Marine area A - Japanese** rivers 8, 230 4, 240 74. 8 184. 6 6. 2 2. 12 Marine area A - Russian** rivers 2, 858 1, 472 26. 0 64. 1 2. 2 0. 74 Yellow Sea (by Hong et al. , 1997) Marine area B (sum) Marine area B - Chinese rivers Marine area B - Korean rivers
Assessment of dissolved metal input (tons/year) via rivers in NOWPAP marine areas Marine area Fe Mn Zn Cu Pb Cd 2, 756 1, 395 136. 8 136 24. 3 0. 62 14, 599 7, 521 132. 7 327. 3 11. 1 3. 76 12, 738 6, 562 115. 8 285. 6 9. 7 3. 28 1, 861 959 16. 9 41. 7 1. 4 0. 48 Sea Area A (sum) 11, 088 5, 712 100. 8 248. 7 8. 4 2. 86 Marine area A - Japanese** rivers 8, 230 4, 240 74. 8 184. 6 6. 2 2. 12 Marine area A - Russian** rivers 2, 858 1, 472 26. 0 64. 1 2. 2 0. 74 Yellow Sea (by Hong et al. , 1997) Marine area B (sum) Marine area B - Chinese rivers Marine area B - Korean rivers
 and Some Chemical Substances (tons/year) in Major Korea") Annual Discharge of Water (km 3) and Some Chemical Substances (tons/year) in Major Korea Rivers Flowing into the NOWPAP Region (2002 data) River s Wat e r Han 18. 9 Nakd o n g SS 249, 3 0 7 BO CO NH NO D D TN 4 3 13. 8 34, 5 0 0 33, 0 5, 5 2 4 0 1 48, Geum 6. 6 Yeon g s 145, 8 7 1 O 4 TP 117, 37, 41, 149, 3, 64, 2 0 7 5 2 7 1 9 7 5 0 7 5, 66 5 6 9 4 1 7 7 80, 222, 1 8 2 P 21, 7 8 2 1, 1 45, 5 4 2 1 0 3 8 1, 38 0 0 17, 8 5, 9 4 4 0 4 1 29, 0 4 66 6 2 0 660 1 15, 3 8, 3 14, 0
Annual Discharge of Water (km 3) and Some Chemical Substances (tons/year) in Major Korea Rivers Flowing into the NOWPAP Region (2002 data) River s Wat e r Han 18. 9 Nakd o n g SS 249, 3 0 7 BO CO NH NO D D TN 4 3 13. 8 34, 5 0 0 33, 0 5, 5 2 4 0 1 48, Geum 6. 6 Yeon g s 145, 8 7 1 O 4 TP 117, 37, 41, 149, 3, 64, 2 0 7 5 2 7 1 9 7 5 0 7 5, 66 5 6 9 4 1 7 7 80, 222, 1 8 2 P 21, 7 8 2 1, 1 45, 5 4 2 1 0 3 8 1, 38 0 0 17, 8 5, 9 4 4 0 4 1 29, 0 4 66 6 2 0 660 1 15, 3 8, 3 14, 0
 Normalized parameters of river inputs of water, suspended solids, and some chemical substances for south part of NOWPAP region S, Country 103 km 2 L, km China* 1634 10, 054 Korea 68. 1 6, 050 Q/S, l/s*km 2 Q/L, l/s*km SS/L, t/y. km BOD/L t/y. km COD/L t/y. km NH 4/Lt/ y. km NO 3/Lt/ y. km 193 3. 7 609 *** 58 100. 7 47. 5 31. 9 45. 9 21. 4 241 109. 4 21 45. 1 8. 3 16. 8 Q, km 3 * - without Yangtze River;
 and Pollutants (tons/year) to") Direct Discharge of Municipal Sewage and Industrial Wastewater (million tons/year) and Pollutants (tons/year) to the Chinese (for 2002) Province Sewage Industry wastes COD sewage COD industrial NH 4 sewage NH 4 industrial Phenol oils As Pb CN- Industrial Wastewater Liaoning 13. 6 3. 1 10, 225 1, 477 1, 684 627 nd 0. 006 0. 038 0. 1 Jiangsu 226. 4 10. 4 82, 588 25, 185 9, 616 2, 200 3. 4 16. 5 0. 645 0. 012 0. 6 Shandong 81. 6 52. 3 26, 146 16, 262 3, 480 338 1. 0 14. 8 0. 039 0. 001 0. 2 Total 321. 6 65. 9 118, 959 42, 924 14, 780 3, 165 4. 4 31. 3 0. 690 0. 051 0. 9 nd - no data
Direct Discharge of Municipal Sewage and Industrial Wastewater (million tons/year) and Pollutants (tons/year) to the Chinese (for 2002) Province Sewage Industry wastes COD sewage COD industrial NH 4 sewage NH 4 industrial Phenol oils As Pb CN- Industrial Wastewater Liaoning 13. 6 3. 1 10, 225 1, 477 1, 684 627 nd 0. 006 0. 038 0. 1 Jiangsu 226. 4 10. 4 82, 588 25, 185 9, 616 2, 200 3. 4 16. 5 0. 645 0. 012 0. 6 Shandong 81. 6 52. 3 26, 146 16, 262 3, 480 338 1. 0 14. 8 0. 039 0. 001 0. 2 Total 321. 6 65. 9 118, 959 42, 924 14, 780 3, 165 4. 4 31. 3 0. 690 0. 051 0. 9 nd - no data
 River basins, coasts Wastewaters,") Wastewater Discharge by River Basins and Coasts of Korea (2002) River basins, coasts Wastewaters, 106 tons/year Generated Discharged BOD load, tons/year before treatment after treatment Hang River 240. 5 100. 4 101, 835 1, 095 Nakdong River 304. 8 219. 4 163, 520 2, 555 Geum River 132. 1 62. 4 76, 650 1934. 5 Yeongsan River 14. 2 9. 9 5, 840 127. 8 Seomjin River 3. 3 2. 2 1, 460 40. 2 Other rivers 176. 3 78. 1 106, 215 1, 387 East Coast 180. 3 166. 1 112, 055 1, 277. 5 West Coast 675. 3 135. 1 242, 360 2, 226. 5 South Coast 1, 180. 8 116. 8 62, 415 1, 825 Total 2, 907. 6 891. 3 879, 650 12, 410
Wastewater Discharge by River Basins and Coasts of Korea (2002) River basins, coasts Wastewaters, 106 tons/year Generated Discharged BOD load, tons/year before treatment after treatment Hang River 240. 5 100. 4 101, 835 1, 095 Nakdong River 304. 8 219. 4 163, 520 2, 555 Geum River 132. 1 62. 4 76, 650 1934. 5 Yeongsan River 14. 2 9. 9 5, 840 127. 8 Seomjin River 3. 3 2. 2 1, 460 40. 2 Other rivers 176. 3 78. 1 106, 215 1, 387 East Coast 180. 3 166. 1 112, 055 1, 277. 5 West Coast 675. 3 135. 1 242, 360 2, 226. 5 South Coast 1, 180. 8 116. 8 62, 415 1, 825 Total 2, 907. 6 891. 3 879, 650 12, 410
 Generalized Data on Direct Input of Wastewater and Dumping to the Sea in south of NOWPAP Region River water, km 3 Wastewater, 109 tons/year Wastewater BOD, tons/year Wastewater COD, tons/year Dumping to sea, 106 tons/year China* 193 0. 388 Nd 161, 883 nd Korea** 45. 9 0. 891 12, 410 nd 8. 9 * - Wastewater discharged directly to the coast besides rivers; ** - wastewater discharged directly and partly through the rivers nd - no data
 Recommendations for Future Regional Activities and Priorities 1. Harmonize methodologies and procedures for monitoring water quality by studying relationships between parameters that are now inconsistent: CODMn/CODCr/TOC, and TN/NO 3, and TP/PO 4. Research could be aided by training courses and analysis of existing data. The use of data gathered at automated stations in China and Korea would be very desirable for this purpose. 2. Account for the influence filtered / unfiltered samples have on data used to evaluate river input of contaminants bound to particulate matter. 3. Enhance the effort to obtain reliable data on micro pollutants (dissolved forms of some metals and persistent organic pollutants) in river and coastal water at the national and regional levels. 4. Initiate joint research projects on the use of micro pollutants as indicators of early stage anthropogenic impact on water quality and on the influence of their flux via big rivers on the coastal waters. 5. Promote, through POMRAC activities, cooperative approaches among NOWPAP countries to resolve issues 1 -4 by applying data obtained in other regions (MAP, OSPAR, US EPA). 6. Promote cooperation and information exchange among various environmental programs in the NOWPAP region (NOWPAP, WEPA, NARBO, TEMM, PICES)
 Regional Overview On Atmospheric Deposition of Contaminants into the Marine and Coastal Environment in NOWPAP Region
 Objectives of this Overview • To exchange information to ensure promoting, coordinating and harmonizing regional cooperation related to monitoring of atmospheric deposition of contaminants into marine and coastal environment in NOWPAP Region.
 Each NOWPAP Member presented individual national reports on Atmospheric Deposition and River and direct inputs, featuring the activities and present/future concerns
 Air quality trends of SO 2 in major cities of Korea for the past 12 years Monthly variation of SO 2 in major cities of Korea in 2002
 SO 42") Annual Amount of Deposition NOWPAP Region of Japan (mg/m 2 year, 2002) SO 42 nss. SO 42 NO 3 Cl NH 4 Na K Ca 2 nss. Ca 2 Mg 2 H Rishiri 2506. 1 1430, 7 744 7338, 8 354, 6 4324 190, 0 389, 2 226, 4 520, 0 14, 4 Tappi 2899. 8 1641, 9 1395 8969, 6 352, 8 5037 211, 5 480, 0 292, 0 634, 2 27, 8 Sado 3879. 2 1805, 2 1326, 8 15564 372, 6 8832 363, 6 520, 0 194, 4 1069, 2 32, 5 Oki 5319. 5 2035, 6 1469, 4 23328 351 13110 586, 5 724, 0 245, 6 1550, 3 29, 2 Banryu 2381. 2 1785, 9 1550 4112, 5 421, 2 2392 147, 0 279, 6 190, 4 294, 0 26, 5
Annual Amount of Deposition NOWPAP Region of Japan (mg/m 2 year, 2002) SO 42 nss. SO 42 NO 3 Cl NH 4 Na K Ca 2 nss. Ca 2 Mg 2 H Rishiri 2506. 1 1430, 7 744 7338, 8 354, 6 4324 190, 0 389, 2 226, 4 520, 0 14, 4 Tappi 2899. 8 1641, 9 1395 8969, 6 352, 8 5037 211, 5 480, 0 292, 0 634, 2 27, 8 Sado 3879. 2 1805, 2 1326, 8 15564 372, 6 8832 363, 6 520, 0 194, 4 1069, 2 32, 5 Oki 5319. 5 2035, 6 1469, 4 23328 351 13110 586, 5 724, 0 245, 6 1550, 3 29, 2 Banryu 2381. 2 1785, 9 1550 4112, 5 421, 2 2392 147, 0 279, 6 190, 4 294, 0 26, 5
, mg/m 3 SO 2, ppm") Air pollution in major NOWPAP cities Country SPM (dust), mg/m 3 SO 2, ppm NO 2, ppm China 0. 077 -0. 173 0. 009 -0. 064 0. 021 -0. 048 Japan 0. 012 -0. 031 0. 001 -0. 004 0. 011 -0. 048 Korea 0. 055 -0. 075 0. 003 -0. 005 0. 020 -0. 036 Russia 0. 030 -0. 140 0. 001 -0. 019 0. 040 -0. 100 Source: National Reports on Atmospheric Deposition POMRAC/NOWPAP
Air pollution in major NOWPAP cities Country SPM (dust), mg/m 3 SO 2, ppm NO 2, ppm China 0. 077 -0. 173 0. 009 -0. 064 0. 021 -0. 048 Japan 0. 012 -0. 031 0. 001 -0. 004 0. 011 -0. 048 Korea 0. 055 -0. 075 0. 003 -0. 005 0. 020 -0. 036 Russia 0. 030 -0. 140 0. 001 -0. 019 0. 040 -0. 100 Source: National Reports on Atmospheric Deposition POMRAC/NOWPAP
 • In general, air pollution in NOWPAP Region is still one of the serious environmental problems affecting living quality of the people in the Region. Burning of fossil fuels for energy and transportation purposes are the main causes of the air pollution region-wide. Trans-boundary movement of pollutants within the Region has been highlighted by NOWPAP countries in recent years, including but not limited to dust and storms.
 Distribution of trajectories of pollutant transfer for center of NOWPAP region (according to PGI FEB RAS and FERHRI data. Anthropogenic Emissions of SO 2 is in compliance with data of 1996).
 The status of air pollution in the region can be described by the monitoring results of each NOWPAP country. Monitoring results collected by the Air Pollution Monitoring System in the major cities of the target areas of Japan are: 0. 012 – 0. 031 mg/m 3 for SPM, 0. 001 – 0. 004 ppm for SO 2, and 0. 011 – 0. 048 ppm for NO 2. Each pollutant shows gradual decrease tendency or a level-off year by year. The annual amounts of wet deposition of non-sea-salt sulfate, nitrate and ammonia were in the range of 10 – 25 mmol/m 2/year during the period of 2000 -2002.
 Under China’s monitoring network, 343 cities/counties report their air quality monitoring data to the central government. According to the monitoring results of 2002, 33. 8% of them (116 cities) met the National Ambient Air Quality Standard for Grade II, 35% of them (120 cities) were graded as III, and others (107 cities) as grade III. However, 63. 5% of cities failed to meet the national air quality standard for Grade II in respect of TSP or PM 10 (particulate) annual mean. Acid rain occurred in the areas to the south of Yangzi River and east of Tibet Plateau,and some part of the north China.
 • The monitoring results in 2002 for 309 sites in Korea are as follows: The average level of all cities was in the range of 0. 004 - 0. 010 ppm for SO 2, 0. 019 - 0. 036 ppm for NO 2, 0. 014 – 0. 024 ppm for O 3 and 52 - 76 ug/m 3 in PM 10. The annual loads of wet depositions ranged from 29 to 63 g/ m 2 for sulfate, from 18 to 45 g/ m 2 for nitrate, and from 9 to 22 g/ m 2 for ammonium. • From the observation data at several Primorsky Kray stations of the Russia Far East in 2002, the environmental status can be illustrated by following data. Values of annual wet atmospheric deposition were estimated (g/m 2): Cl 0. 7 -2. 0, SO 4 1. 6 -6. 2, NO 3 0. 3 -0. 7, NH 4 0. 4 -1. 0, Na 0. 3 -0. 8, K 0. 2 -0. 6, Ca 0. 4 -2. 1, Mg 0. 03 -0. 52, Zn 0. 070. 17. These values were comparable with the similar data for the Yellow Sea, North Sea and some coastal areas of the US.
 Dust deposition flux over marine area of northern NOWPAP Region can be estimated as 3. 9 – 7. 7*1012 g m 2 year 1. Sulfate deposition flux is 0. 08 – 1. 5*1012 g m 2 year 1.
 Conclusions • Good monitoring systems existing in every NOWPAP country; • Every country working hard in improving air quality and obtaining achievements; • There are differences in methodologies and procedures in monitoring practice; • Trans-boundary air pollutants movement was highlighted and became an issue in the region; • Limited research has been done on atmospheric deposition of contaminants in the region.
 Recommendations for Future Regional Activities 1. 2. 3. 4. 5. 6. 7. Establish unified monitoring parameters and analytical methods for atmospheric deposition in the region; Initiate a regional research project on atmospheric deposition of contaminants; Establish a regional integrated monitoring network; Establish a regional data base as the mechanisms for information sharing; Set up regional strategies on trans-boundary movement of air pollutants; Further strengthen capacity building and institutional building; Fully use the outcomes of EANET and work jointly with EANET on atmospheric deposition; Promote the development of air pollution control technologies in way of regional cooperation.
 “State of the Marine Environment Report in the NOWPAP Region” was prepared based on suggestions proposed at the Intersessional Workshop held in Seoul in July 2005 and following a decision of the 10 th Intergovernmental Meeting (Toyama, 24 -26 November, 2005).
 This report, based on data from the Regional Overviews prepared by NOWPAP RACs and on materials in other published sources, summarizes the current status of the marine environment in the NOWPAP region, describes major existing and emerging environmental problems, highlights knowledge gaps, and presents approaches on how to move forward to solve these problems.
 Contents Executive Summary 1. Introduction 2. Geographical Features of the NOWPAP Marine Area 3. Human Pressure 4. Current Marine Environmental Issues 4. 1. Atmospheric Pollution 4. 2. River and Waste Water Pollution 4. 3. Harmful Algae Blooms 4. 3. 1. Red Tides and Eutrophication 4. 3. 2. Toxin-Producing Plankton 4. 3. 3. Countermeasures and Suggestions on HABs 4. 4. Oil Spills 4. 5. Coastal Environment Hot Spots 4. 6. Biodiversity and Changes in Algae and Animal Communities 5. Emerging Environmental Issues 5. 1. Marine Litter 5. 2. Persistent Toxic Substances (PTSs) 5. 2. 1. Current PTS Issues 5. 2. 2. NOWPAP GEF Project 5. 3. Hazardous and Noxious Substances (HNS) Spills 5. 4. Marine Invasive Species 5. 5. Other GPA Pollution Issues 5. 6. Other Issues: Aquaculture, Microbiological Pollution, Biodiversity, Protected Areas 6. Assessment and Recommendations 6. 1. Summary of Current Conditions 6. 2 Emerging Issues 6. 2. 1. Integrated Coastal Area and River Management (ICARM) 6. 6. 2. Data and Information Management 6. 2. 3. Policy and Legislation 6. 2. 4. Biodiversity Conservation 6. 2. 5. Invasive Species 6. 2. 6. Other Recommendations (from GIWA, GPA and PICES) Literature
 The main goal of this report was to give a holistic description, analysis and overview of marine environmental problems of NOWPAP sea area. The specific objectives of the State of the Marine Environment Report were the following: - To assess the current state of the marine environment in the NOWPAP area, with attention to recent changes in the environmental conditions and the impacts of human activities on the marine environment and coastal areas - To identify current regional concerns and emerging issues which present major challenges - To present actions and measures suggested in different programs/projects for the decisions of environmental concerns and issues to help decision makers to meet these challenges at the national level, as well as in Regional contexts.
 Four priority problems were identified within the source categories of the GPA (www. unep. gpa. IGR 2006), namely: sewage and management of municipal wastewater, nutrient over-enrichment, marine litter and physical alteration and destruction of habitats. These problems have been designated as an area for priority attention in most regions, and are the subject of novel approaches. Six emerging challenges deserve special attention: nutrient over-enrichment in relation to coastal dead zones, depletion of freshwater flows, the importance of coastal and freshwater wetlands, the abundant stream of new chemicals, the importance of resilient coastal habitats for coastal protection, and sea level rise.
 The major sources of air, river and waste water pollution in the NOWPAP region are evaluated and compared. There is clear evidence that air pollution by dust (suspended particles), N, P, Cd, and Pb containing substances are dominant in the eastern portion of the region. In the western portion, the role of atmospheric inputs range from 26% to 42%.
 and river input (other colors) of different substances") Relative role of atmospheric input (blue) and river input (other colors) of different substances on NOWPAP marine area A” (left) and NOWPAP marine area “B” (right)
Relative role of atmospheric input (blue) and river input (other colors) of different substances on NOWPAP marine area A” (left) and NOWPAP marine area “B” (right)
 Analysis of air and river pollution problems demonstrates a need to take action on the following key issues: Unify monitoring parameters, methodologies and technical standards/criteria used in NOWPAP member country studies. The lack of unified standards limits the effort to jointly address atmospheric deposition and contaminated river inputs in the NOWPAP region; Conduct additional joint research and develop an integrated regional monitoring network that tracks dust/sand storms and that looks for ways to reduce pollution delivered by rivers and transboundary movement of pollutants such as dust and storms in the NOWPAP region; and Expand the effort to obtain reliable regional and national level data on trace pollutants (dissolved forms of some metals and persistent organic pollutants at µg and ng volumes) in air pollution and on river and coastal water pollutants.
 Types of Coastal Environmental Hot Spots in NOWPAP Marine Area Problem Type of Problems Source of Problems Estuarine zones (river input) - Elevated concentrations of harmful substances in water, including suspended solids, bottom sediments and organisms due to additional input with river flux Wastewater inputs and river pollution Direct input (Dumping and sewages - Elevated concentrations of harmful substances in water, bottom sediments and organisms due to sewage inputs and dumping of solids - Physical disturbance of benthos habitats Liquid and solid wastes inputs to the sea without proper treatment; Port activity - Pollution of coastal waters during port operations, and wastes from the ships; - Loss of habitats and biodiversity. Inefficient management of port activities; Inevitable contradiction between water use Aquaculture activity - Pollution of coastal waters within aquaculture farm by nutrients and some other chemical substances; - Deterioration of the aquaculture resources Excessive high density of aquaculture for given water body; Inefficient feeding, improper management Mineral resources exploration and exploitation - Pollution by industrial wastes, sewages, leakages; - Accidental spills; - Destruction of benthos and sea mammals habitats Inefficient management of exploration and exploitation; Inevitable contradiction between water use
 One of the major overview recommendations became development of works for Integrated Coastal Area and River Basin Management (ICARM).
 Thank You Very Much