8d944f51b1ddd875d02cdb437ef7b40f.ppt
- Количество слайдов: 30


 Diane Stanitski, Michael Johnson, Sidney Thurston Office of")
NOAA’s Office of Climate Observation (OCO) Diane Stanitski, Michael Johnson, Sidney Thurston Office of Climate Observation Silver Spring, Maryland, USA DBCP-20 Technical Workshop Chennai, India 18 -19 October 2004

Overview • The role of the Office of Climate Observation • Status of the global ocean observing system • The Observing System Monitoring Center • • (OSMC) Adopt a Drifter Program with international collaboration Plans for enhancement of the global ocean array and additional observations in the Indian and Arctic Oceans

The Office of Climate Observation a contribution to international ocean observations and monitoring http: //www. oco. noaa. gov/

OCO Mission Build and sustain a global climate observing system that will respond to the long-term observational requirements of the operational forecast centers, international research programs, and major scientific assessments. Partnerships are Central A global observing system by definition crosses international boundaries. The potential exists for both benefits and responsibilities to be shared by many nations. NOAA’s ocean contributions are managed in cooperation with the Joint WMO/IOC Technical Commission for Oceanography and Marine Meteorology (JCOMM).

Capabilities Required for the Ocean Component • Global coverage by moored and • • • drifting buoy arrays, profiling floats, tide gauge stations, and repeated ship lines Continuous satellite missions for sea surface temperature, sea surface height, surface vector wind, sea ice, and ocean color Data and assimilation subsystems System management and product delivery

The Job of the Ocean Component • Document long term trends in sea • • • level change Document ocean carbon sources and sinks Document the ocean’s storage and global transport of heat and fresh water Document the ocean-atmosphere exchange of heat and fresh water

Global Ocean Observing System for Climate Initial Design. It will Evolve. Now nearly 48% complete. Sea Surface Temperature, Sea Surface Height, Surface Vector Wind, Sea Ice, and Ocean Color from Space Tide Gauge Network 3˚x 3˚ Argo Profiling Float Array 5˚x 5˚ Surface Drifting Buoy Array Moored Buoy Ocean Reference Station High Resolution XBT and Flux Line Frequently Repeated XBT Line Carbon Inventory & Deep Ocean Line 58 % complete 35% complete 45 % complete Existing Planned Global Survey @ 10 years
 • Subtask 1 -- Monitor the status of the")
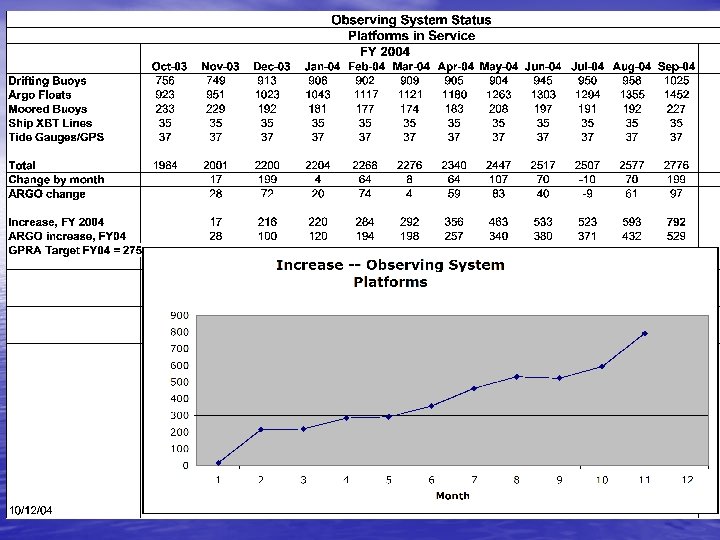
OCO Management Plan (6 Subtasks) • Subtask 1 -- Monitor the status of the globally distributed networks; report system statistics and metrics routinely and on demand. • Subtask 2 -- Evaluate the effectiveness of the system; recommend improvements. Sept 2004 Drifting Buoys: 1025 Target: 1250
 • Subtask 3 -- Advance the multi-year program plan;")
OCO Management Plan (6 Subtasks) • Subtask 3 -- Advance the multi-year program plan; evolve the in situ networks to achieve global coverage. • Subtask 4 -- Focus intraagency, interagency, and international coordination. All of NOAA’s ocean contributions are managed in cooperation with JCOMM -- presently 60 nations.
 Annual System Review, 2004 • Subtask 5 -- Organize")
OCO Management Plan (6 Subtasks) Annual System Review, 2004 • Subtask 5 -- Organize external review and user feedback. • Subtask 6 -- Produce annual reports on the state of the ocean and the adequacy of the observing system for climate. –Chapter 1: • The Role of the Ocean in Climate –Chapter 2: • The State of the Ocean –Chapter 3: • The State of the Observing System –Chapter 4: • The State of the Science

• OCO Subtask 3 -- Advance the Multi-Year Program Plan; evolve the in situ networks to achieve global coverage. 2000 2001 2002 2003 Tide Gauges 34 34 37 37 Surface Drifting Buoys 807 671 779 787 Tropical Moored Buoys 77 77 79 79 Ships of Opportunity 23 Argo Floats 200 Reference Stations 15 Arctic System 29 24 310 544 29 29 System Evaluation 340 0 26 39 2005 43 2006 2007 2008 2009 2010 45 52 62 86 86 1050 1250 1250 79 29 37 30 30 24 370 497 1 1 2 41 31 24 Number of buoys 84 90 100 115 Number of moorings 40 40 45 45 High resolution and frequently repeated lines occupied 42 36 27 497 531 3 GPS/DORIS Stations Initial GCOS Subset 82 3000 3000 923 1500 2300 35 1 Ocean Carbon Network Dedicated Ship Time 26 2004 7 Number of floats 49 60 78 89 Number of observatories, flux, and ocean transport stations 36 54 64 78 85 Ice buoys, drifting and Moored stations 27 29 31 31 31 Repeat Sections Committed, One inventory per 10 years 531 640 730 830 Days at sea (NOAA contribution) 7 7 7 Product evaluation and feedback loops implemented 42 (NOAA contribution) Initial Ocean Observing System Milestones including international contributions Total System 30 34 40 45 2000 2001 2002 2003 55 66 77 88 100 48 53 2004 2005 2006 2007 2008 2009 2010 System % Complete
 shows the types, location and timing of in-situ observations")
Observing System Monitoring Center (OSMC) shows the types, location and timing of in-situ observations throughout the global oceans • Observational Density – a daily reference for SST, SLP, air temp, wind speed and direction, dew point temperature and cloud cover from ships, drifting and moored buoys • Observational Density Animations – 6 animations of valid weekly observations of SLP, SST, and Winds observed in a 5 x 5 box with two different thresholds • Sea Surface Temperature Observations – data collected from ships [via ship intake, bucket and hull] as well as from buoys [fixed and drifting] • Depth of Salinity and Temperature Observations – data collected during depth profiles and data showing the depth of each profile

ADOPT A DRIFTER PROGRAM Teachers Deploy Drifters, Collect Data, and Analyze in Near Real Time • Opportunity for K-16 teachers and their students • • • to adopt a drifting buoy and map its path Drifter is deployed by teacher(s) while participating in NOAA’s Teacher at Sea Program U. S. school partners with an international school to mutually adopt a drifter and then track and map the drifter and monitor its output Teachers work with students to develop and test lesson plans linked with ocean circulation, winds, etc.

What are the Office of Climate Observation’s Priorities and Plans?

FY 2003 -04 Priorities Incremental advancements across all networks with emphasis on these priority areas: 1. Sea Surface Temperature -- the single most 2. 3. important variable in the heat, carbon, and water cycles; used to drive all forecast models Sea level change -- the most immediate impact of climate change Ocean carbon inventory -- priority for climate change science and technology policy

FY 2005 Priorities Incremental advancements across all networks with emphasis on these priority areas: • Sea Surface Temperature – Complete the global drifting buoy array -- 1250 drifters – The first element of the Global Climate Observing System to be completed • Sea Level – Transition the Absolute Altimeter Calibration Station from NASA to NOAA funding – Continue upgrading the “GCOS subset” of the GLOSS tide gauge network: 43 of 170 stations • Ocean Carbon inventory surveys (NOAA-NSF, 1/3 - 2/3) – Fully fund 10 -year repeat survey cycle (vs 14 years) • Complete the global TAO network -- advance to the Indian Ocean: – – – FY 05 -- 3 moorings in the water FY 06 -- 5 moorings in the water FY 07 -- 7 moorings in the water • Advance data, assimilation, and product delivery – Initiate an Ocean Analysis program (routine products) – Expert Team to continually evaluate the effectiveness of the system

FY 2006 Planning – Enhance the tropical moored buoy network – Additional Indian Ocean buoys – Tropical Atlantic North East Extension – Salinity Sensors – Upgrade seven sites to Ocean Reference Stations – Technology development - Next Generation – TAO transition – OCO as central office for data management

Indian Ocean Planning • International planning as part of the GOOS, GCOS, • • and CLIVAR Moored buoys, Argo floats, surface drifters, SOOP measurements, time series reference stations, tide gauges, and satellite remote sensing NOAA fully supports IO expansion and recognizes this as one of the biggest gaps in the global ocean observing network Contributions from many parties is critical: nations, agencies, international bodies Timely, open access to data (encourage all data on GTS)

FY 2007 NOAA Planning – Incremental advancements across all networks with emphasis on these priority areas: • Polar regions, especially the Arctic, for impacts of climate change • Ocean circulation changes to monitor for possible indications of abrupt climate change • Ocean-atmosphere exchange of heat and water particularly in support of drought early warning and diagnostics

Conclusions • An international plan is in place to complete the • • • initial global ocean observing system by 2010 The OSMC is a decision support facility reporting current/historical status of globally distributed networks The Adopt A Drifter Program is a new effort supported by the OSMC to enhance international partnerships and infuse real-time ocean data into curricula OCO priorities include enhancement of all ocean networks and expansion into the Indian and Arctic Oceans

Thank You!!! NOAA Office of Climate Observation 1100 Wayne Avenue Silver Spring MD 20910 USA climate. observation@noaa. gov

Office of Climate Observation - the one-stop shop for international ocean data access • The OCO would like to be the central • • clearinghouse for ocean data Links to all sources of ocean data for field projects to global networks will be provided at the OCO web site, www. oco. noaa. gov urls will link to all sources of complete ocean datasets We need your help! Please send the urls for global and regional ocean datasets that you know exist. They will be included on our website. …an ongoing project!!

Expert Team Framework: Focus on State Variables • A suite of products documenting: • Sea level to identify changes resulting from climate variability. • Ocean carbon content every ten years and the air-sea exchange seasonally. • Sea surface temperature and surface currents to identify significant patterns of climate variability. • Sea surface pressure and air-sea exchanges of heat, momentum, and fresh water to identify changes in forcing functions driving ocean conditions and atmospheric conditions. • Ocean heat and fresh water content and transports to identify where anomalies enter the ocean, how they move and are transformed, and where they re-emerge to interact with the atmosphere. Identify the essential aspects of thermohaline circulation and the subsurface expressions of the patterns of climate variability. • Sea ice thickness and concentrations. Evaluation: continually test the observing system against the products; recommend improvements.

XBT’s, Drifters, Tide Gauge Stations in the Indian Ocean • XBT Network – 5 high resolution XBT ship lines to be completed in 2005 following a “line sampling” strategy – Some regularly sampled lines not reporting on GTS or delayed mode – XBT workshop to be held in Goa, India during spring 2005 • Drifters - 100 new drifting buoys purchased • Both need doubled resources for full implementation • Upgrades will be made to 4 tide gauge stations in the IO

• Arctic –Ice buoy data processing funded by OCO = additional buoys Automated Drifting Stations Ice Mass Balance buoys Courtesy of John Calder

Ocean Observations The Arctic Ocean and high latitude seas are expected to experience large change if global warming projections are accurate. These changes can result in feedback to the climate system, and/or impact marine cosystems. The rate of ecosystem change is projected to be fast and can alert us to the types of changes that may occur elsewhere. • Flux of heat and freshwater to and from the Arctic Ocean • Climate-ecosystem interactions in the Northern Bering and Chukchi Seas Courtesy of John Calder

Teachers Deploy Drifters, Collect Data and Analyze in Near Real Time • Helping to Predict • • Hurricanes Revealing Ocean Temperature Patterns Monitoring Ocean Currents, Winds Groundtruthing Satellite Data Predicting the Path of Ocean Pollutants http: //www. aoml. noaa. gov/phod/dac/gdc. html

Indian Ocean Focus • Indian Ocean influences dynamics of Indian and • • Asian monsoons The IO affects climate over North America via monsoon-ENSO interactions and atmospheric intraseasonal oscillations spawned over the IO IO array is designed to improve description, understanding, and prediction of large oceanatmosphere interactions and their influence on regional and global climate

Tropical Indian Ocean Moored Buoy Array The evolving design of a sustained observing system for the Indian Ocean. The system includes a 3°x 3° Argo profiling float array, 5°x 5° surface drifting buoy array and a realtime tide gauge network. An XBT training workshop will be held in Goa, India, during spring 2005.
8d944f51b1ddd875d02cdb437ef7b40f.ppt