c92ca662fb9addcfb8f494aefaf66584.ppt
- Количество слайдов: 41


No GSEG? Low Budget Data Initiative with High Dollar Impact Lisa Backer 619 Co-Coordinator/ECSE Specialist MN Department of Education lisa. backer@state. mn. us

The Context A bit about Minnesota….

Minnesota is the birthplace of…. • • • Water-skiing SPAM Bob Dylan Judy Garland Target Stores Prince

We are home to… • The Mall of America • The first professional wrestler to hold the office of Governor • The headwaters of the Mississippi River • The world’s largest ball of twine • Yes, I that says “twine”


MN Is “Birth Mandate” State • Education is the lead agency for Part C • Interagency agreements with MN Depts. Of Health and Human services • Free, Appropriate Public Education provided to young children from birth • Local efforts driven by Interagency Early Intervention Committees (IEIC’s)

MN’s Continuous Improvement Process • 2000: Completion of Self Assessment & Identification of 12 Priority Areas • 2001: Planning year for Areas 1 -5 • 2002: Implementation of Areas 1 -5 Planning year for Areas 6 -8 • 2003: Implementation for Areas 1 -8 Planning year for Areas 9 -12

Identified Priority Areas • • Workforce Diversity Child Find Mental Health Service Coordination Educational Results Inclusion • Assistive Technology • Transitions • Accountability and Compliance • Family Involvement • Geographic Disparities
 • Alternative to traditional compliance")
Continuous Improvement Monitoring Process: Self Review (Mn. CIMP: SR) • Alternative to traditional compliance monitoring • 80% of all districts participate • Uses baseline data and tracks improvement in key areas – Graduation/dropout rates – Suspension/expulsion – Standardized test scores & Alternate Assessments – Least Restrictive Environments

Mn. CIMP: SR Process • Planning Phase – Initial program evaluation – Compliance self-review – Planning report submitted to MDE • Implementation – Data analysis – Impact of initiated improvement strategies – Report submitted to MDE

Mn. CIMP: SR Process • Verification Visit by MDE monitor and trained “peer” monitors • Report of visit generated by MDE and provided to district leadership and staff • Children served through Part C and 619 were planfully included in verification visit activities.

Questions Posed by OSEP • Is Minnesota identifying all eligible infants Birth to Age 1? • Do the identified infants & toddlers reflect the demographics of the local area ? • How effective are primary referral sources ?

And More Questions…. . • Do primary referral sources differ by age (<1, 2, 3) ? • Are IEICs and their member agencies effectively identifying young children and their families? • Is there variability from one part of the state to another?

And Finally…. • The APR • Minnesota’s data SNAFU – Age on December 1 rather than September 1 • OSEP Verification Visit

QBQ: The Questions Behind the Question • Who’s to blame? • Why are we so disorganized/dysfunctional? • Why won’t our administration fiscally support a better data system? • What can I do?

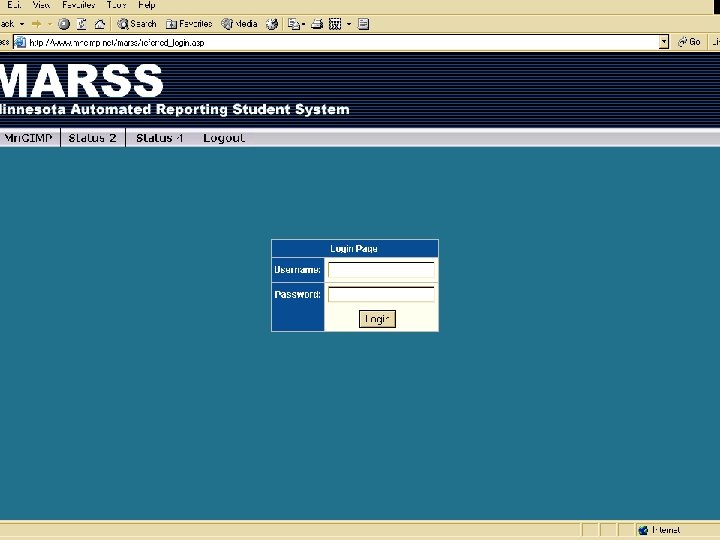
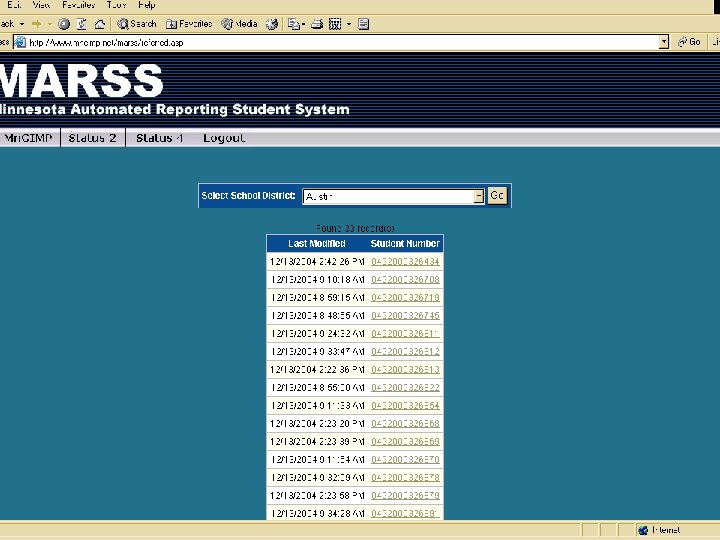
MN’s Existing Data System • MARSS System – Minnesota Automated Reporting Student System • Unique identifier assigned at time of enrollment – Initial evaluation – Determination of eligibility

Key Data Elements in MARSS • District • Race/Ethnicity • Instructional Settings • Gender • Economic Indicator • Mobility Indicator • Home Primary Language • Primary Disability • Status End Codes • Hours of Service (membership)

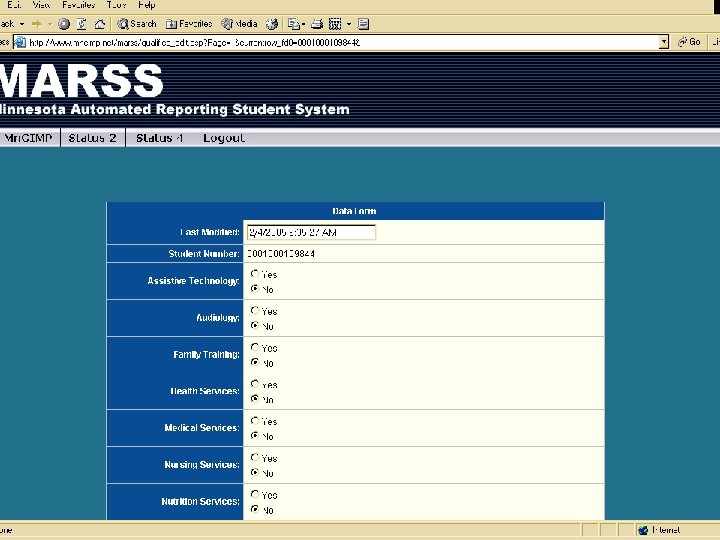
“Missing” Data Elements • Services by individual child • Child and Family Outcomes • Primary and Secondary Referral Sources

Part C Enhanced Data Collection • Added to existing “rogue” website • Set-up cost absorbed by existing State Improvement Grant • Data analysis done by staff from Department of Education • Mandatory participation by districts


Indicators


Areas of Quality • • • Child Find/Determining Eligibility Functional Child Goals or Outcomes Instructional Settings/Inclusion Comprehensiveness & Intensity of Service Routines-based, Transdisciplinary Intervention • Measuring Child Progress • Family Outcome Measures

ECSE Quality Indicators • Child Find/Determining Eligibility • Instructional Settings/Inclusion • Comprehensiveness & Intensity of Service • Measuring Child Progress • Family Outcome Measures

Child Find Indicators • • Percent of general population <1 Percent of general population 0 through 2 Percent of general population 0 through 4 Proportion of identified children from a racial/ethnic group compared to the racial/ethnic makeup of the general population

Additional Child Find Indicators • Use of a variety of disability criteria • Proportion of kindergarten enrollment initially determined eligible and the primary disabilities of those children. • Proportion of referrals made by specific primary and secondary sources

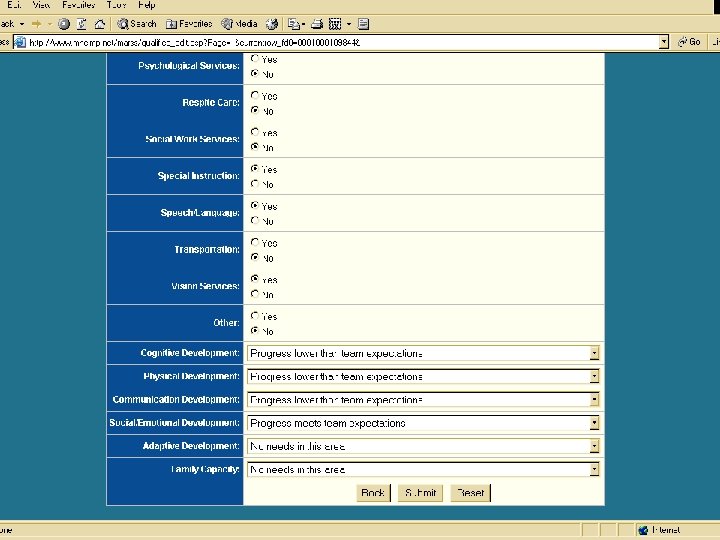
Child Progress • What percent of children served under age 3 demonstrates improved and sustained functional abilities? – Cognitive development; – physical development, including vision and hearing; – communication development; – social or emotional development; and – adaptive development.

Child Outcomes • Young children with disabilities entering kindergarten demonstrate increased levels of proficiency in the areas – Physical well-being and motor development – Social and Emotional Development – Approaches to learning – Language Development – Cognition – Creativity and the Arts

Comprehensiveness & Intensity • Local areas comprehensively identify needs and provide a full array of early intervention services. • A range of intensity is evident within each district’s ECSE program – By age? – By Primary Disability?

Natural Environments/LRE • Proportion of infants/toddlers served in natural environments – At home – In programs designed for children without disabilities • Proportion of children age 3 through 5 served in Early Childhood Settings or at Home

Family Participation • Supports, services and resources provided to each family increase the family’s capacity to enhance the development of their child.

Sometimes the Plants and Stars Align…. . November, 2004

Putting Data to Work • Easy access • Ease of use • Meaningful comparisons – State – Region – Strata – To the individual district as trends over time • Accuracy

2003 -2004 ECSE District Profile • Based on Excel 2000 • Utilized “Lookup” functions • Displayed data on those indicators for which accurate data was available • Annually updateable • Will “live” on MDE website on the Continuous Improvement landing page

District Profile In Action
c92ca662fb9addcfb8f494aefaf66584.ppt