811b556f0f7ba630ea847b3d233d75c3.ppt
- Количество слайдов: 121
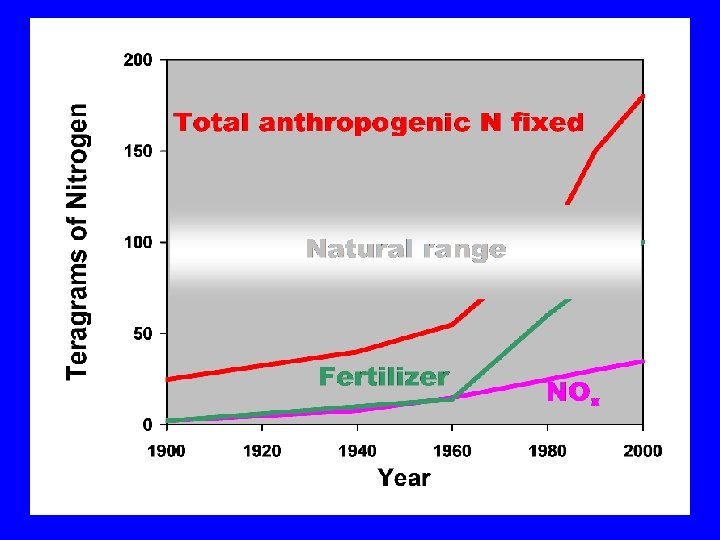
 Nitrogen deposition and extinction risk in carnivorous plants: ecological challenges for the next century Nicholas J. Gotelli Department of Biology University of Vermont Burlington, VT 05405 U. S. A.

 Effects of N Deposition • Individual ØAltered morphology ØChanges in reproduction, survivorship
 Effects of N Deposition • Individual ØAltered morphology ØChanges in reproduction, survivorship • Population ØIncreased long-term extinction risk ØChanges in short-term dynamics
 Effects of N Deposition • Individual Ø Altered morphology Ø Changes in reproduction, survivorship • Population Ø Increased long-term extinction risk Ø Changes in short-term dynamics • Community Ø Changes in abundance and composition Ø Altered nutrient transfer and storage
 Effects of N Deposition on Carnivorous Plants • • • Life History Effects on Individuals Effects on Populations Effects on Communities The Role of Ecologists
 Effects of N Deposition on Carnivorous Plants • • • Life History Effects on Individuals Effects on Populations Effects on Communities The Role of Ecologists
 Carnivorous plants: wellknown, but poorly studied
 Carnivory in plants • Phylogenetically diverse • Morphological, chemical adaptations for attracting, capturing, digesting arthropods • Common in low N habitats • Poor competitors for light, nutrients
 Family Sarraceniaceae Genus Common Name Number of Species Distribution Darlingtonia Cobra Lilly 1 Northwest USA Heliamphora Sun Pitchers 5 North-central South America Sarracenia Pitcher Plants 8 Eastern USA, Canada
 Genus Sarracenia • • • 8 described species Center of diversity in southeastern US Many subvarieties Extensive hybridization Sarracenia purpurea (New Jersey. Canada)
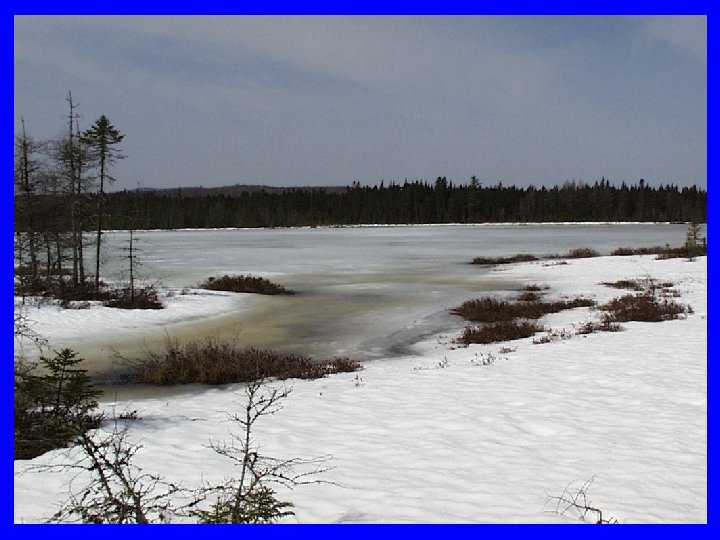
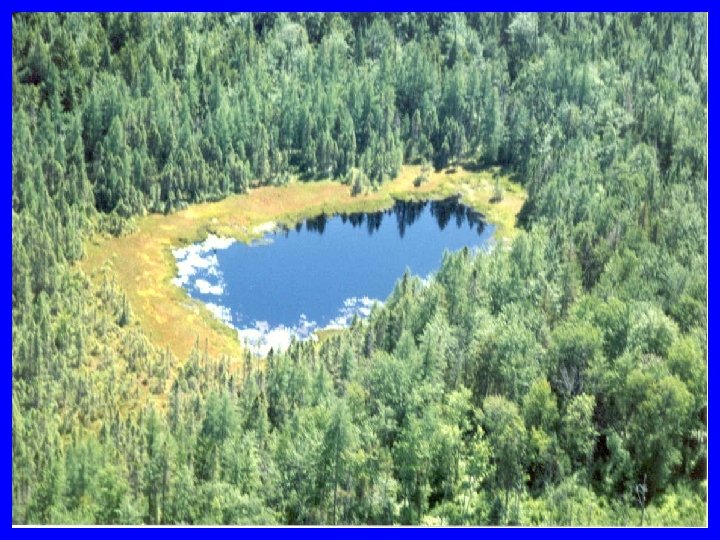
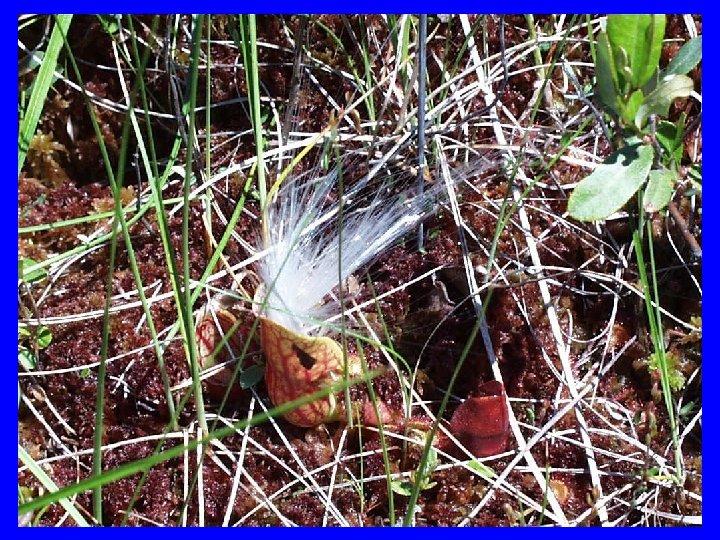
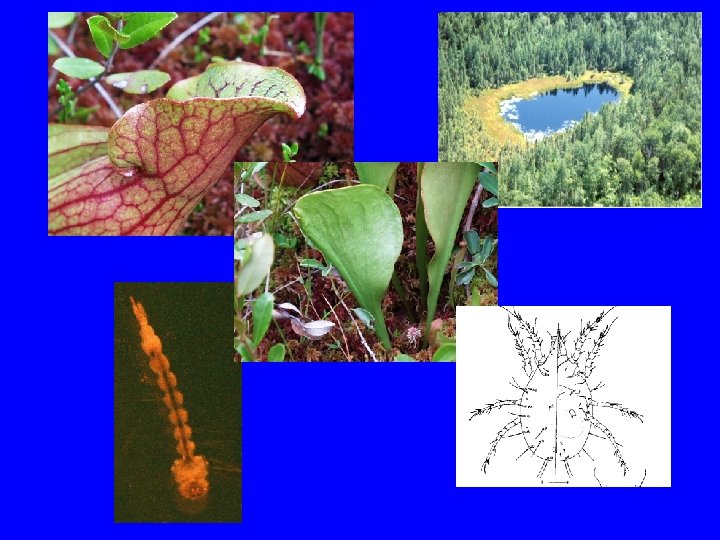
 The Northern Pitcher Plant Sarracenia purpurea • Perennial plant of low-N peatlands • Lifespan 30 -50 y • Arthropod prey capture in waterfilled pitchers • Diverse inquiline community in pitchers
 Sarraceniopus gibsoni Wyeomyia smithii The Inquilines Blaesoxipha fletcheri Habrotrocha rosa Metriocnemus knabi
 Inquiline food web
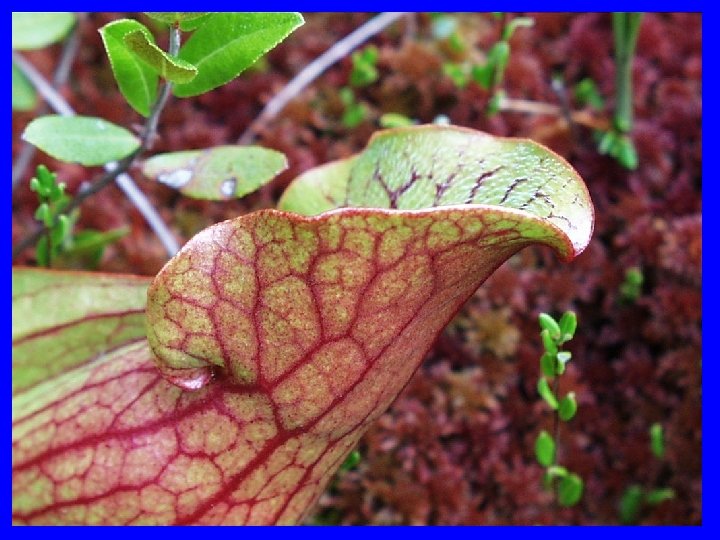
 Phyllodia • Flat leaves • No prey capture • High concentration of chlorophyll, stomates • Photosynthetically more efficient than pitchers
 Flowering Stalks • Single stalk per rosette • Flowering after 3 to 5 years • Bumblebee, fly pollinated • Short-distance dispersal of seeds
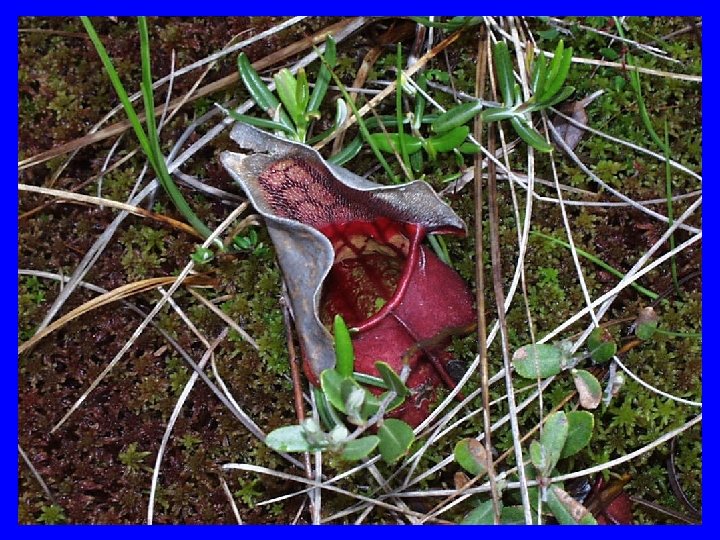
 Leaf Senescence • End-of-season die off • Production of new leaves in following spring • Annual increase in rosette diameter
 Effects of N Deposition on Carnivorous Plants • • • Life History Effects on Individuals Effects on Populations Effects on Communities The Role of Ecologists
") Nutrient Treatments • • • Distilled H 20 Micronutrients Low N (0. 1 mg/L) High N (1. 0 mg/L) Low P (0. 025 mg/L) High P (0. 25 mg/L) • N: P(1) Low N + Low P • N: P(2) Low N + High P • N: P(3) High N + Low P Nutrient Source: Micronutrients: Hoaglands N: NH 4 Cl P: Na. H 2 PO 4
Nutrient Treatments • • • Distilled H 20 Micronutrients Low N (0. 1 mg/L) High N (1. 0 mg/L) Low P (0. 025 mg/L) High P (0. 25 mg/L) • N: P(1) Low N + Low P • N: P(2) Low N + High P • N: P(3) High N + Low P Nutrient Source: Micronutrients: Hoaglands N: NH 4 Cl P: Na. H 2 PO 4
 Anthropogenic N additions alter growth and morphology
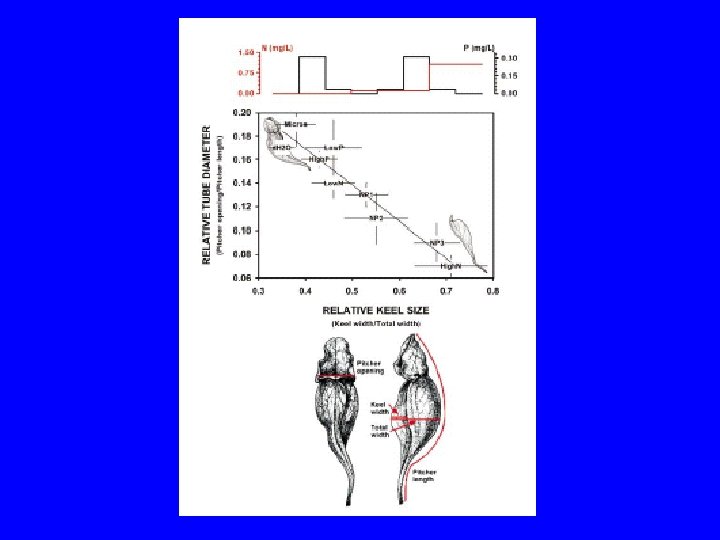
 Anthropogenic N additions alter growth and morphology Increasing N
 Effects of Anthropogenic N additions • Increased production of phyllodia ØPhenotypic shift from carnivory to photosynthesis • Increased probability of flowering
 Contrasting effects of anthropogenic N vs. N derived from prey
 Food Addition Experiment • • Ecological “press” experiment Food supplemented with house flies Treatments: 0, 2, 4 , 6, 8, 10, 12, 14 flies/week Plants harvested after one field season
 Food additions do not alter growth and morphology Increasing prey
 N uptake increases with food level
 P uptake increases with food level
 N: P ratio decreases with increasing food supply
 Altered N: P ratios suggest P limitation under ambient conditions Ambient P limitation (Koerselman & Meuleman 1996, Olde Venternik et al. in press)
 Food additions do not alter growth and morphology Increasing prey
 Anthropogenic N additions alter growth and morphology Increasing N
 Contrasting effects of anthropogenic and natural sources of N Anthropogenic N ØAltered N: P ratios ØMorphological shift ØReduction in prey uptake Prey N ØUptake, storage of N & P ØNo morphological shifts ØContinued prey uptake
 Effects of N Deposition on Carnivorous Plants • • • Life History Effects on Individuals Effects on Populations Effects on Communities The Role of Ecologists
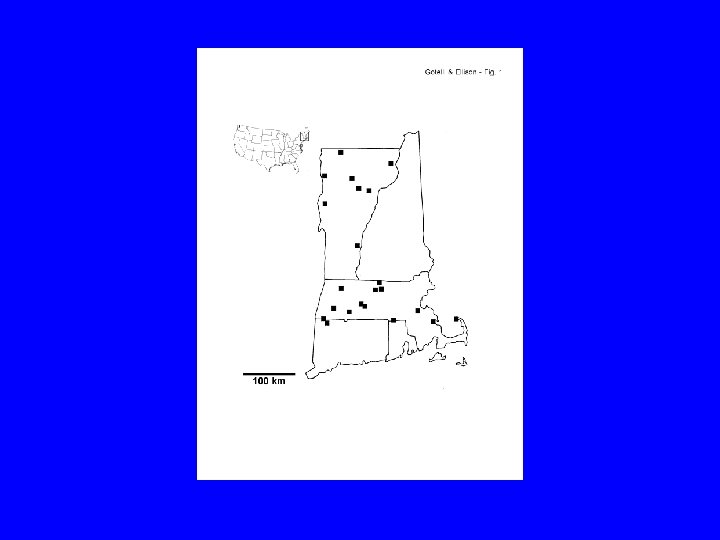
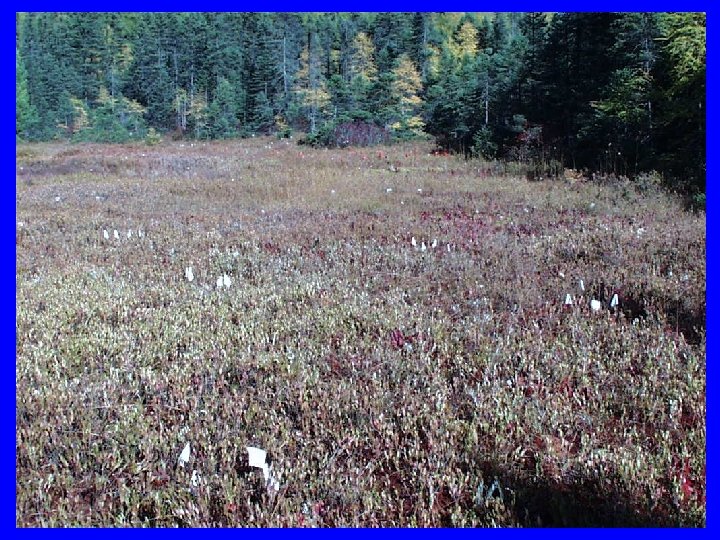
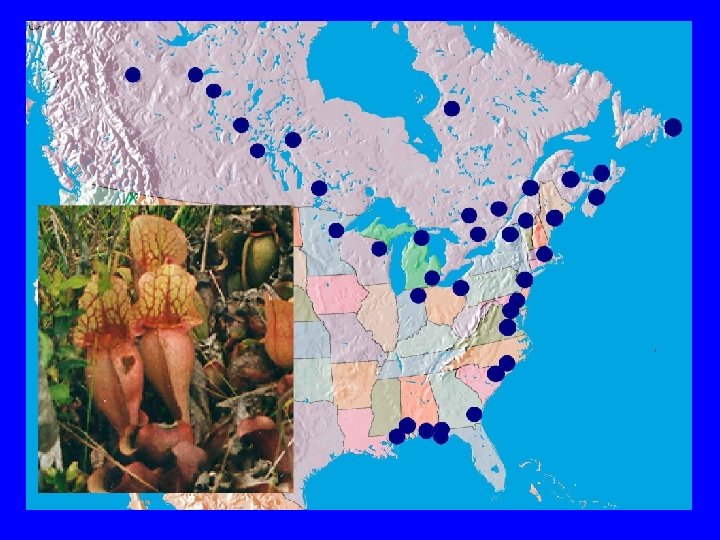
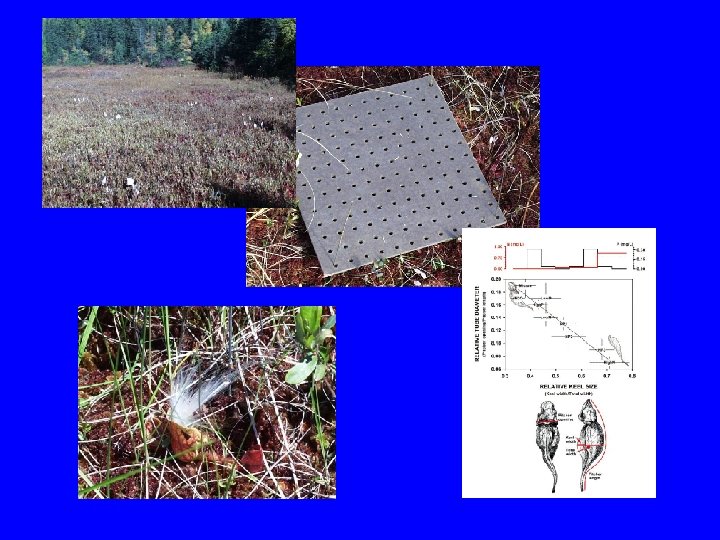
 Study Sites
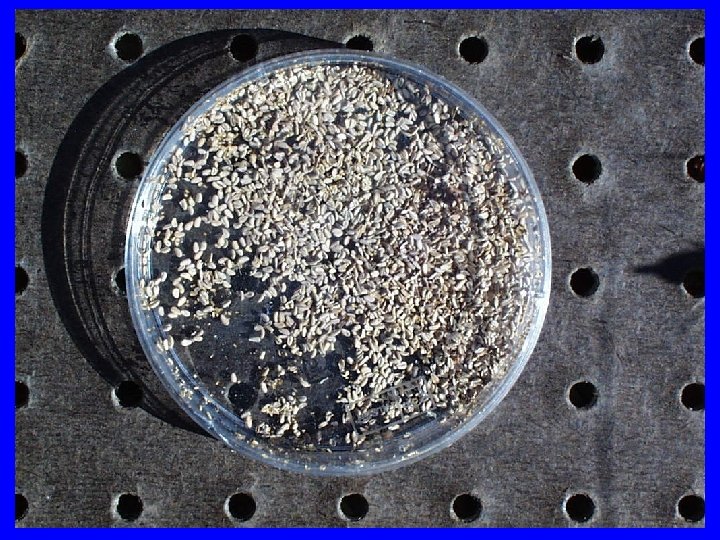
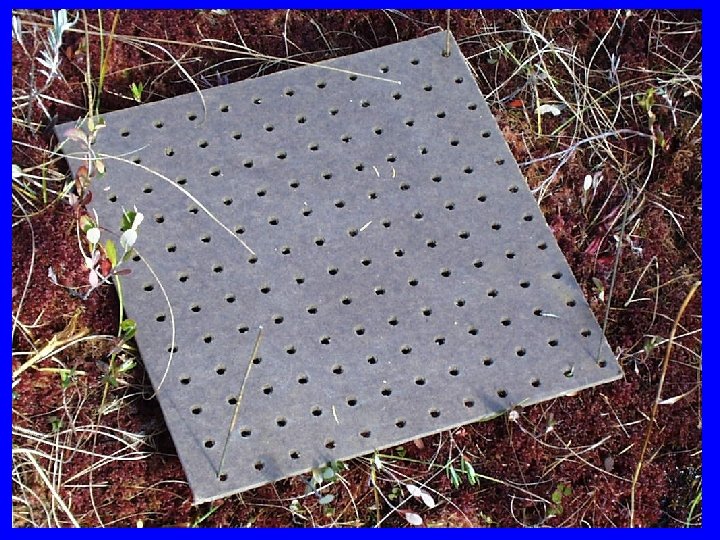
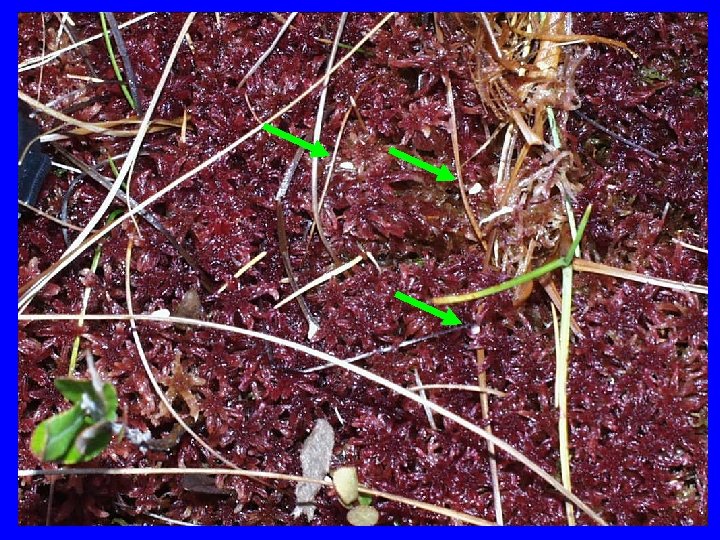
 Demography survey • 100 adult, juvenile plants tagged at each site • Plants censused and measured each year • Seed plantings to estimate recruitment functions
 Recruits Juveniles Adults Flowering Adults Sarracenia matrix model
 4. 00 Recruits 0. 10 Juveniles 0. 04 Adults 0. 09 0. 95 0. 18 0. 83 0. 70 Flowering Adults 0. 17 Hawley Bog Transitions
 4. 00 Recruits 0. 10 Juveniles 0. 13 Adults 0. 17 0. 85 0. 10 0. 66 0. 71 Molly Bog Transitions Flowering Adults 0. 31
 nt+1 = Ant Population vector at time (t + 1)") Matrix Transition Model (stationary) nt+1 = Ant Population vector at time (t + 1) Transition matrix Population vector at time (t)
Matrix Transition Model (stationary) nt+1 = Ant Population vector at time (t + 1) Transition matrix Population vector at time (t)
 Population Projections Site r individuals/individual • year Hawley Bog 0. 00456 Doubling Time 152 y Molly Bog 0. 00554 125 y
 Deterministic Model: Results • Growth, survivorship, and reproduction are closely balanced in both sites • Doubling times > 100 y • Juvenile, adult persistence contribute most to population growth rate • Sexual reproduction, recruitment relatively unimportant
 nt+1 = Atnt Population vector at time (t + 1)") Matrix Transition Model (stochastic) nt+1 = Atnt Population vector at time (t + 1) Random transition matrix at time (t) Population vector at time (t)
Matrix Transition Model (stochastic) nt+1 = Atnt Population vector at time (t + 1) Random transition matrix at time (t) Population vector at time (t)
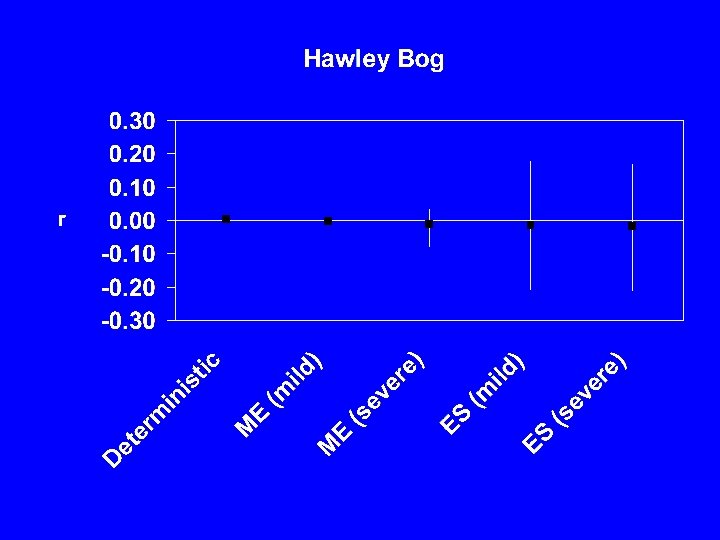
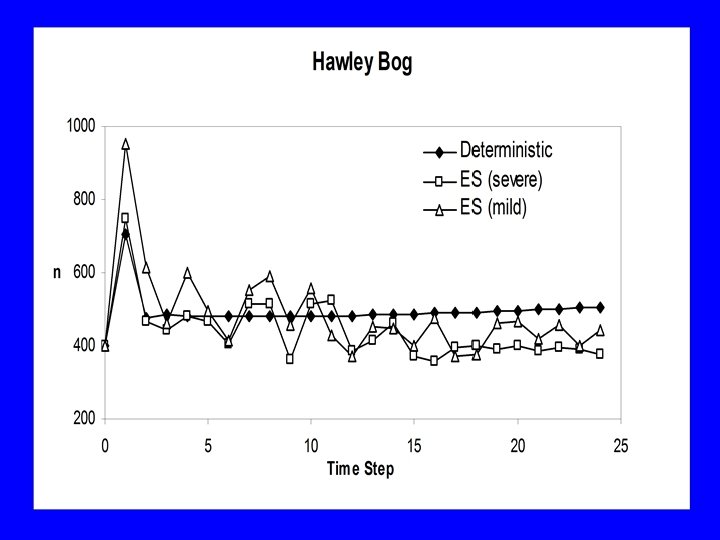
 • Environmental") Stochastic Model: Results • Cannot reject H 0 (r = 0. 0) • Environmental variation can lead to a substantial risk of long-term extinction (0. 3 < p(ext) < 0. 6)
Stochastic Model: Results • Cannot reject H 0 (r = 0. 0) • Environmental variation can lead to a substantial risk of long-term extinction (0. 3 < p(ext) < 0. 6)
 How do N and P concentrations affect population growth of Sarracenia?
 Nutrient Addition Experiment • 10 juveniles, 10 adults/treatment • Nutrients added to leaves twice/month • Nutrient concentrations bracket observed field values • Nutrient treatments maintained 1998, 1999 • “Press” experiment
") Nutrient Treatments • • • Distilled H 20 Micronutrients Low N (0. 1 mg/L) High N (1. 0 mg/L) Low P (0. 025 mg/L) High P (0. 25 mg/L) • N: P(1) Low N + Low P • N: P(2) Low N + High P • N: P(3) High N + Low P Nutrient Source: Micronutrients: Hoaglands N: NH 4 Cl P: Na. H 2 PO 4
Nutrient Treatments • • • Distilled H 20 Micronutrients Low N (0. 1 mg/L) High N (1. 0 mg/L) Low P (0. 025 mg/L) High P (0. 25 mg/L) • N: P(1) Low N + Low P • N: P(2) Low N + High P • N: P(3) High N + Low P Nutrient Source: Micronutrients: Hoaglands N: NH 4 Cl P: Na. H 2 PO 4
 Effects of N additions • Increased production of phyllodia • Increased probability of flowering
 Effects of N additions • Increased production of phyllodia • Increased probability of flowering • Decreased juvenile survivorship
 L L M H H
 L L M H H
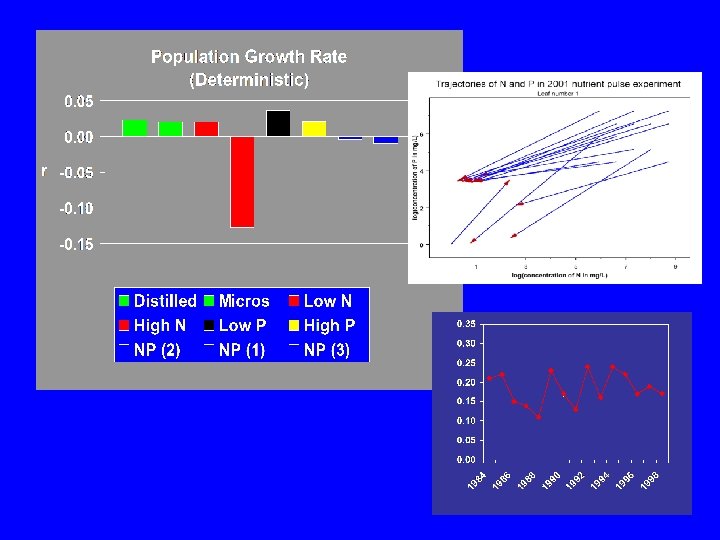
 Effects of Nitrogen on Demography: Results • Population growth rates respond to different N and P regimes • Population growth rate decreases in response to increasing N • Population growth rate decreases in responses to increasing N: P
 Transition") Modeling Long-term Environmental Change Time Series Modeling Observed N Deposition Long-term Forecast N(t) Transition Function Transition Matrix (t) Matrix Multiplication Population Time Series Extinction Risk Time to Extinction Population Structure (t)
Modeling Long-term Environmental Change Time Series Modeling Observed N Deposition Long-term Forecast N(t) Transition Function Transition Matrix (t) Matrix Multiplication Population Time Series Extinction Risk Time to Extinction Population Structure (t)
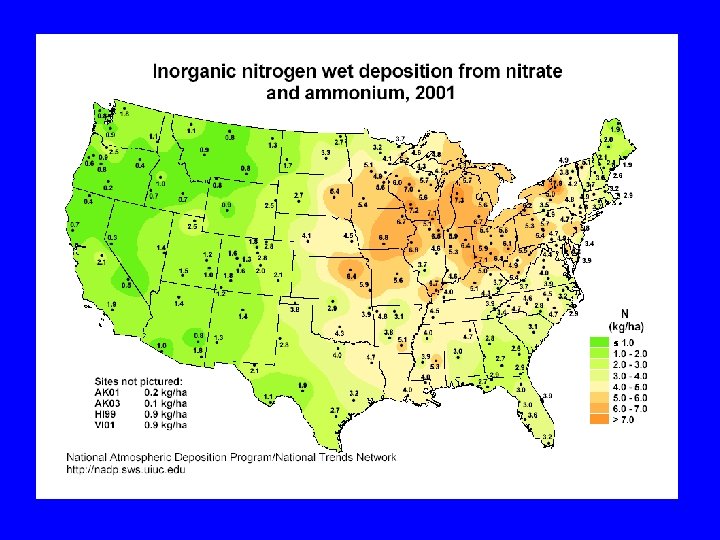
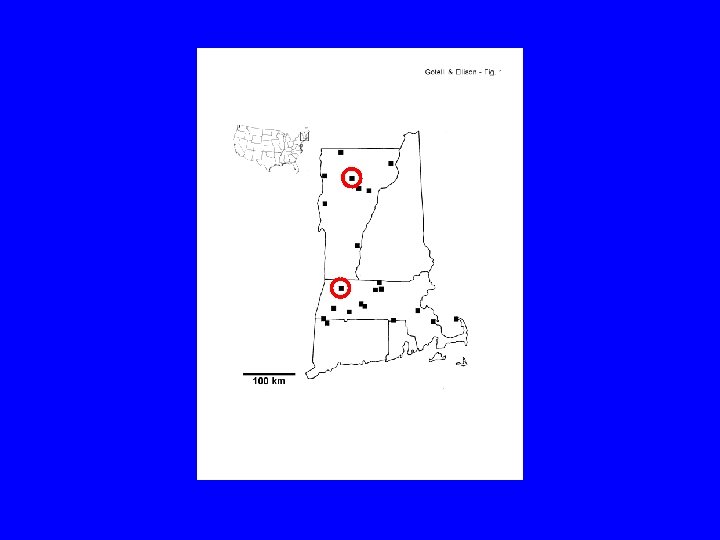
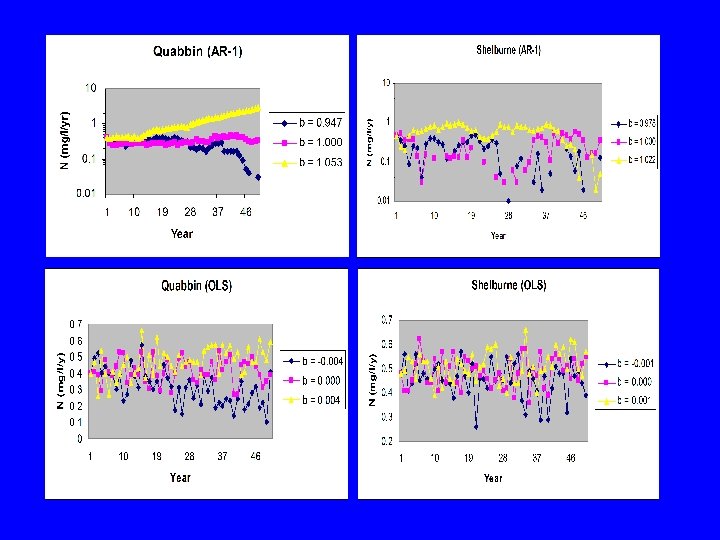
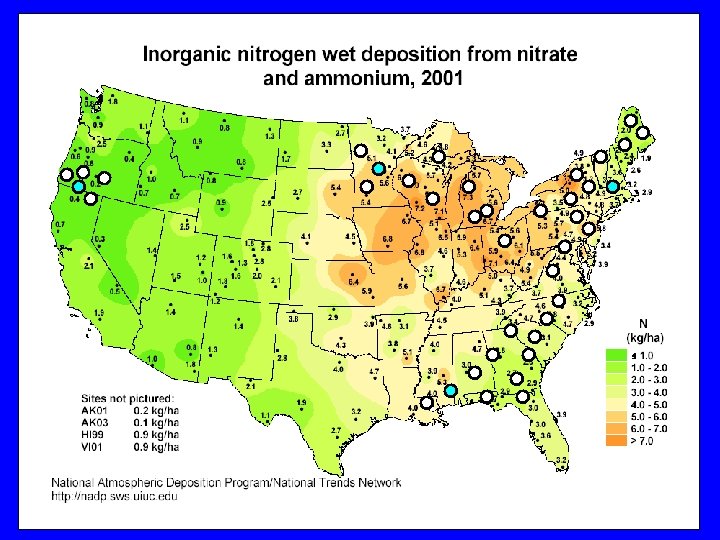
 N monitoring • National Atmospheric Deposition Program • NH 4, NO 3 measured as mg/l/yr • Annual data 1984 -1998 • Monitoring sites ØShelburne, VT ØQuabbin, MA
 Quabbin, MA NH 4 N 03 Shelburne, VT
 Quabbin, MA NH 4 N 03 Shelburne, VT
 Nt = a + bt + e First-order") Regression Models Ordinary Least Squares (OLS) Nt = a + bt + e First-order autoregressive (AR-1) Nt = a +b. Nt-1 + e
Regression Models Ordinary Least Squares (OLS) Nt = a + bt + e First-order autoregressive (AR-1) Nt = a +b. Nt-1 + e
 Transition") Modeling Long-term Environmental Change Time Series Modeling Observed N Deposition Long-term Forecast N(t) Transition Function Transition Matrix (t) Matrix Multiplication Population Time Series Extinction Risk Time to Extinction Population Structure (t)
Modeling Long-term Environmental Change Time Series Modeling Observed N Deposition Long-term Forecast N(t) Transition Function Transition Matrix (t) Matrix Multiplication Population Time Series Extinction Risk Time to Extinction Population Structure (t)
 •") Establishing Transition Functions • Linear interpolation between observed data points (n = 3) • Asymptotic transitions at extreme levels of nitrogen: Øpij = observed pij if [N] < 0. 01 mg/l/yr Øpij = 0. 0 if [N] > 10. 0 mg/l/yr • Logarithmic response curve
Establishing Transition Functions • Linear interpolation between observed data points (n = 3) • Asymptotic transitions at extreme levels of nitrogen: Øpij = observed pij if [N] < 0. 01 mg/l/yr Øpij = 0. 0 if [N] > 10. 0 mg/l/yr • Logarithmic response curve
 Modeling Demographic Transitions as a Function of Nitrogen
 Transition") Modeling Long-term Environmental Change Time Series Modeling Observed N Deposition Long-term Forecast N(t) Transition Function Transition Matrix (t) Matrix Multiplication Population Time Series Extinction Risk Time to Extinction Population Structure (t)
Modeling Long-term Environmental Change Time Series Modeling Observed N Deposition Long-term Forecast N(t) Transition Function Transition Matrix (t) Matrix Multiplication Population Time Series Extinction Risk Time to Extinction Population Structure (t)
 nt+1 = Atnt Population vector at time (t +") Matrix Transition Model (changing environment) nt+1 = Atnt Population vector at time (t + 1) Sequentially changing transition matrix at time (t) Population vector at time (t)
Matrix Transition Model (changing environment) nt+1 = Atnt Population vector at time (t + 1) Sequentially changing transition matrix at time (t) Population vector at time (t)
 Estimated population size at Hawley bog Stage Recruits Number of individuals 1500 Juveniles 23, 500 Non-flowering Adults 1400 Flowering Adults 500
 Scenario P (ext) at 100 y 0. 00 Time") Quabbin Exponential Forecast Models (AR-1) Scenario P (ext) at 100 y 0. 00 Time to ext (p = 0. 95) > 10, 000 y No change 0. 0% 0. 038 650 y Small 1% increase Worst case 4. 7% 0. 378 290 y 0. 996 70 y Best case Annual % Change -4. 7%
Quabbin Exponential Forecast Models (AR-1) Scenario P (ext) at 100 y 0. 00 Time to ext (p = 0. 95) > 10, 000 y No change 0. 0% 0. 038 650 y Small 1% increase Worst case 4. 7% 0. 378 290 y 0. 996 70 y Best case Annual % Change -4. 7%
 Scenario P (ext) at 100 y 0. 158 Time") Shelburne Exponential Forecast Models (AR-1) Scenario P (ext) at 100 y 0. 158 Time to ext (p = 0. 95) > 10, 000 y No change 0. 0% 0. 510 230 y Small 1. 0% increase Worst case 2. 2% 0. 694 200 y 0. 838 140 y Best case Annual % Change -2. 2%
Shelburne Exponential Forecast Models (AR-1) Scenario P (ext) at 100 y 0. 158 Time to ext (p = 0. 95) > 10, 000 y No change 0. 0% 0. 510 230 y Small 1. 0% increase Worst case 2. 2% 0. 694 200 y 0. 838 140 y Best case Annual % Change -2. 2%
 Shelburne Nitrogen Forecast Model
 Forecasting Models for Nitrogen Deposition: Results • Increasing or stationary models of Nitrogen deposition drive Sarracenia populations to extinction • Extinction risk declines with reduced nitrogen • Correlated nitrogen series can induce cycles and complex population dynamics
 Effects of N Deposition on Carnivorous Plants • • • Life History Effects on Individuals Effects on Populations Effects on Communities The Role of Ecologists
 Sarracenia Nutrient Feedback Loop Arthropod Prey Atmospheric Deposition Inquiline Community Pitcher Nutrient Pool [N, P] Plant Growth
 Sarracenia Nutrient Feedback Loop Arthropod Prey Atmospheric Deposition Inquiline Community Pitcher Nutrient Pool [N, P] Plant Growth
 Sarracenia Nutrient Feedback Loop Arthropod Prey Atmospheric Deposition Inquiline Community Pitcher Nutrient Pool [N, P] Plant Growth
 Sarracenia Nutrient Feedback Loop Arthropod Prey Atmospheric Deposition Inquiline Community Pitcher Nutrient Pool [N, P] Plant Growth
![Nutrients → Inquilines • Manipulate [N], [P] in leaves • Orthogonal “regression” design •](https://present5.com/presentation/811b556f0f7ba630ea847b3d233d75c3/image-89.jpg "Nutrients → Inquilines • Manipulate [N], [P] in leaves • Orthogonal “regression” design •") Nutrients → Inquilines • Manipulate [N], [P] in leaves • Orthogonal “regression” design • Maintain [] in a “press” experiment
Nutrients → Inquilines • Manipulate [N], [P] in leaves • Orthogonal “regression” design • Maintain [] in a “press” experiment
 Response Surface Experimenal Design
![Effects of [N, P] on Inquiline Abundance](https://present5.com/presentation/811b556f0f7ba630ea847b3d233d75c3/image-91.jpg "Effects of [N, P] on Inquiline Abundance") Effects of [N, P] on Inquiline Abundance
Effects of [N, P] on Inquiline Abundance
 Sarracenia Nutrient Feedback Loop Arthropod Prey Atmospheric Deposition Inquiline Community Pitcher Nutrient Pool [N, P] Plant Growth
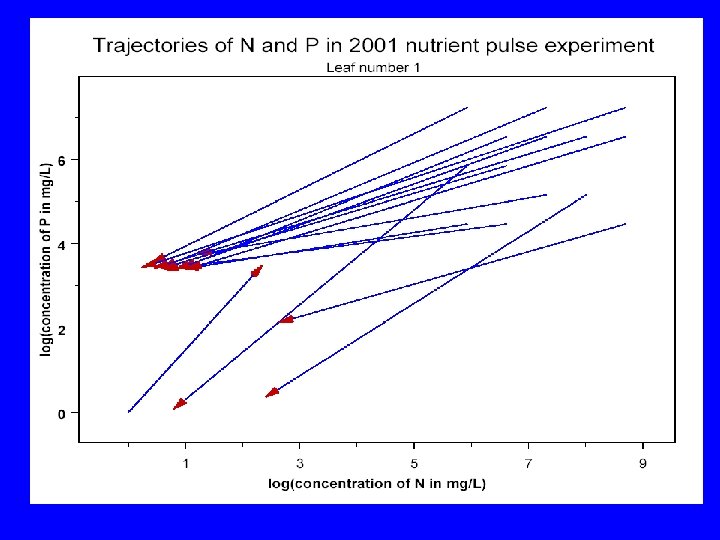
![Inquilines → Nutrients • Manipulate [N], [P] in leaves • Orthogonal “regression” design •](https://present5.com/presentation/811b556f0f7ba630ea847b3d233d75c3/image-93.jpg "Inquilines → Nutrients • Manipulate [N], [P] in leaves • Orthogonal “regression” design •") Inquilines → Nutrients • Manipulate [N], [P] in leaves • Orthogonal “regression” design • Establish initial [] in a “pulse” experiment
Inquilines → Nutrients • Manipulate [N], [P] in leaves • Orthogonal “regression” design • Establish initial [] in a “pulse” experiment
 Response Surface Experimenal Design
 Null Hypothesis
 Community Regulation of Nutrients
 Sarracenia Nutrient Feedback Loop Arthropod Prey Atmospheric Deposition Inquiline Community Pitcher Nutrient Pool [N, P] Plant Growth
 Nutrients ↔ Inquilines
 Effects of N Deposition on Carnivorous Plants • • • Life History Effects on Individuals Effects on Populations Effects on Communities The Role of Ecologists
 Ecology ≠ Environmental Science
 Reasons for Studying Ecology
 Reasons for Studying Ecology • Natural History
 Reasons for Studying Ecology • Natural History • Field Studies & Experiments
 Reasons for Studying Ecology • Natural History • Field Studies & Experiments • Statistics & Data Analysis
 Reasons for Studying Ecology • • Natural History Field Studies & Experiments Statistics & Data Analysis Modeling
![Arthropod Prey Atmospheric Deposition Inquiline Community Pitcher Nutrient Pool [N, P] Plant Growth](https://present5.com/presentation/811b556f0f7ba630ea847b3d233d75c3/image-113.jpg "Arthropod Prey Atmospheric Deposition Inquiline Community Pitcher Nutrient Pool [N, P] Plant Growth") Arthropod Prey Atmospheric Deposition Inquiline Community Pitcher Nutrient Pool [N, P] Plant Growth
Arthropod Prey Atmospheric Deposition Inquiline Community Pitcher Nutrient Pool [N, P] Plant Growth
 Reasons for Studying Ecology • • • Natural History Field Studies & Experiments Statistics & Data Analysis Modeling Collaboration
 Aaron M. Ellison Harvard Forest
 Conclusions • Anthropogenic deposition of N is a major ecological challenge
 Conclusions • Anthropogenic deposition of N is a major ecological challenge • Carnivorous plants in ombrotrophic bogs are a model system
 Conclusions • Anthropogenic deposition of N is a major ecological challenge • Carnivorous plants in ombrotrophic bogs are a model system • Individual response Ø plants alter morphology and growth in response to N: P ratios
 Conclusions • Anthropogenic deposition of N is a major ecological challenge • Carnivorous plants in ombrotrophic bogs are a model system • Individual response Ø plants alter morphology and growth in response to N: P ratios • Population response Ø N and P environments affect population growth rate
 Conclusions • Anthropogenic deposition of N is a major ecological challenge • Carnivorous plants in ombrotrophic bogs are a model system • Individual response Ø plants alter morphology and growth in response to N: P ratios • Population response Ø N and P environments affect population growth rate • Community response Ø Further study of nutrient ↔ inquiline feedback loop