07768e3b404e5240594280c4d900ecaf.ppt
- Количество слайдов: 94


New Metrics for New Media Web 2. 0 Expo New York City October 10 2011

What we’re going to do today • Overview of the session • Strategy & measurement • New media imperative • Review scorecard templates/metrics for 6 different scenarios >break in the middle< • Brand example • Scorecard & metrics • Tool demo • Organizing for Social Media • Q&A

Logistics • Hashtags: #socialmeasure #w 2 e • People: @setlinger, @blake, @margaretfrancis • Survey: http: //surveymonkey • References: Slide. Share, Google. Docs, Contact Info • Link to Altimeter Report: • http: //j. mp/altimetersocialframework 2011

Who We Are • Margaret Francis / @margaretfrancis • Current Chief Product Officer at stealth mode startup • Former VP Product Scout Labs/ Lithium Technologies, former agency strategist at Razorfish • Susan Etlinger / @setlinger • Industry Analyst with Altimeter Group • Former SVP at PR firm Horn Group, 20 years agency/ inhouse marketing and communications • Blake Robinson / @blake • Data and analytics consultant • Former Director, Technology & Research at Attention and Analyst in Residence at Webtrends • Writings in Tech. Crunch, Read/Write Web and Mashable

Brands We Know
 Dirty Little Secret “There is no single ROI for social media.")
The (Not So) Dirty Little Secret “There is no single ROI for social media. ” - Richard Binhammer, Strategic Corporate Communications, Social Media. and Corporate Reputation Management, Dell Inc. ,

Tying Social Media to the Business

Few Know How to Measure

A Measurement Framework

The Use Cases for New Media

Media & Measurement, 1990 TV Print OOH Sale! Radio WOM Mail Telephone Survey Focus groups Warranty Card Credit/ Payment Info

We get digital

Measurement, 2000 Online Ads Clicks Page Views Sessions Register Optin Search TV Print Sale! OOH Radio WOM Mail Telephone Survey Focus groups Warranty Card Credit/ Payment Info

We get social

Measurement, 2011 Blog Digg Post Review Like Fan Online Ads Clicks Review Product Re. Tweet Page Views Share Make video Post Book mark Tweet Rate Sessions Register Optin Search Sale! TV Warranty Card Print OOH Radio WOM Social Media Telephone Survey Focus groups Credit/ Payment Info

The more digital our communications get, the more transactions we perform online, the higher our expectations of what we can measure

So what can we measure?

SOME “SOCIAL” METRICS • # Video Views • % You. Tube Favorites • % You. Tube channel subscribers • % You. Tube Video Plays • # of You. Tube Channel Comments • # of You. Tube video reviews • # slideshare views • # delicious bookmarks • # diggs • # of Blog Mentions • # of Forum mentions • # of Facebook mentions • # of Twitter mentions • # @mentions • # of reviews mentions • # of comments • Positive : Negative Mentions for any channel • # Twitter followers • Twitter Follower-Rate • # reviews • # stars in reviews • Thread size • Unique contributors • Unique commenters • # Facebook fan pages • # Facebook fans • Facebook Fan Rate • Facebook Likes • Email Open Rate • Email Click Rate • Email Forward rate • Email opt-out rate • # of Email subscribers • # of SMS subscribers • Clicks/ CTR • Impressions • Traffic • Reach • Registration • Opt-in • Page views • Visit/session length (% site visits > 60 secs) • Click path analysis • Eye tracking studies • #/% Downloads • Changes in SERP results/ rankings • Earned/ Owned traffic • Inbound links

Three Kinds of Marketing Metrics ACTIVITIES Videos posted Tweets responded to Online media served CONSUMER RESPONSE Changes in perception (NPS, Intent to purchase, customer satisfaction) Consumer engagements (Like, Click, Download) Submission of information (email, lead form, shopping preferences) BUSINESS OUTCOMES Revenue Cost Savings Better ROI Higher market share

On being in love with perfect data "All models are wrong; some models are useful” George Box, Statistician
 • Marketing Optimization")
New Media Use Cases • Brand Health (including PR/ Reputation Management) • Marketing Optimization • Revenue Generation • Customer Experience • Operational Efficiency • Innovation

Brand Health A measure of attitudes, conversation and behavior toward your brand

Conversatio n Drivers Influencers Brand Healt h Competitive Implications Sentimen t Drivers Location, Time, Impact

Brand Health Metric: Share of conversation on a specific topic Used with permission of Netbase

A look at Influence Source: Social. Flow

Brand Health Scorecard METRIC PURPOSE OLD MEDIA METRIC/ DATA SOURCE NEW MEDIA METRICS NEW MEDIA DATA SOURCE BRAND PREFERENCE Do consumer prefer our brand Share of Voice to competitive brands? Share of Conversation SMM tools BRAND PERCEPTION Do consumers associate the desired brand attributes with the brand? Do we have more mindshare than our competitors with our target market? Market Research Theme/Cluster Analysis SMM tools, Wordle Market Research Buzz vs competitors SMM tools AUDIENCE ANALYTICS Are the segments engaging with the brand the ones we are targeting? Customer database Facebook Insights Facebook, Customer DB, Twitter BUZZ (PR/ Reputation Management) SENTIMENT (PR/ Reputation Mgmnt) Are we igniting relevant conversations with our outreach activities? Are they having the right impact? PR Services Buzz timeline, annotated SMM tools, annotation Market Research Sentiment Analysis of SM SMM tools, custom analysis INFLUENCE (PR/ Reputation Mgmnt) Are the right people talking about the brand? PR Services SM Influencer Scorecarding Twitter, Klout, Kred NPS, Intent to Purchase, Customer, Sat, Likelihood to Recommend Same Survey BRAND BUZZ CUSTOMER IMPACT Have our communications SURVEYS changed consumer opinion?
")
Net Promoter Score (NPS)

Likelihood to Recommend

Intent to Purchase

Share of Voice/ Share of Conversation

Themes/ Clusters
")
Themes/Clusters (CI)

Buzz Timeline with Annotations

Audience Analytics

Market Share

Audience Analytics

Themes/ Clusters

Crimson Hexagon for Social Analytics i. Phone on Verizon: Key Themes Crimson Hexagon’s proprietary algorithm separates relevant from irrelevant content and measures user-defined themes in online conversation. 38

Tracx Social Analytics • Tracx offers white labeled social media monitoring platform. • Shows contextually weighted hits across many social mediums. • Can be tweaked to remove internal (employee) influencers in order to show more accurate campaign results. 39

Gauging Influencers • Near the end of September Klout scores dropped by approximately 4 points across the board – with no explanation. • Tools that gauge influencers should not be trusted until these algorithms stabilize. 40

But if you must… • Peer Index is a decent alternative whose numbers don’t wildly fluctuate. 41

Marketing Optimization Improving the effectiveness of marketing programs

Campaign Performanc e Influencer Impact Marketing Optimizatio n Timin g Impac t Content Performanc e Channel Performanc e

Metric: Conversion Efficiency: Which visits convert most often? Marketing Optimization Facebook Marketing Programs Natural Search Referring Sites Direct Load 0 0. 5 1 1. 5 % of Visitors 2 2. 5 3

Marketing Optimization Scorecard METRIC PURPOSE OLD MEDIA METRIC/ DATA SOURCE NEW MEDIA METRICS NEW MEDIA DATA SOURCE LEADS, CONVERSIONS, REVENUE BY CHANNEL OWNED MEDi. A CHANNEL GROWTH Which channels are most effective for driving business results? Are we growing our house Customer list (email, marketing list/ assets? direct mail) Followers, Fans, Friends, Group Members IMPRESSIONS How many impressions of our messages are being served? Syndicated Research, Ad Servers AVE (we hate this metric), Followers, Fans, Members SMM tools, Wordle FREQUENCY How many times are people seeing our media? Syndicated Research, Ad Servers n/a SMM tools REACH Are the people seeing our media the ones we’re trying to reach? Customer database Followers, Fans, Members Facebook, Customer Database, Twitter ENGAGEMENTS Do consumers interact N/A with the content we create for new media channels? Clicks, Apps, Likes, Downloads, Fans, Faves, Retweets, Comments, Views, Followers Social Media platforms, SMM tools, custom analysis Analysis of sales by channel with attribution Same CRM System (assuming sales have a source)

Owned Media Channels Growth

Owned Media Channels Vs Competitors

Engagement- Football

Engagement Over Time

Engagement- Beer

Engagement- Likes

Engagement- Posts, Comments, Likes

Shareaholic - http: //www. shareaholic. com/siteinfo/usatoday. com • View the sharing stats of any sites shared through the Shareaholic browser extension • Pages are accessible at http: //www. shareaholic. com/siteinfo/sitename. com

Facebook Insights • Facebook Insights provides a top down perspective on who comprises your audience and what they do on your Facebook Page. 54

Facebook Insights for Websites • You can include a tag on your site which will allow you to measure the impact that Facebook Likes/ Share have on you site traffic. • Excellent supplement to Google Analytics (even with the recent introduction of real time analytics). 55

Simple Server Side Analytics Via Tagging • Chartbeat provides an excellent way to visualize the correlations between content publishing and real time site traffic. • Simple for marketers to use: put a (really light) tag on your site and Chartbeat’s server side analytics will analyze the data for you.

Simple Server Side Analytics Via Tagging In addition to its standard Chartbeat product, two specialized analytics platforms are now offered. • Newsbeat is focused aimed at content creators, bloggers, etc. • Shopbeat is designed specifically for ecommerce sites. •

Revenue Generation Where and how your company or organization generates revenue

Conversion Impact Revenue Generatio n Search Impact Loyalty Impact

Revenue Generation Metric: Increase in member spending Source: http: //www. lithium. com/pdfs/casestudies/Lithium-FICO-Case-Study. pdf Disclosure: Lithium is a client of Altimeter.

Revenue Generation Scorecard METRIC LEADS, CONVERSIONS, REVENUE BY CHANNEL SEARCH PURPOSE OLD MEDIA METRIC/ DATA SOURCE NEW MEDIA METRICS NEW MEDIA DATA SOURCE Which channels are most Analysis of sales effective for driving sales? by channel with attribution Same CRM System (assuming sales have a source) What kinds of content are Page Rank most cost effective in raising organic search rankings? How much does the AOV average customer spend? Same Search Engines; Hub. Spot Same CRM/ Internal Systems TRANSACTION FREQUENCY How often does the average customer buy? Recency/ Frequency Same CRM/ Internal Systems SALES INFLUENCED Were the customers who bought influenced by our media? Source of Sales/ How did you hear of us? Same CRM/ Internal Systems/ Survey REVENUE BY RATINGS/REVIEWS Does consumer generated N/A content help prospect make purchase decisions? Revenue by Ratings/ Reviews Web Analytics Platform; Rating Platform TRANSACTION SIZE

Keys to Revenue Attribution • Source attribution in the CRM system • Source interaction in the CRM system • Social media identity appended to the database

Bitly • Bit. ly provides analytics behind each link and breaks down the number of clicks and other truncated links to the same site, as well as referral and geographical data.

Bitly • Bit. ly, and other URL truncation services, also provide a layer of analytics that can extend your tracking capabilities to any destination that allows clickable links. • This allows you to track referrals through walled services like Facebook and Linked. In.

ROI: Page Views Vs. Sales

Content Performance

Customer Experience Improving your relationship with customers and their experience with your brand

“Blind Spots ” Servic e Levels Customer Experience Issue Identificatio n Context! Emotiona l Intensity
 Dell’s Social Media Listening Command Center")
Customer Experience Metric: Social Service Levels (in development) Dell’s Social Media Listening Command Center (Courtesy Dell, Inc. )

Customer Experience Scorecard METRIC ATTITUDES PURPOSE How people talk about your brand & product OLD MEDIA METRIC/ DATA SOURCE NEW MEDIA METRICS NEW MEDIA DATA SOURCE Market Research Customer quotes/ insights SMM tools ISSUES AND CRISES Service & product issues, emerging crises Market Research Theme/Cluster Analysis SMM tools, Wordle INTENSITY Momentum of a topic or issue Market Research Buzz SMM tools BLIND SPOTS “What are we missing” in relation to NPS or customer satisfaction scores Performance of social CRM Market Research Customer Quotes/ Insights SMM tools # of service issues SMM tools, annotation Are they having the right impact? Market Research Most common keywords SMM tools, custom analysis SERVICE LEVELS CONTEXT

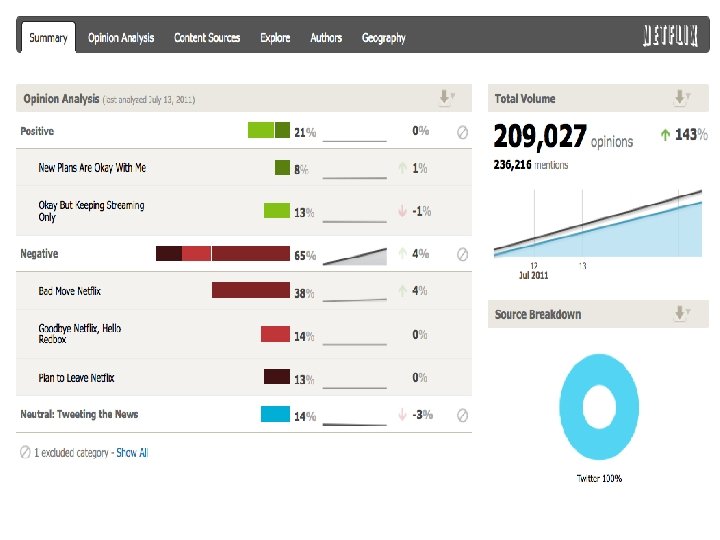
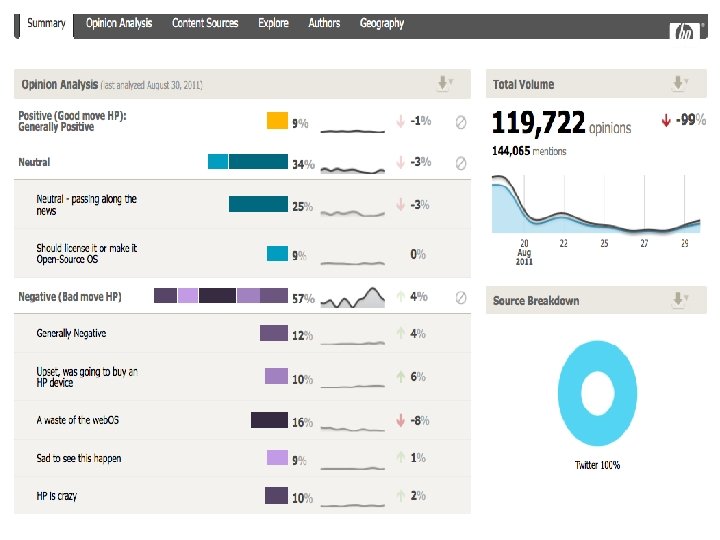
Buzz on Net. Flix/Qwikster

Buzz on Net. Flix/Qwikster

Sentiment for Netflix

Qualitative Consumer Opinion on Net. Flix

TOPSY • Forget search. twitter. com • Topsy is better on all counts. • Functional breakouts by time, content, influence, etc.

TOPSY Labs • Topsy provides analytics behind your searches. • Topsy is better than Twitter’s own search on all counts. • It’s free!

Operational Efficiency Where and how your company or organization reduces expenses

Call Containment Operational Efficiency Channel Efficienc y Advocate Identification

Operational Efficiency Metric: Percentage of inquiries resolved in social channels

Operational Efficiency Scorecard METRIC PURPOSE OLD MEDIA METRIC/ DATA SOURCE NEW MEDIA METRICS NEW MEDIA DATA SOURCE CUSTOMER SERVICE ISSUE RESOLUTION Keeping track of the number, severity, and cost of service issues Number and cost of issues resolution by channel Same New engagement platforms, SMM tools CUSTOMER SERVICE ISSUE REDUCTION Becoming more effective at heading off customer service issues Call deflection, issue resolution Same New engagement platforms, SMM tools, internal analysis ADVOCATE Crowdsourcing of content NETWORK GROWTH creation and peer support network WOM # & % of issues resolved by crowdsourced resources Community platform, web analytics, internal analysis CUSTOMER SATISFACTION BY RESOLUTION CHANNEL Customer Satisfaction Same Survey data, SMM tools Customer satisfaction with corporate response to service issue

Customer Response Dashboard

Response Rate

Response Time

Innovation Collaborating with customers to drive future products and services

Opportunities Idea Impact Innovatio n Idea Resonance Threat s

Innovation Metric: Ideas generated, productized per year

Brand Health Scorecard METRIC PURPOSE OLD MEDIA DATA SOURCE NEW MEDIA METRICS NEW MEDIA DATA SOURCE # of Ideas Generated Getting new ideas from customers Market Research Count of Ideas, Crowdsourced Votes/ Likes on Ideas as Quality Metric Idea platform/ Internal Analysis # Ideas Productized Turning customer ideas into product enhancements % Product Enhancement from Customer Ideas Same Internal Analysis Speed to Market Same Internal Analysis Speed of idea generation/ productization

Sales. Force Idea Exchange

Ideas Implemented

Organizing for Social 1. Identify your organizational model for social media. 2. Based on that model, outline the roles and responsibilities of your measurement team, including: • Resources • Ownership • Processes • Training and education • Collaboration

Organizing for Social 1. If you choose to outsource some or all social media monitoring: • Balance domain expertise, analytical skill, and tool mastery • Consider information sensitivity • Plan for knowledge transfer • Implement checks and balances • Compare expenses

thank you #socialmeasure #w 2 e @margaretfrancis @setlinger @blake (and http: //blakepl. us on G+)
07768e3b404e5240594280c4d900ecaf.ppt