e7f8f7f03b6ae5eda09eda545dbd1fc4.ppt
- Количество слайдов: 62


New Indices of Endothelial Function Measured by Digital Thermal Monitoring of Vascular Reactivity Presenter: Morteza Naghavi, M. D. Chairman of Scientific Advisory Board www. endothelix. com

Endothelial Function is disturbed in various diseases. This slide shows the extent of involvement of endothelial dysfunction in various diseases, much like a high blood pressure measurement or fever that is indicative of different problems. There is a good argument for adopting endothelial function monitoring as part of routine vital sign monitoring along with blood pressure.
 The vascular endothelium serves multiple functions: 1) 2)")
Endothelial cells serve multiple functions. (S) The vascular endothelium serves multiple functions: 1) 2) 3) 4) it regulates fluid and molecule traffic between blood and tissues it is an anti-coagulant surface it contributes to vascular homeostasis and repair it plays a vital role in vascular tone and blood flow regulation *** Assessing this function is the most practical way of measuring endothelial function.

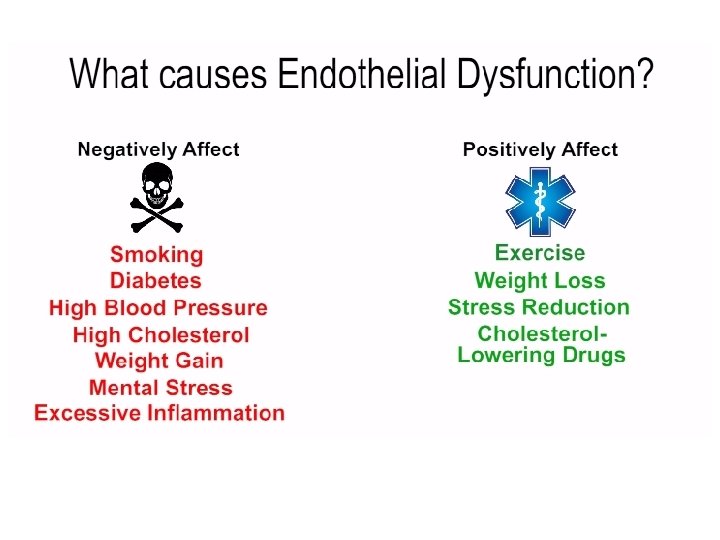
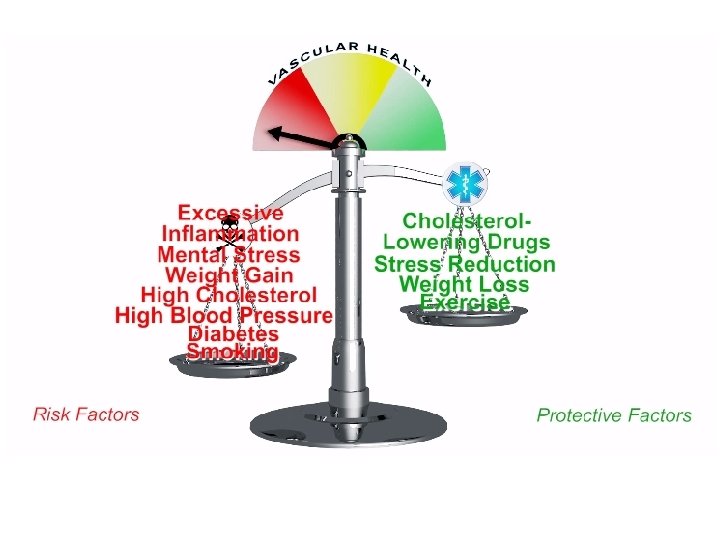
Endothelial and Vascular Dysfunction: A “Barometer of Cardiovascular Risk” • Marker of the inherent atherosclerotic risk • An integrated index of both the overall CV risk factor burden and the sum of all vasculoprotective factors in an individual. Aging Smoking Diabetes ↑ Blood Pressure Genetics Diet Inactivity ↑ Cholesterol Oxidative Stress Medications

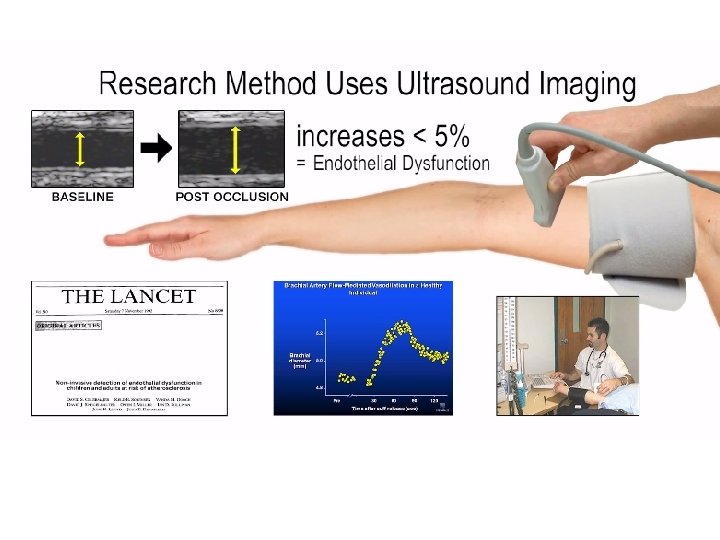
Brachial Artery Ultrasound with FMD BASELINE POST OCCLUSION

Reactive Hyperemia Reactive hyperemia is the transient increase in organ blood flow that occurs following a brief period of ischemia (e. g. , arterial occlusion). The left panel shows the effects of a 2 min arterial occlusion on blood flow. In this example, blood flow goes to zero during arterial occlusion. When the occlusion is released, blood flow rapidly increases (i. e. , hyperemia occurs) that lasts for several minutes. The hyperemia occurs because during the period of occlusion, tissue hypoxia and a build up of vasodilator metabolites (e. g. , adenosine) dilate arterioles and decrease vascular resistance. Then when perfusion pressure is restored (i. e. , occlusion released), flow becomes elevated because of the reduced vascular resistance. During the hyperemia, the tissue becomes reoxygenated and vasodilator metabolites are washed out of the tissue. This causes the resistance vessels to regain their normal vascular tone, thereby returning flow to control. http: //www. cvphysiology. com/Blood%20 Flow/BF 006. htm

Endothelial Function Basic Science to Clinical Practice Clinical practice Discovery of NO and the role of the endothelium Endothelial function with exercise and mental stress First endothelial function in humans 1980 Noninvasive endothelial function 1989 1986 Basic science Comparison peripheral and coronary endothelial function Endothelial function and myocardial ischemia Coronary endothelial function in clinical practice Association between endothelial function and CV events 19951997 1995 1992 FDA approved device to assess endothelial function 1996 Comparison between the PAT and coronary endothelial function 2005 20002004 2006 2005 Clinical practice

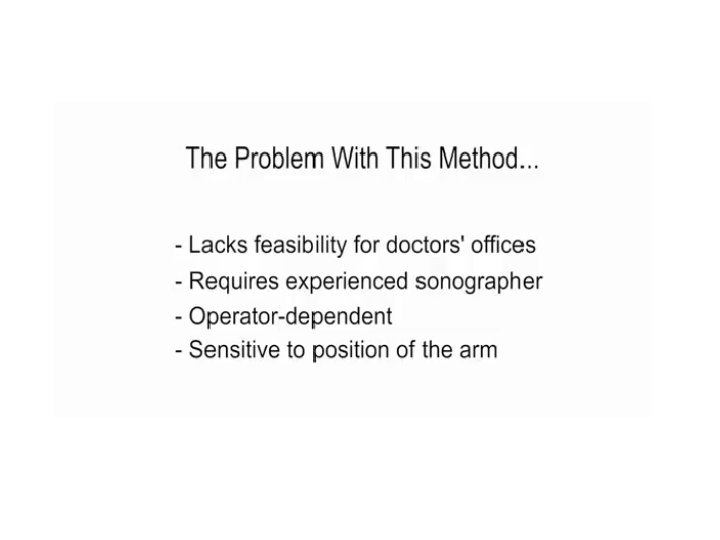
Moving Endothelial Function Testing out of the Research Lab and into Doctors Offices Brachial Artery Ultrasound FMD • Ultrasound measurement of brachial artery dilation • 15 -minute test • Not automated • Requires skilled operator VENDYS® - Endothelix, Inc. • Fingertip temperature changes • 15 -minute test • Fully automated • Operator independent

What is VENDYS technology? ®

How does VENDYS measure vascular function? ®

VENDYS® Vascular Function Monitoring Blood Pressure “Occluding” Cuff on Right Upper Arm Fingertip Temperature Sensors on Both Index Fingers

VENDYS® Vascular Function Monitoring

Addressing Problem 1: Inaccurate Individualized Assessment of Cardiovascular Risk

Lower Fingertip Temperature Rebound is Associated with Higher Burden of Cardiovascular Risk Factors Measured by Framingham Risk Score

Lower Fingertip Temperature Rebound is Associated with Higher Coronary Plaque Burden

The Combination of Low Fingertip Temperature Rebound and High Framingham Risk Score is Associated with High Risk Coronary Artery Calcium Score
 over Traditional Risk")
VENDYS Improves Risk Stratification of High Risk Patients (CAC ≥ 100) over Traditional Risk Factor Assessment Variable AUC ± S. D. 95% CI P (compared to FRS) VENDYS + FRS 0. 89 (0. 02) 0. 79 (0. 03) 0. 66 (0. 04) 0. 84 - 0. 93 0. 72 - 0. 84 0. 57 - 0. 77 0. 001 --- VENDYS FRS

Lower Fingertip Temperature Rebound is Associated with the Presence of Cardiometabolic Disorders

Fingertip Temperature Rebound Decreases as the Number of Cardiometabolic Risk Factors Increases
 DM – Diabetes")
VENDYS Improves Identification of High Risk Diabetic Patients (CAC ≥ 100) DM – Diabetes Mellitus AUC ± S. D. 95% CI P VENDYS + DM Variable 0. 91 (0. 02) 0. 87 - 0. 95 0. 0001 VENDYS 0. 79 (0. 03) 0. 72 - 0. 84 0. 0001 DM 0. 70 (0. 03) 0. 63 - 0. 78 0. 0001

Lower Fingertip Temperature Rebound is Associated with Increased Insulin Resistance, Coronary Calcification, and Framingham Risk Score

In Patients with Chest pain, Lower Fingertip Temperature Rebound is Associated with Myocardial Perfusion Defects

A Combination of VENDYS and Framingham Risk Score May Aid Detection of Vaguely Symptomatic Patients (SSS ≥ 4) with Myocardial Perfusion Defects Variable VENDYS + FRS VENDYS¥ FRS€ AUC ± S. D. 95% CI P 0. 84 (0. 03) 0. 75 (0. 04) 0. 65 (0. 05) 0. 77 - 0. 91 0. 65 - 0. 84 0. 56 - 0. 77 0. 0001 0. 004 SSS – Summed Stress Score Comparison with FRS 0. 001 0. 04 ---

In Patients with Chest Pain, Lower Fingertip Temperature Rebound is Associated with Coronary Artery Disease

A Combination of Low Fingertip Temperature Rebound and High Framingham Risk Score is Associated with Obstructive Coronary Artery Disease

A Combination of VENDYS and Framingham Risk Score May Aid Clinical Risk Assessment of Vaguely Symptomatic Patients Suspected of having Obstructive Coronary Artery Disease Variable VENDYS + FRS + CACπ VENDYS + FRS VENDYS€ FRS¥ AUC ± S. D. 95% CI P Comparison P with FRS 0. 94 (0. 03) 0. 84 (0. 04) 0. 79 (0. 04) 0. 74 (0. 04) 0. 63 (0. 05) 0. 88 - 0. 97 0. 76 - 0. 90 0. 72 - 0. 85 0. 65 - 0. 82 0. 54 - 0. 72 0. 0001 0. 003 0. 009 0. 03 --- ∏ Coronary Artery Calcium Score: CAC: 0, 1 -99, 100 -399, ≥ 400 € Fingertip Temperature Rebound: Tertiles of VENDYS TR ¥ Framingham 10 Year CHD Risk Score (FRS): <10%, 10 -20%, >20%
 CR")
Digital Thermal Monitoring of Vascular Function is Reproducible Variable D SDD CV (%) CR (%) ICC P value Heart Rate 0. 47 0. 054 11. 4 10. 6 0. 7 0. 01 Mean Arterial Pressure 0. 44 0. 038 8. 7 7. 5 0. 79 0. 0005 Start Temperature 0. 51 0. 036 7. 1 0. 81 0. 0001 DTM (VENDYS®) Indices of Vascular Function TR (°C) 0. 209 0. 012 5. 7 2. 4 0. 82 0. 0001 AUC 0. 292 0. 014 4. 8 2. 8 0. 83 0. 0001 D: mean absolute difference; SDD: SD of mean differences; CV: coefficient of variability [(SDD /D)*100]; CR: coefficient of repeatability [(SDD *1. 96)*100)]; ICC: Intra-class Correlation Coefficient.

12 -month Treatment with Aged Garlic Extract was Associated with Lower Coronary Calcium Progression and Higher Fingertip Temperature Rebound

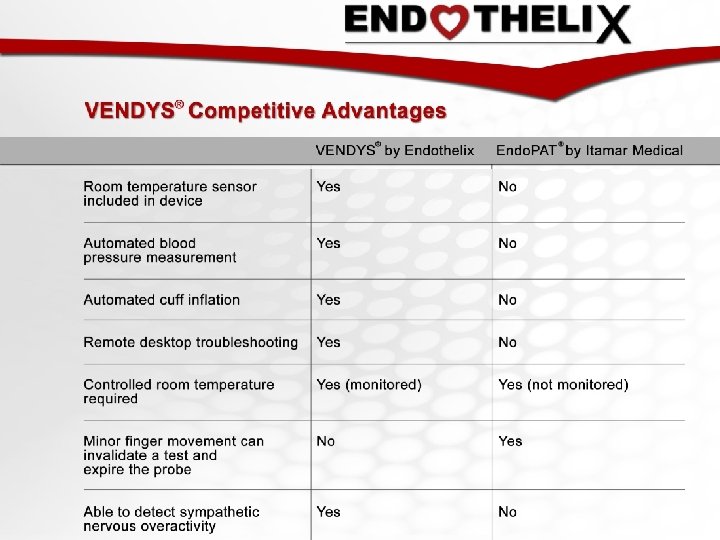
Comparison with Competitor VENDYS® - Endothelix, Inc. • Fingertip temperature changes • 15 -minute test • Fully automated Endo. PAT® - Itamar Medical Inc. • Fingertip pressure changes • 15 -minute test • Not automated

Infrared Imaging Cuff inflated Post cuff deflation

To schedule a free demo or learn more, send an email to info@endothelix. com.

VENDYS® Portable A complete system to perform automated, vascular function studies • Cuff management module (CMM) • Digital thermal monitoring (DTM) module • VENDYS® fingertip probes • Laptop computer with pre-installed software – Data acquisition – Report generation and data tabulation

Software Screenshots The VENDYS Report

Software Screenshots Report Viewer

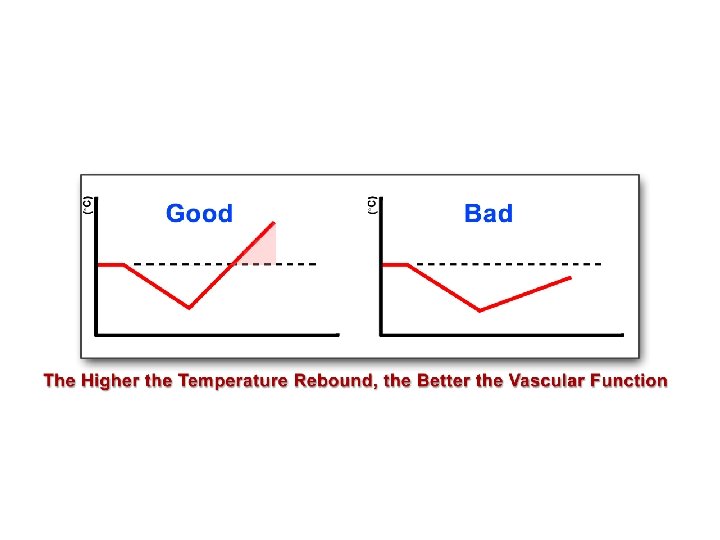
Temperature Curves The VENDYS® Report Red = right finger Blue = left finger Flags help to notify user of conditions that may affect the technical quality of the study. A summary of VENDYS indices is shown here. a. TR is the primary vascular reactivity index. Vascular Reactivity Gauge Green = Good Yellow = Intermediate Red = Poor Ambient room temperature is recorded throughout the study.

Sample Report Screen: “Intermediate” Vascular Reactivity

Sample Report Screen: “Poor” Vascular Reactivity
 CR")
Digital Thermal Monitoring of Vascular Function is Reproducible Variable D SDD CV (%) CR (%) ICC P value Heart Rate 0. 47 0. 054 11. 4 10. 6 0. 7 0. 01 Mean Arterial Pressure 0. 44 0. 038 8. 7 7. 5 0. 79 0. 0005 Start Temperature 0. 51 0. 036 7. 1 0. 81 0. 0001 DTM (VENDYS®) Indices of Vascular Function TR (°C) 0. 209 0. 012 5. 7 2. 4 0. 82 0. 0001 AUC 0. 292 0. 014 4. 8 2. 8 0. 83 0. 0001 D: mean absolute difference; SDD: SD of mean differences; CV: coefficient of variability [(SDD /D)*100]; CR: coefficient of repeatability [(SDD *1. 96)*100)]; ICC: Intra-class Correlation Coefficient.

12 -month Treatment with Aged Garlic Extract was Associated with Lower Coronary Calcium Progression and Higher Fingertip Temperature Rebound

Comparison with Competitor VENDYS® - Endothelix, Inc. • Fingertip temperature changes • 15 -minute test • Fully automated Endo. PAT® - Itamar Medical Inc. • Fingertip pressure changes • 15 -minute test • Not automated

 Illustration of patient")
1 Figure 1: Patient Setup and Sample VENDYS DTM Report (Above) Illustration of patient setup, with temperature sensors affixed to both index fingers and blood pressure cuffs on both arms. (Below left) A sample report screen displays a right finger temperature curve (red), a left finger temperature curve (blue), and a Zero Reactivity Curve (green). (Below right) The software-generated, vascular reactivity curve is shown. The vascular reactivity index (VRI) is taken as the maximum value of this temperature curve during the reactive hyperemic period.

Distribution of VRI 1000 100% 0 Vascular Reactivity Index Figure 2 A: Distribution of Vascular Reactivity Index (VRI) A histogram and cumulative percentage curve are shown. ≥ 3. 0 10% 2. 8 to < 3. 0 100 2. 6 to < 2. 8 20% 2. 4 to < 2. 6 200 2. 2 to < 2. 4 30% 2. 0 to < 2. 2 300 1. 8 to < 2. 0 40% 1. 6 to < 1. 8 400 1. 4 to < 1. 6 50% 1. 2 to < 1. 4 500 1. 0 to < 1. 2 60% 0. 8 to < 1. 0 600 0. 6 to < 0. 8 70% 0. 4 to < 0. 6 700 0. 2 to < 0. 4 80% < 0. 2 90% 800 Frequency (n) 900 0% Cumulative % 2 A

2 B Women Men ≥ 2 Figure 2 B: Distribution of Vascular Reactivity Index (VRI) by Gender The percent of DTM tests falling into categories of poor, intermediate, and good vascular reactivity is shown for men (solid fill) and women (hatch fill).
 and Age A scatter plot, trend")
3 Figure 2 C: Vascular Reactivity Index (VRI) and Age A scatter plot, trend line, and Pearson’s r coefficient are shown. VRI was mildly and inversely correlated with age.

4 A 20% 18% % of tests with VRI < 1 16% 14% 12% 10% 8% 6% 4% 2% 0% < 50 50 to < 70 Age (Yrs) > = 70 ≥ 70 Figure 2 D: Prevalence of Poor VRI in Different Age Groups The frequency of having a poor VRI score (VRI <1. 0) is shown for the three age categories of age < 50 y, age 50 -70 y, and age >=70 y.

4 Distribution of VRI scores for participants aged ≥ 70 B 80% 70% 60% % of tests 50% 40% 30% 20% 10% 0% 0 to < 1 Poor 1 to < 2 Intermediate Vascular Reactivity Index ≥ 2 Good Figure 2 E: Distribution of Vascular Reactivity Index (VRI) in Oldest Age Group
 Variable")
Table 1: Selected Patient and Test Characteristics Variable Mean ± SD or %(n) Variable Mean ± SD or % Age (y) 65. 5 ± 13. 7 Cold Finger 5. 8% (n=353) Male / Female 54% / 46% Sympathetic Response 4. 8% (n=294) Systolic blood pressure (mm. Hg) Diastolic blood pressure (mm. Hg) Heart rate (bpm) 138 ± 20 VRI score, overall 1. 53 ± 0. 53 77 ± 12 VRI score, women 1. 56 ± 0. 58 70 ± 13 VRI score, men 1. 50 ± 0. 49 Right finger t 300 (°C) 32. 1 ± 2. 7 Left finger t 300 (°C) 31. 9 ± 2. 8 Ambient temperature (°C) 24. 3 ± 1. 9 Table 1: Selected Patient and Test Characteristics Finger t 300 = finger temperature at the onset of cuff occlusion (time 300 s); VRI = vascular reactivity index; NVRI = neurovascular reactivity index; Cold Finger = a flagged condition in which right finger t 300 is equal to or less than 27°C; Sympathetic Response = a flagged condition in which left finger temperature continuously declines after right arm cuff occlusion
")
Table 2: Multiple Linear Regression – Models for VRI, SBP, and DBP VRI (Dependent) R Square = 0. 06, SE = 0. 52 Intercept Age DBP Male sex SBP (Dependent) R Square = 0. 02, SE = 20. 36 Intercept VRI Age HR Male sex DBP (Dependent) R Square = 0. 10, SE = 11. 78 Intercept VRI Age HR Male sex β 1. 885539 -0. 00826 0. 003341 -0. 09741 p-value < 0. 001 0. 002 < 0. 001 β 119. 3615425 2. 304075346 0. 186886935 0. 067271865 -0. 412960283 p-value < 0. 001 0. 018 0. 560 β 70. 26680855 1. 796063985 -0. 150770023 0. 1759533 3. 509046088 p-value < 0. 001 Results are shown for four separate multiple linear regression models: VRI (vascular reactivity index), SBP (systolic blood pressure) and DBP (diastolic blood pressure). β = β coefficient; R Square = R 2; SE = standard error. Units for variables were as follows: Age (y), HR (bpm), Sex (male = 1, female = 0), SBP and DBP (mm Hg).
")
Table 3: Comparison between CVD Risk Assessment Methods Method Type (Structural, Functional, Risk Factors) Independen t of Age Predictive Value Response to Therapy Ease of Use and Applicability in Primary Care Setting Intra- and Inter Observer Reproducibility Self-Monitoring by Patients at Home Coronary Artery Calcium Structural - +++ - + +++ - Carotid IMT and Plaque Structural - ++ + - Ankle Brachial Index Structural - +++ ++ - Arterial Stiffness (e. g. , PWV, AI, C 1/C 2) Risk Factor. Based Risk Calculators (e. g. , FRS, SCORE, QRISK 2) FMD Structural/ - ++ ++ - Risk Factors - ++ n/a +++ ++ ++ Functional + ++ ++ - - - PAT (RHI) Functional + ++ ++ ++ PPG (RI) Functional + ++ ++ ++ DTM (VRI) Functional + ++ ++ +++ Functional Table 3: Comparison between CVD Risk Assessment Methods Carotid IMT = carotid intima-media thickness; PWV = pulse wave velocity; AI = augmentation index; C 1/C 2 = indices of large and small artery compliance (elasticity); FRS = Framingham Risk Score; SCORE = Systematic Coronary Risk Evaluation risk score system published by The European Society of Cardiology; QRISK 2 = risk calculator developed by UK National Health Service; FMD = flow mediated dilatation; PAT = peripheral arterial tonometry; RHI = reactive hyperemia index; PPG = photoplethysmography for digital pulse waveform analysis; RI = reflection index; DTM = digital thermal monitoring; VRI = vascular reactivity

VENDYS Publications DTM Clinical Papers: • Association of coronary artery calcium score and vascular dysfunction in long-term hemodialysis patients. Hemodialysis International, International Society for Hemodialysis (2013). PDF • Beneficial effects of aged garlic extract and coenzyme Q 10 on vascular elasticity and endothelial function: The FAITH randomized clinical trial Nutrition / Elsevier (2013). PDF • Evaluation of Digital Thermal Monitoring as a Tool to Assess Perioperative Vascular Reactivity J Atheroscler Thromb (2013). PDF • A Novel Technique for the Assessment of Preoperative Cardiovascular Risk: Reactive Hyperemic Response to Short-Term Exercise Bio. Med Research International (2013). PDF • Fingertip Digital Thermal Monitoring: A Fingerprint for Cardiovascular Disease? Int J Cardiovasc Imaging (2010). PDF • Aged garlic extract supplemented with B vitamins, folic acid and L-arginine retards the progression of subclinical atherosclerosis: A randomized clinical trial. Preventive Medicine (2009). PDF • Low fingertip temperature rebound measured by digital thermal monitoring strongly correlates with the presence and extent of coronary artery disease diagnosed by 64 -slice multi-detector computed tomography. Int. J Cardiovasc Imaging (2009). PDF Accompanying Editorial: Digital thermal monitoring of vascular function: a novel tool to improve cardiovascular risk assessment. Vascular Medicine (2009). PDF • Concomitant insulin resistance and impaired vascular function is associated with increased coronary artery calcification. Int. Journal of Cardiology (2009). PDF • Vascular dysfunction measured by fingertip thermal monitoring is associated with the extent of myocardial perfusion defect. JNC (2009). PDF • Vascular function measured by fingertip thermal reactivity is impaired in patients with metabolic syndrome and diabetes. J Clin Hypertens (2009). PDF • Relations between digital thermal monitoring of vascular function, the Framingham risk score, and coronary artery calcium score. JCCT (2008). PDF Accompanying Editorial: Anatomy, physiology, or epidemiology: Which is the best target for assessing vascular health? JCCT (2008). Abstract • Flow mediated change of finger tip temperature in patients with high cardiovascular risk. Cardiologia Hungarica (2005). PDF English summary PDF Graphical Data • Post-Exercise Reactive Hyperemia: A Novel Preoperative Risk Assessment Tool Poster Abstract • Digital Thermal Monitoring: Non-Invasive Assessment of Perioperative Microvascular Function Poster Abstract

DTM Technical Papers: Reproducibility and variability of digital thermal monitoring of vascular reactivity. Clin Physiol Funct Imaging (2011). PDF Use of temperature alterations to characterize vascular reactivity. Clin Physiol Funct Imaging (2011). PDF Sensitivity of Digital Thermal Monitoring Parameters to Reactive Hyperemia. Journal of Biomechanical Engineering, ASME (2010). PDF Digital Thermal Monitoring (DTM) of Vascular Reactivity Closely Correlates with Doppler Flow Velocity. Conf Proc IEEE Eng Med Biol Soc (2009). PDF Lumped parameter thermal model for the study of vascular reactivity in the fingertip. J Biomech Eng (2008). Abstract Interrelationships among noninvasive measures of postischemic macro- and microvascular reactivity J Appl Physiol (2008). PDF Review Articles about Vascular/Endothelial Dysfunction Measurement: Endothelial dysfunction over the course of coronary artery disease. Eur Heart J (2013). PDF The Assessment of Endothelial Function: From Research Into Clinical Practice. Circulation (2012). PDF The Endothelial Cell in Health and Disease: Its Function, Dysfunction, Measurement and Therapy. Int J Impot Res (2010). PDF Endothelial function as a functional expression of cardiovascular risk factors. Biomark Med (2010). PDF

Additional Publications 1. Schier R, Hinkelbein J, Marcus H, Smallwood A, Correa AM, Mehran R, El-Zein R, Riedel B. A novel technique for the assessment of preoperative cardiovascular risk: reactive hyperemic response to short-term exercise. Biomed Res Int. 2013; 2013: 837130. PMID: 23691513 2. Schier R, Marcus HE, Mansur E, Lei X, El-Zein R, Mehran R, Purugganan R, Heir JS, Riedel B, Gottumukkala V. Evaluation of digital thermal monitoring as a tool to assess perioperative vascular reactivity J Atheroscler Thromb. 2013; 20(3): 277 -86. PMID: 23197179 3. Ahmadi N, Mc. Quilkin GL, Akhtar MW, Hajsadeghi F, Kleis SJ, Hecht H, Naghavi M, Budoff M. Reproducibility and variability of digital thermal monitoring of vascular reactivity. Clin Physiol Funct Imaging. 2011 Nov; 31(6): 422 -8. PMID: 21981452 4. Akhtar MW, Kleis SJ, Metcalfe RW, Naghavi M. Sensitivity of digital thermal monitoring parameters to reactive hyperemia. J Biomech Eng. 2010 May; 132(5): 051005. PMID: 20459206 5. Schwartz BG, Economides C, Mayeda GS, Burstein S, Kloner RA. The endothelial cell in health and disease: its function, dysfunction, measurement and therapy. Int J Impot Res. 2010 Mar. Apr; 22(2): 77 -90. Review. PMID: 20032988 6. van der Wall EE, Schuijf JD, Bax JJ, Jukema JW, Schalij MJ. Fingertip digital thermal monitoring: a fingerprint for cardiovascular disease? Int J Cardiovasc Imaging. 2010 Feb; 26(2): 249 -52. PMID: 20012695

http: //endothelix. com/index. php/physicians/youtube-videos? videoid=Fd 89 k. YDny. FE
e7f8f7f03b6ae5eda09eda545dbd1fc4.ppt