

95cbb45e2e6edd6ad8c855a7bf9975ca.ppt
- Количество слайдов: 81
 New Concepts in the Evaluation and Treatment of Dyslipidemia w Nathan D. Wong, Ph. D, FACC w Professor and Director w Heart Disease Prevention Program w Division of Cardiology w University of California, Irvine
 Learning Objectives w Discuss the epidemiological evidence for a role of cholesterol and lipoproteins in coronary heart disease w Examine the results of important cholesterol lowering clinical trials and understand their relevance in clinical practice w Review current NCEP goals for lipid management w Evaluate the efficacy and safety profiles of various cholesterol lowering strategies including diet and lifestyle regimens and pharmacologic agents
 Lipoproteins Water-soluble way to transport hydrophobic lipids • Envelope of phospholipids and free cholesterol • Triglyceride and cholesteryl ester-rich core • Vary in size and density From: Braunwald et al, Heart Disease: A Textbook of Cardiovascular Medicine 6 th ed. , 2001
 0. 95 Chylomicron VLDL Remnants 1. 006 IDL 1.") Lipoprotein Particles VLDL Density (g/ml) 0. 95 Chylomicron VLDL Remnants 1. 006 IDL 1. 019 Chylomicron Remnants LDL-R 1. 050 1. 063 HDL 2 Lp(a) 1. 100 HDL 3 Only these lipoprotein particles found in plaque at biopsy. 1. 20 5 10 20 40 60 Particle Size (nm) 80 1000
Lipoprotein Particles VLDL Density (g/ml) 0. 95 Chylomicron VLDL Remnants 1. 006 IDL 1. 019 Chylomicron Remnants LDL-R 1. 050 1. 063 HDL 2 Lp(a) 1. 100 HDL 3 Only these lipoprotein particles found in plaque at biopsy. 1. 20 5 10 20 40 60 Particle Size (nm) 80 1000
 Lipid Atherogenesis HDL Endothelial injury High plasma LDL + VLDL Adherence of platelets LDL infiltration into intima Release of PDGF Oxidative modification of LDL Liver Cholesterol excreted LCAT APO-A 1 Advanced fibrocalcific lesion Other growth factors + Macrophages Foam cells Fatty streak
 Genetic Causes of Dyslipidemia w Type I – Familial Hyperchylomicronemia Fasting triglycerides > 1000 mg/dl Defect in lipoprotein lipase or apo CII Not necessarily at increased risk of CAD w Type II - Familial Hypercholesterolemia (type II) LDL-C > 95 th percentile for age and gender CAD in men by 3 rd or 4 th decade Defect in LDL receptor Autosomal dominant inheritance Prevalence 1: 500 w Familial Defective apo B 100 Defective apo B alters LDLr handling Previously undetecable from FH
 Genetic Causes of Dyslipidemia w Type III – Hyperlipoproteinemia Increased TC, VLDL, decreased HDL; Increased VLDL: TG Defect in apo E results in increased concentration of remnant particles Rare w Type IV – Familial Hypertriglyceridemia Increased TC (due to VLDL), TG, decreased LDL, HDL Results from hepatic overproduction of VLDL Prevalence 1: 100 – 1: 50; Association with CAD not as strong as FH Heterogeneous inheritance Very sensitive to diet and Et. OH w Type V Increase in chylomicrons and VLDL Rare
 Genetic Causes of Dyslipidemia w Familial Combined Hyperlipidemia Increased TC, LDL and/or triglycerides; decreased HDL Most common genetic dyslipidemia: prevalence 1: 50 Heterogenous inheritance Accounts for 10 -20% of patients with premature CAD w Defects in HDL Metabolism Most often low HDL is secondary to other dyslipidemia Not all associated with increased CAD risk (e. g. apo AIMilano) Tangier’s Disease CETP defects result in increased HDL
 Proportion of U. S. Adults at Recommended Lipid Levels in NHANES 2003 -2004 Ghandehari and Wong et al, Am Heart J 2008
 Men: HDL <") Overall U. S. Adult Population Low HDL-C (26%, 54. 7 M) Men: HDL < 40 mg/dl Women: HDL < 50 mg/dl 13% (26. 6 M) 4% (7. 6 M) High TG (13%, 27. 5 M) 3% (6. 9 M) High LDL-C (28%, 59. 7 M) 6% (13. 7 M) 3% (6. 8 M) ≥ 2 RF and FRS >20, CVD, DM or CKD: LDL ≥ 100 mg/d. L ≥ 2 RF and FRS ≤ 20: LDL ≥ 130 mg/dl <2 RF: LDL ≥ 160 mg/d. L 16% (33. 0 M) 3% (6. 2 M) TG ≥ 200 mg/dl No Lipid Disorder 52%, 111. 1 M Source: NHANES IV 2003 -2004 data, US population projected to 2007. N = 212 million Ghandehari and Wong et al. , Am Heart J 2008
Overall U. S. Adult Population Low HDL-C (26%, 54. 7 M) Men: HDL < 40 mg/dl Women: HDL < 50 mg/dl 13% (26. 6 M) 4% (7. 6 M) High TG (13%, 27. 5 M) 3% (6. 9 M) High LDL-C (28%, 59. 7 M) 6% (13. 7 M) 3% (6. 8 M) ≥ 2 RF and FRS >20, CVD, DM or CKD: LDL ≥ 100 mg/d. L ≥ 2 RF and FRS ≤ 20: LDL ≥ 130 mg/dl <2 RF: LDL ≥ 160 mg/d. L 16% (33. 0 M) 3% (6. 2 M) TG ≥ 200 mg/dl No Lipid Disorder 52%, 111. 1 M Source: NHANES IV 2003 -2004 data, US population projected to 2007. N = 212 million Ghandehari and Wong et al. , Am Heart J 2008
 Men: HDL <") Overall Coronary Heart Disease Subpopulation Low HDL-C (27%, 2. 1 M) Men: HDL < 40 mg/dl Women: HDL < 50 mg/dl 7% (0. 56 M) 5% (0. 38 M) High TG (27%, 2. 2 M) 3% (0. 23 M) High LDL-C (60%, 4. 7 M) LDL ≥ 100 mg/d. L 5% (0. 41 M) 10% (0. 76 M) 10% (0. 81 M) 35% (2. 8 M) TG ≥ 200 mg/dl No Lipid Disorder 26%, 2. 1 M Source: NHANES IV 2003 -2004 data, US population projected to 2007. N = 8 million
Overall Coronary Heart Disease Subpopulation Low HDL-C (27%, 2. 1 M) Men: HDL < 40 mg/dl Women: HDL < 50 mg/dl 7% (0. 56 M) 5% (0. 38 M) High TG (27%, 2. 2 M) 3% (0. 23 M) High LDL-C (60%, 4. 7 M) LDL ≥ 100 mg/d. L 5% (0. 41 M) 10% (0. 76 M) 10% (0. 81 M) 35% (2. 8 M) TG ≥ 200 mg/dl No Lipid Disorder 26%, 2. 1 M Source: NHANES IV 2003 -2004 data, US population projected to 2007. N = 8 million
 Treatment Rates among U. S. Adults with Dyslipidemia in 2003 -2004 (Ghandehari and Wong et al. , Am Heart J 2008) w Overall 35%, Men 36%, Women 34% w Non-Hispanic Whites 36%, Blacks 26%, Hispanic 28% w No Disease 24%, CHD 63%, Stroke 36%, Diabetes 48%
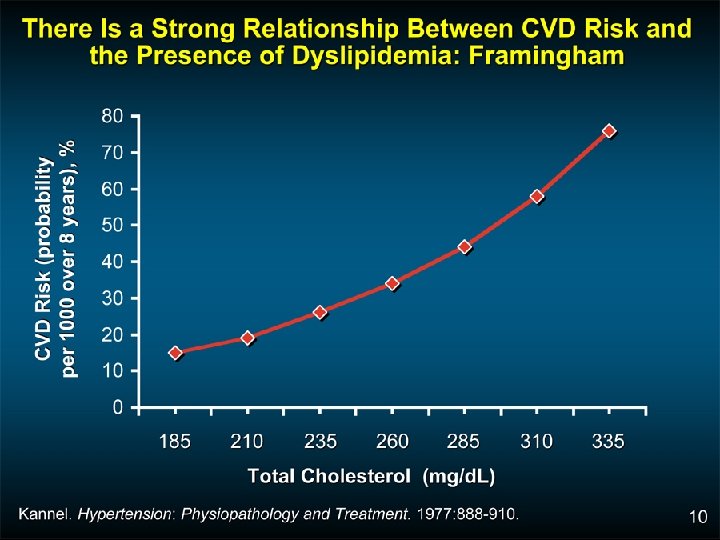
 Total Cholesterol Distribution: CHD vs Non-CHD Population Framingham Heart Study— 26 -Year Follow-up No CHD 35% of CHD Occurs in People with TC<200 mg/d. L 150 CHD 200 250 300 Total Cholesterol (mg/d. L) Castelli WP. Atherosclerosis. 1996; 124(suppl): S 1 -S 9. 1996 Reprinted with permission from Elsevier Science.
 Low HDL-C Levels Increase CHD Risk Even When Total-C Is Normal 11 . 91 11. 24 11 9. 0 0. 7 1 5 6. 6 5. 5 6 6. 5 5 3. 7 7 2 260 230– 259 200– 229 < 200 . 78 2. 0 6 Risk of CHD by HDL-C and Total-C levels; aged 48– 83 y Castelli WP et al. JAMA 1986; 256: 2835– 2838 l-C < 40 40– 49 50– 59 60 HDL-C (mg/d. L) ) 4. 1 5 d. L 7 3 (m 4. 6 3. 8 g/ 4. 8 3 ta 14 12 10 8 6 4 2 0 . 50 To 14 -y incidence rates (%) for CHD 12
 in Atherogenesis: Another Culprit? w Identical to LDL particle except for addition of") Lp(a) in Atherogenesis: Another Culprit? w Identical to LDL particle except for addition of apo(a) w Plasma concentration predictive of atherosclerotic disease in many epidemiologic studies, although not all w Accumulates in atherosclerotic plaque w Binds apo B-containing lipoproteins and proteoglycans w Taken up by foam cell precursors w May interfere with thrombolysis Maher VMG et al. JAMA. 1995; 274: 1771 -1774. Stein JH, Rosenson RS. Arch Intern Med. 1997; 157: 1170 -1176.
Lp(a) in Atherogenesis: Another Culprit? w Identical to LDL particle except for addition of apo(a) w Plasma concentration predictive of atherosclerotic disease in many epidemiologic studies, although not all w Accumulates in atherosclerotic plaque w Binds apo B-containing lipoproteins and proteoglycans w Taken up by foam cell precursors w May interfere with thrombolysis Maher VMG et al. JAMA. 1995; 274: 1771 -1774. Stein JH, Rosenson RS. Arch Intern Med. 1997; 157: 1170 -1176.
: An Independent CHD Risk Factor in Men of the Framingham Offspring Cohort 10") Lp(a): An Independent CHD Risk Factor in Men of the Framingham Offspring Cohort 10 5 2 RR 1. 9 2. 7 1. 8 1. 2 1 0. 5 3. 6 Lp(a) TC HDL-C HT GI Smoking 0. 2 0. 1 RR=relative risk; HT=hypertension; GI=glucose intolerance. Bostom AG et al. JAMA. 1996; 276: 544 -548.
Lp(a): An Independent CHD Risk Factor in Men of the Framingham Offspring Cohort 10 5 2 RR 1. 9 2. 7 1. 8 1. 2 1 0. 5 3. 6 Lp(a) TC HDL-C HT GI Smoking 0. 2 0. 1 RR=relative risk; HT=hypertension; GI=glucose intolerance. Bostom AG et al. JAMA. 1996; 276: 544 -548.
 LDL Particle Size Subclass: Fasting triglycerides of 175 mg/dl or greater or TG/HDL ratio >3 is a good surrogate of small, dense LDL particle side IDL L 3 large, buoyant A L 2 L 1 small, dense AB B
 Accumulation of Other Risk Factors Compound Effects") CHD Risk Per 1000 (in 6 years) Accumulation of Other Risk Factors Compound Effects of Dyslipidemia on Risk of CHD Schaefer EJ, adapted from the Framingham Heart Study Low HDL Smoking Hyperglycemia Hypertension No Other Risk Factors Serum Cholesterol (mg/d. L)
CHD Risk Per 1000 (in 6 years) Accumulation of Other Risk Factors Compound Effects of Dyslipidemia on Risk of CHD Schaefer EJ, adapted from the Framingham Heart Study Low HDL Smoking Hyperglycemia Hypertension No Other Risk Factors Serum Cholesterol (mg/d. L)
 Primary and Secondary Prevention Trials With Statins 1° prevention statin 2° prevention statin 1° prevention placebo 2° prevention placebo 30 4 S Event Rate (%) 25 4 S 20 15 HPS 10 CARE LIPID AFCAPS 5 LIPID HPS CARE WOSCOPS AFCAPS 0 80 90 WOSCOPS 100 110 120 130 140 150 160 170 180 190 200 LDL-C Achieved (mg/d. L) Adapted from Ballantyne CM. Am J Cardiol. 1998; 82: 3 Q-12 Q.
 Collaboration: Efficacy and safety of cholesterol-lowering treatment: prospective meta-analysis fo") Cholesterol Treatment Trialists’ (CCT) Collaboration: Efficacy and safety of cholesterol-lowering treatment: prospective meta-analysis fo data from 90, 056 participants in 14 randomized trials of statins (The Lancet 9/27/05) w Over average 5 year treatment period (per mmol/L reduction —approx 40 mg/dl in LDL-C): 12% reduction in all-cause mortality 19% reduction in coronary mortality 23% reduction in MI or CHD death 17% reduction in stroke 21% reduction in major vascular events No difference in cancer incidence (RR=1. 00). w Statin therapy can safely reduce 5 -year incidence of major coronary events, revascularization, and stroke by about 20% per mmol/L (about 38 mg/dl) reduction in LDL-C
Cholesterol Treatment Trialists’ (CCT) Collaboration: Efficacy and safety of cholesterol-lowering treatment: prospective meta-analysis fo data from 90, 056 participants in 14 randomized trials of statins (The Lancet 9/27/05) w Over average 5 year treatment period (per mmol/L reduction —approx 40 mg/dl in LDL-C): 12% reduction in all-cause mortality 19% reduction in coronary mortality 23% reduction in MI or CHD death 17% reduction in stroke 21% reduction in major vascular events No difference in cancer incidence (RR=1. 00). w Statin therapy can safely reduce 5 -year incidence of major coronary events, revascularization, and stroke by about 20% per mmol/L (about 38 mg/dl) reduction in LDL-C
 Statin Trials: Therapy Reduces Major Coronary Events in Women 10 5 0 -5 -10 -15 % -20 -25 -30 -35 -40 -45 -50 Major coronary events* -34 P=0. 012 -46 P=0. 001 4 S (n=827) CARE (n=576) 2 Prevention n = number of women enrolled. -46 AFCAPS/Tex. CAPS (n=997) 1 Prevention * 4 S = primarily CHD death and nonfatal MI; CARE = coronary death, nonfatal MI, angioplasty, or bypass surgery; AFCAPS/Tex. CAPS = fatal/nonfatal MI, unstable angina, or sudden cardiac death. Miettinen TA et al. Circulation. 1997; 96: 4211 -4218. Lewis SJ et al. J Am Coll Cardiol. 1998; 32: 140 -146. Downs JR et al. JAMA. 1998; 279: 1615 -1622.
 Effects of Statins on Stroke: A Meta-analysis of Primary- and Secondary-Prevention Trials 1° Prevention (-42 to -27)† 2° Prevention (13 -45)† Combined (11 -40)† Relative reduction in rates (%) *P=0. 001. † 95% confidence interval of percentage of relative reduction. Crouse JR et al. Arch Intern Med. 1997; 157: 13051310.
 HPS: First Major Coronary Event Statin. Placebo. Type of Major Allocated Vascular Event (n = 10269) (n = 10267) Coronary events Nonfatal MI 357 (3. 5%) 587 (5. 7%) 707 (6. 9%) Subtotal: MCE 898 (8. 7%) 1212 (11. 8%) Placebo Better 574 (5. 6%) Coronary death Statin Better 0. 73 (0. 67 0. 79) P < 0. 0001 Revascularizations Coronary 513 (5. 0%) 725 (7. 1%) Noncoronary 450 (4. 4%) 532 (5. 2%) Subtotal: any RV 939 (9. 1%) 1205 (11. 7%) Any MVE 0. 76 (0. 70 0. 83) P < 0. 0001 0. 76 (0. 72 0. 81) P < 0. 0001 2033 (19. 8%) 2585 (25. 2%) 0. 4 0. 6 0. 8 Heart Protection Study Collaborative Group. Lancet. 2002; 360: 7 22. 1. 0 1. 2 1. 4
 Statin (n = 10, 269) Placebo") HPS—Simvastatin: Vascular Events by Baseline LDL-C (mg/d. L) Statin (n = 10, 269) Placebo (n = 10, 267) <100 282 (16. 4%) 358 (21. 0%) 100– 129 668 (18. 9%) 871 (24. 7%) 130 1083 (21. 6%) 1356 (26. 9%) All patients 2033 (19. 8%) 2585 (25. 2%) Event Rate Ratio (95% CI) Statin Better Statin Worse 0. 76 (0. 72– 0. 81) P < 0. 0001 0. 4 0. 6 0. 8 1. 0 1. 2 1. 4 www. hpsinfo. org
HPS—Simvastatin: Vascular Events by Baseline LDL-C (mg/d. L) Statin (n = 10, 269) Placebo (n = 10, 267) <100 282 (16. 4%) 358 (21. 0%) 100– 129 668 (18. 9%) 871 (24. 7%) 130 1083 (21. 6%) 1356 (26. 9%) All patients 2033 (19. 8%) 2585 (25. 2%) Event Rate Ratio (95% CI) Statin Better Statin Worse 0. 76 (0. 72– 0. 81) P < 0. 0001 0. 4 0. 6 0. 8 1. 0 1. 2 1. 4 www. hpsinfo. org
 w 2838 patients aged 40 -75 with type 2") Collaborative Atorvastatin Diabetes Study (CARDS) w 2838 patients aged 40 -75 with type 2 diabetes, no prior CVD, but at least 1 of the following: retinopathy, albuminuria, smoking, or hypertension w Randomization to 10 mg atorvastatin or placebo w Mean follow-up 3. 9 years w Reduction in all CVD events of 37% (p=0. 001), all cause mortality 27% (p=0. 059). CHD events reduced 36% and stroke 48%. Colhoun HM et al. , The Lancet 2004; 364: 685 -696
Collaborative Atorvastatin Diabetes Study (CARDS) w 2838 patients aged 40 -75 with type 2 diabetes, no prior CVD, but at least 1 of the following: retinopathy, albuminuria, smoking, or hypertension w Randomization to 10 mg atorvastatin or placebo w Mean follow-up 3. 9 years w Reduction in all CVD events of 37% (p=0. 001), all cause mortality 27% (p=0. 059). CHD events reduced 36% and stroke 48%. Colhoun HM et al. , The Lancet 2004; 364: 685 -696
—TIMI") HMG-Co. A Reductase Inhibitor: Secondary Prevention Pravastatin or Atorvastatin Evaluation and Infection Therapy (PROVE-IT)—TIMI 22 Study 4, 162 patients with an ACS randomized to atorvastatin (80 mg) or pravastatin (40 mg) for 24 months Recurrent MI or Cardiac Death 30 Atorvastatin Pravastatin 25 16% RRR 20 15 10 5 P =0. 005 0 3 6 9 12 15 18 21 24 27 30 Follow-up (months) ACS=Acute coronary syndrome, CV=Cardiovascular, MI=Myocardial infarction, RRR=Relative risk reduction Cannon CP et al. NEJM 2004; 350: 1495 -1504
HMG-Co. A Reductase Inhibitor: Secondary Prevention Pravastatin or Atorvastatin Evaluation and Infection Therapy (PROVE-IT)—TIMI 22 Study 4, 162 patients with an ACS randomized to atorvastatin (80 mg) or pravastatin (40 mg) for 24 months Recurrent MI or Cardiac Death 30 Atorvastatin Pravastatin 25 16% RRR 20 15 10 5 P =0. 005 0 3 6 9 12 15 18 21 24 27 30 Follow-up (months) ACS=Acute coronary syndrome, CV=Cardiovascular, MI=Myocardial infarction, RRR=Relative risk reduction Cannon CP et al. NEJM 2004; 350: 1495 -1504
 HMG-Co. A Reductase Inhibitor: Secondary Prevention Relationship between LDL Levels and Event Rates in Secondary Prevention Trials of Patients with Stable CHD 30 25 Event (%) 4 S Statin Placebo 4 S 20 15 LIPID CARE 10 HPS 5 0 LIPID CARE HPS TNT (atorvastatin 10 mg/d) TNT (atorvastatin 80 mg/d) 0 70 90 110 130 150 LDL-C (mg/d. L) 170 190 210 LDL-C=Low density lipoprotein cholesterol; TNT=Treating to New Targets; HPS=Heart Protection Study; CARE=Cholesterol and Recurrent Events Trial; LIPID=Long-term Intervention with Pravastatin in Ischaemic Disease; 4 S=Scandinavian Simvastatin Survival Study. La. Rosa JC et al. NEJM. 2005; 352: 1425 -1435
 TNT: Rationale TNT Screening ? Atorvastatin 10 mg Atorvastatin") Patients With CHD Events (%) TNT: Rationale TNT Screening ? Atorvastatin 10 mg Atorvastatin 80 mg (1. 6) (2. 1) (2. 6) (3. 1) (3. 6) (4. 1) LDL-C, mg/d. L (mmol/L) Adapted from La. Rosa et al. N Engl J Med. 2005: 352: 1425 -1435. (4. 7) (5. 2)
Patients With CHD Events (%) TNT: Rationale TNT Screening ? Atorvastatin 10 mg Atorvastatin 80 mg (1. 6) (2. 1) (2. 6) (3. 1) (3. 6) (4. 1) LDL-C, mg/d. L (mmol/L) Adapted from La. Rosa et al. N Engl J Med. 2005: 352: 1425 -1435. (4. 7) (5. 2)
 TNT: Changes in LDL-C by Treatment Group Baseline Mean LDL-C level = 101 mg/d. L (2. 6 mmol/L) 3. 5 3. 0 2. 5 P<. 001 Mean LDL-C level = 77 mg/d. L (2. 0 mmol/L) 2. 0 1. 5 1. 0 0. 5 0 Screen 0 3 12 24 36 48 Study Visit (Months) La. Rosa et al. N Engl J Med. 2005; 352: 1425 -1435. 60 Final Mean LDL-C (mmol/L) Mean LDL-C (mg/d. L) 4. 0
 Proportion of Patients Experiencing Major Cardiovascular Event TNT: Primary Efficacy Outcome Measure: Major Cardiovascular Events* 0. 15 Atorvastatin 10 mg Atorvastatin 80 mg Relative risk reduction 22% Mean LDL-C level = 101 mg/d. L 0. 10 0. 05 Mean LDL-C level = 77 mg/d. L HR=0. 78 (95% CI 0. 69, 0. 89); P<. 001 0 0 1 2 3 Time (Years) 4 5 * CHD death, nonfatal non–procedure-related MI, resuscitated cardiac arrest, fatal or nonfatal stroke. La. Rosa et al. N Engl J Med. 2005; 352: 1425 -1430. 6
 METEOR Trial: Study Design 984 asymptomatic patients with moderately elevated cholesterol and low risk of CVD according to the National Cholesterol Education Program Adult Treatment Panel III guidelines criteria (0 -1 risk factor and LDL 120 -190 mg/d. L or > 2 risk factors and LDL 120 to <160 mg/d. L with a 10 -year coronary heart disease risk < 10%); HDL-C <60 mg/d. L; triglycerides <500 mg/d. L; evidence of thickening of the walls of the extracranial carotid arteries as measured by B-mode ultrasound (max CIMT between 1. 2 and <3. 5 mm) 5: 2 Randomized. Double-blinded. Placebo-controlled. Mean age = 57 years. 40% Female. R Rosuvastatin (40 mg) n=702 Placebo n=282 6, 12, 18 and 24 mos. follow-up g g Primary Endpoint: Annualized rate of change in maximum CIMT Secondary Endpoint: Annualized rate of change in maximum CIMT derived from the near and far walls of the right and left common carotid artery; the right and left carotid bulb; the right and left internal carotid artery; and annualized rate of change in mean CIMT for the near and far walls of the right and left common carotid artery. ACC 2007
 Change") METEOR Trial: Primary Endpoint Change in CIMT for 12 Carotid Artery sites (mm/year) Change in maximum CIMT with rosuvastatin vs. placebo p < 0. 001 Rosuvastatin n = 282 n = 702 Placebo • After two years, treatment with rosuvastatin was associated with a statistically significant reduction in the rate of progression of CIMT thickening in overall carotid segments, while the placebo group displayed progression (p<0. 001). ACC 2007
METEOR Trial: Primary Endpoint Change in CIMT for 12 Carotid Artery sites (mm/year) Change in maximum CIMT with rosuvastatin vs. placebo p < 0. 001 Rosuvastatin n = 282 n = 702 Placebo • After two years, treatment with rosuvastatin was associated with a statistically significant reduction in the rate of progression of CIMT thickening in overall carotid segments, while the placebo group displayed progression (p<0. 001). ACC 2007
 Are LDL and HDL Effects Additive? 2 nd Order Relationship % Absolute Change in LDL+HDL 0 10 20 30 0 % CV Event RRR BIP 20 VA HIT 40 DAIS 80 100 50 60 70 80 ALLHAT CDP LIPID PROSPER CARE, HPS 4 S HHS WOSCOPS 60 40 ASCOT AFCAPS/ Tex. CAPS FATS F/U FATS R 2 = 0. 8512 HATS
 3. 5 3.") HATS: Percent Change in Stenosis 4. 5 4. 0 Change (%) 3. 5 3. 0 2. 5 2. 0 1. 5 1. 0 0. 5 0. 0 -0. 5 -1. 0 Placebo Antioxidant Vitamins* Simvastatin/ Niacin† *P = 0. 16 for comparison with placebo; †P < 0. 001; ‡P = 0. 004. HATS = HDL-Atherosclerosis Treatment Study. Adapted from Brown BG et al. N Engl J Med. 2001; 345: 1583 -1592. Simvastatin / Niacin/ Antioxidants‡
HATS: Percent Change in Stenosis 4. 5 4. 0 Change (%) 3. 5 3. 0 2. 5 2. 0 1. 5 1. 0 0. 5 0. 0 -0. 5 -1. 0 Placebo Antioxidant Vitamins* Simvastatin/ Niacin† *P = 0. 16 for comparison with placebo; †P < 0. 001; ‡P = 0. 004. HATS = HDL-Atherosclerosis Treatment Study. Adapted from Brown BG et al. N Engl J Med. 2001; 345: 1583 -1592. Simvastatin / Niacin/ Antioxidants‡
 HATS: Patients Free of Events Simvastatin-niacin 100 97% 90") Patients Free of Events (%) HATS: Patients Free of Events Simvastatin-niacin 100 97% 90 All placebos 80 76% RR = 0. 10 P = 0. 03 70 0 0 1 2 Years HATS = HDL-Atherosclerosis Treatment Study. Adapted from Brown BG et al. N Engl J Med. 2001; 345: 1583 -1592. 3
Patients Free of Events (%) HATS: Patients Free of Events Simvastatin-niacin 100 97% 90 All placebos 80 76% RR = 0. 10 P = 0. 03 70 0 0 1 2 Years HATS = HDL-Atherosclerosis Treatment Study. Adapted from Brown BG et al. N Engl J Med. 2001; 345: 1583 -1592. 3
 ARBITER 2: Primary Endpoint Carotid IMT Across 12 Months 0. 07 CIMT at 12 months Change in CIMT (mm +/- SEM) 0. 06 0. 05 68% decrease in progression • Statin vs ER niacin + statin P = 0. 08 • Intent-to-treat analysis of statin vs. ER niacin + statin P = 0. 048 0. 04 0. 03 • Non-Insulin resistant pts only: statin vs. ER niacin P = 0. 026 0. 02 0. 01 0 ER Niacin Placebo Taylor AJ, et al. ARBITER 2: A double-blind, placebo-controlled study of extended-release niacin on Atherosclerosis progression in secondary prevention patients treated with statins. Circulation. 2004
 ASTEROID Trial, ACC 2008 A Study to Evaluate the Effect of Rosuvastatin on Intravascular Ultrasound-Derived Coronary Prior studies. Atheroma Burden of a decrease have shown evidence in atherosclerosis progression with statin therapy. No statin monotherapy has demonstrated a cessation or regression of atherosclerosis.
 ASTEROID Trial: Study Design 507 patients > 18 years with angiographic evidence of CAD, excluding patients using lipid-lowering medication for more than 3 mos within the previous 12 mos, uncontrolled triglyceride levels, and poorly controlled diabetes. Prospective. Multicenter. International. Open Label. Treatment for 24 mos. 292 patients with 613 matched stenoses at baseline and study end. Rosuvastatin 40 mg/day n=292 24 month treatment g g Primary Endpoint: Rosuvastatin regression of coronary atherosclerosis by intravascular ultrasound (IVUS) Secondary Endpoint: Rosuvastatin regression of coronary atherosclerosis by quantitative coronary angiography (QCA). Copyleft Clinical Trial Results. You Must Redistribute Slides Presented at ACC 08
 ASTEROID Trial: Mean Diameter Stenosis p < 0. 001 37.") Mean diameter stenosis (%) ASTEROID Trial: Mean Diameter Stenosis p < 0. 001 37. 3 ± 8. 4% n = 292 Copyleft Clinical Trial Results. You Must Redistribute Slides 36. 0 ± 10. 1% n =292 • The mean percent diameter stenosis decreased from 37. 3± 8. 4% to 36± 10. 1% after 24 months of rosuvastatin therapy. • There was a progression of atherosclerosis in 6% of patients by >0. 2 mm. Presented at ACC 08
Mean diameter stenosis (%) ASTEROID Trial: Mean Diameter Stenosis p < 0. 001 37. 3 ± 8. 4% n = 292 Copyleft Clinical Trial Results. You Must Redistribute Slides 36. 0 ± 10. 1% n =292 • The mean percent diameter stenosis decreased from 37. 3± 8. 4% to 36± 10. 1% after 24 months of rosuvastatin therapy. • There was a progression of atherosclerosis in 6% of patients by >0. 2 mm. Presented at ACC 08
 ASTEROID Trial: LDL-C and HDL-C levels • LDL-C levels were reduced to a mean of 61. 1± 20. 3 mg/d. L (53. 3% reduction) after rosuvastatin therapy. HDL-C levels increased from 42. 8 mg/d. L to 48. 3± 12. 4 mg/d. L (13. 8% increase) after rosuvastatin therapy. w. CONCLUSION: Treatment of rosuvastatin for 24 months was associated with atherosclerosis regression evidenced by an increase in the minimum lumen diameter and a decrease in percent Copyleft Clinical Trial Results. You Must Redistribute Slides Presented at artery diameter stenosis in patients with coronary ACC 08
 NCEP ATP III: Evaluation— Major Risk Factors for CAD w. Age (men 45 y; women 55 y) w. Cigarette smoking w. Hypertension (BP 140/90 mm Hg or antihypertensive medication) w. HDL-C <40 mg/d. L w. Family history of premature CAD <55 y in first-degree male relative <65 y in first-degree female relative Expert Panel on Detection, Evaluation, and Treatment of High Blood Cholesterol in Adults. JAMA. 2001; 285: 2486.
 NCEP ATP III: Evaluation— CAD Risk Equivalents w. Diabetes w. Atherosclerotic disease Peripheral artery disease Abdominal aortic aneurysm Symptomatic carotid artery disease w. CAD 10 -year risk >20% Expert Panel on Detection, Evaluation, and Treatment of High Blood Cholesterol in Adults. JAMA. 2001; 285: 2486.
 NCEP ATP III: Evaluation— Need for Framingham Calculation Risk Profile 10 -Year Risk for CAD Need for Framingham Calculation 1 RF <10% No 0%-10% Yes 10%-20% Yes >20% No 2 RF CAD or CAD risk equivalent Expert Panel on Detection, Evaluation, and Treatment of High Blood Cholesterol in Adults. JAMA. 2001; 285: 2486.
 ATP III Framingham Risk Scoring Assessing CHD Risk in Men Step 1: Age Years 20 -34 35 -39 40 -44 45 -49 50 -54 55 -59 60 -64 65 -69 70 -74 75 -79 Step 4: Systolic Blood Pressure Points -9 -4 0 3 6 8 10 11 12 13 Step 2: Total Cholesterol TC Points at (mg/d. L) Age 20 -39 70 -79 <160 0 160 -199 4 200 -239 7 240 -279 9 280 11 Step 3: HDL-Cholesterol HDL-C (mg/d. L) 60 0 40 -49 1 <40 2 Points at Points if Untreated if Treated 0 0 0 1 1 2 2 3 Points at Age 40 -49 Age 50 -59 Age 60 -69 Age 0 3 5 6 8 0 2 3 4 5 0 1 1 2 3 0 0 0 1 1 Step 5: Smoking Status Points -1 50 -59 Systolic BP (mm Hg) <120 120 -129 130 -139 140 -159 160 70 -79 Nonsmoker Smoker Points at Age 20 -39 0 8 Step 6: Adding Up the Points at Age Total cholesterol HDL-cholesterol Systolic blood pressure Smoking status Point total Step 7: CHD Risk Point Total 10 -Year Risk <0 <1% 0 1% 1 1% 2 1% 3 1% 4 1% 5 2% 6 2% 7 3% 8 4% 9 5% 10 6% Points at Point Total 10 -Year 11 12 13 14 15 16 17 8% 10% 12% 16% 20% 25% 30% Age 40 -49 Age 50 -59 Age 60 -69 Age 0 5 0 3 0 1 Note: Risk estimates were derived from the experience of the Framingham Heart Study, a predominantly Caucasian population in Massachusetts, USA. Expert Panel on Detection, Evaluation, and Treatment of High Blood Cholesterol in Adults. JAMA. 2001; 285: 2486 -2497. © 2001, Professional Postgraduate Services® www. lipidhealth. org
 ATP III Framingham Risk Scoring Assessing CHD Risk in Women Step 1: Age Years 20 -34 35 -39 40 -44 45 -49 50 -54 55 -59 60 -64 65 -69 70 -74 75 -79 Step 4: Systolic Blood Pressure Points -7 -3 0 3 6 8 10 12 14 16 Systolic BP (mm Hg) <120 120 -129 130 -139 140 -159 160 Points if Untreated if Treated 0 0 1 3 2 4 3 5 4 6 HDL-C (mg/d. L) 60 Points -1 50 -59 0 40 -49 1 <40 2 Age Total cholesterol HDL-cholesterol Systolic blood pressure Smoking status Point total Step 7: CHD Risk Step 2: Total Cholesterol TC Points at (mg/d. L) Age 20 -39 70 -79 <160 0 160 -199 4 200 -239 8 240 -279 11 13 Step 280 3: HDL-Cholesterol Step 6: Adding Up the Points at Age 40 -49 Age 50 -59 Age 60 -69 Age 0 3 6 8 10 0 2 4 5 7 0 1 2 3 4 0 1 1 2 2 Step 5: Smoking Status Points at Age 20 -39 70 -79 Nonsmoker 0 Smoker from the experience 9 of Points at Point Total 10 -Year Risk <9 <1% 9 1% 10 1% 11 1% 12 1% 13 2% 14 2% 15 3% 16 4% 17 5% 18 6% 19 8% Points at Point Total 10 -Year 20 21 22 23 24 25 11% 14% 17% 22% 27% 30% Points at Age 40 -49 Age 50 -59 Age 60 -69 Age 0 0 7 4 Note: Risk estimates were derived the Framingham Heart Study, a predominantly Caucasian population in Massachusetts, USA. Expert Panel on Detection, Evaluation, and Treatment of High Blood Cholesterol in Adults. JAMA. 2001; 285: 2486 -2497. 0 2 0 1 © 2001, Professional Postgraduate Services® www. lipidhealth. org
 NCEP ATP III Guidelines: Treatment Risk Category 1 RF 2 RFs CAD or CAD risk equivalent LDL-C Level to Initiate Goal to Initiate Drug Therapy (mg/d. L) TLC (mg/d. L) <160 190 (10 -year risk 0%-10%) <130 160 (10 -year risk 10%-20%) <130 <100 130 Expert Panel on Detection, Evaluation, and Treatment of High Blood Cholesterol in Adults. JAMA. 2001; 285: 2486.
 Risk Category Non–HDL-C Goal") NCEP ATP III: Setting Goals— Secondary–Non-HDL-C (Patients With TG 200) Risk Category Non–HDL-C Goal (mg/d. L) 1 RF <190 2 RFs (CAD risk 20%) <160 CAD or CAD risk equivalent (CAD risk >20%) <130 Expert Panel on Detection, Evaluation, and Treatment of High Blood Cholesterol in Adults. JAMA. 2001; 285: 2486.
NCEP ATP III: Setting Goals— Secondary–Non-HDL-C (Patients With TG 200) Risk Category Non–HDL-C Goal (mg/d. L) 1 RF <190 2 RFs (CAD risk 20%) <160 CAD or CAD risk equivalent (CAD risk >20%) <130 Expert Panel on Detection, Evaluation, and Treatment of High Blood Cholesterol in Adults. JAMA. 2001; 285: 2486.
 Pharmacologic Treatment Improve diet Statins") NCEP ATP III Guidelines: Treatment Therapeutic Lifestyle Change (TLC) Pharmacologic Treatment Improve diet Statins (HMG-Co. A reductase inhibitors) Weight reduction Physical activity Fibrates Niacin Bile acid sequestrants Expert Panel on Detection, Evaluation, and Treatment of High Blood Cholesterol in Adults. JAMA. 2001; 285: 2486.
NCEP ATP III Guidelines: Treatment Therapeutic Lifestyle Change (TLC) Pharmacologic Treatment Improve diet Statins (HMG-Co. A reductase inhibitors) Weight reduction Physical activity Fibrates Niacin Bile acid sequestrants Expert Panel on Detection, Evaluation, and Treatment of High Blood Cholesterol in Adults. JAMA. 2001; 285: 2486.
 I have some bad news for you. While your cholesterol has remained the same, the research findings have changed.
 Lipid Management Goal LDL-C should be less than 100 mg/d. L I IIa IIb III Further reduction to LDL-C to < 70 mg/d. L is reasonable If TG >200 mg/d. L, non-HDL-C should be < 130 mg/d. L* *Non-HDL-C = total cholesterol minus HDL-C
 Lipid Management Goals: NCEP Risk Category High risk: CHD or CHD risk equivalents (10 -year risk >20%) and Very high risk: ACS or established CHD plus: multiple major risk factors (especially diabetes) or severe and poorly controlled risk factors Consider Drug Therapy LDL-C and non. HDL-C Goal Initiate TLC <100 mg/d. L >100 mg/d. L (<100 mg/d. L: consider drug options) All patients >100 mg/d. L (<100 mg/d. L: consider drug options) if TG > 200 mg/d. L, non-HDL-C should be < 130 mg/d. L <70 mg/d. L, non-HDL-C < 100 mg/d. L ATP=Adult Treatment Panel, CHD=Coronary heart disease, LDL-C=Low-density lipoprotein cholesterol, TLC=Therapeutic lifestyle changes Grundy, S. et al. Circulation 2004; 110: 227 -39.
 Lipid Management Recommendations For all patients Start dietary therapy (<7% of total calories as saturated fat and <200 mg/d cholesterol) Adding plant stanol/sterols (2 gm/day) and viscous fiber (>10 mg/day) will further lower LDL Promote daily physical activity and weight management. I IIa IIb III Encourage increased consumption of omega-3 fatty acids in fish or 1 g/day omega-3 fatty acids in capsule form for risk reduction.
 Lipid Management Recommendations Assess fasting lipid profile in all patients, and within 24 hours of hospitalization for those with an acute event. For patients hospitalized, initiate lipid-lowering medication as recommended below prior to discharge according to the following schedule: If baseline LDL-C > 100 mg/d. L, initiate LDL-lowering drug therapy If on-treatment LDL-C > 100 mg/d. L, intensify LDLlowering drug therapy (may require LDL lowering drug combination) I IIa IIb III If baseline is LDL-C 70 to 100 mg/d. L, it is reasonable to treat to LDL < 70 mg/d. L When LDL lowering medications are used, obtain at least a 30 -40% reduction in LDL-C levels.
 Lipid Management Recommendations If TG are 200 -499 mg/d. L, non-HDL-C should be < 130 mg/d. L I IIa IIb III Further reduction of non-HDL to < 100 mg/d. L is reasonable Therapeutic options to reduce non-HDL-C: More intense LDL-C lowering therapy I (B) or Niacin (after LDL-C lowering therapy) IIa (B) or Fibrate (after LDL-C lowering therapy) IIa (B) If TG are > 500 mg/d. L, therapeutic options to prevent I IIa IIb III pancreatitis are fibrate or niacin before LDL lowering therapy; and treat LDL-C to goal after TG-lowering therapy. Achieve non-HDL-C < 130 mg/d. L, if possible

 Therapeutic Lifestyle Changes Nutrient Composition of TLC Diet Nutrient Recommended Intake w w w w w Saturated fat Less than 7% of total calories Polyunsaturated fat Up to 10% of total calories Monounsaturated fat Up to 20% of total calories Total fat 25– 35% of total calories Carbohydrate 50– 60% of total calories Fiber 20– 30 grams per day Protein Approximately 15% of total calories Cholesterol Less than 200 mg/day Total calories (energy) Balance energy intake and expenditure to maintain desirable body weight
 Effect of Mediterranean-style diet in the metabolic syndrome w 180 pts with metabolic syndrome randomized to Mediterranean-style vs. prudent diet for 2 years w Those in intervention group lost more weight (-4 kg) than those in the control group (+0. 6 kg) (p<0. 01), and significant reductions in CRP and Il-6. w After 2 years, 40 pts in intervention group still had features of metabolic syndrome compared to 78 pts in the control group Esposito K et al. JAMA 2004; 292(12): 1440 -6.
 w Diet high in fruits and vegetables and") Dietary Approaches to Stop Hypertension (DASH) w Diet high in fruits and vegetables and low-fat dairy products lowers blood pressure more than a sodium -restricted diet w 7 -8 servings/day of grain/grain products, 4 -5 vegetable, 4 -5 fruit, 2 -3 low- or non-fat dairy products, 2 or less meat, poultry, and fish. w NEJM 1997; 366: 1117 -24.
Dietary Approaches to Stop Hypertension (DASH) w Diet high in fruits and vegetables and low-fat dairy products lowers blood pressure more than a sodium -restricted diet w 7 -8 servings/day of grain/grain products, 4 -5 vegetable, 4 -5 fruit, 2 -3 low- or non-fat dairy products, 2 or less meat, poultry, and fish. w NEJM 1997; 366: 1117 -24.
 Weight Loss with a Low-Carbohydrate, Mediterranean or Low-Fat Diet: Dietary Intervention Randomized Controlled Trial (DIRECT) 322 moderately obese subjects, mean age 52, mean BMI 31, 86% male, randomized to one of three diets for 2 years. Adherence 95% at 1 year, 85% at 2 years. Weight loss Group Low-fat (kg) All patients -2. 9 All completers -3. 3 Men -3. 4 Women -0. 1 Mediterranean Low-carb (kg) -4. 4 -4. 7 -4. 6 -5. 5 -4. 0 -4. 9 -6. 2 -2. 4 Shai I et al. N Engl J Med 2008; 359: 229 -241.
 HDL LDL Triglycerides TC/HDL ratio +6.") Lipid changes Parameter Low-fat Low-carb Mediterranean (mg/d. L) HDL LDL Triglycerides TC/HDL ratio +6. 4 -0. 05 -2. 8 -0. 6 +8. 4 -3. 0 -23. 7 -1. 1 +6. 3 -5. 6 -21. 8 -0. 9 Conclusions: Mediterranean and low-carbohydrate diets may be effective alternatives to low-fat diets. Favorable effects on lipids from the low carbohydrate diet and on glycemic control from the Mediterranean diet suggest diets may be tailored to individual needs/preferences. Shai I et al. N Engl J Med 2008; 359: 229 -241.
Lipid changes Parameter Low-fat Low-carb Mediterranean (mg/d. L) HDL LDL Triglycerides TC/HDL ratio +6. 4 -0. 05 -2. 8 -0. 6 +8. 4 -3. 0 -23. 7 -1. 1 +6. 3 -5. 6 -21. 8 -0. 9 Conclusions: Mediterranean and low-carbohydrate diets may be effective alternatives to low-fat diets. Favorable effects on lipids from the low carbohydrate diet and on glycemic control from the Mediterranean diet suggest diets may be tailored to individual needs/preferences. Shai I et al. N Engl J Med 2008; 359: 229 -241.
 Possible Benefits From Other Therapies Therapy Result • Soluble fiber in diet (2– 8 g/d) (oat bran, fruit, and vegetables) LDL-C 1% to 10% • Soy protein (20– 30 g/d) LDL-C 5% to 7% • Stanol esters (1. 5– 4 g/d) (inhibit cholesterol absorption) LDL-C 10% to 15% • Fish oils (3– 9 g/d) (n-3 fatty acids) Triglycerides 25% to 35% Jones PJ. Curr Atheroscler Rep. 1999; 1: 230 -235. Lichtenstein AH. Curr Atheroscler Rep. 1999; 1: 210 -214. Rambjor GS et al. Lipids. 1996; 31: S 45 -S 49. Ripsin CM et al. JAMA. 1992; 267: 3317 -3325.
 Dietary Adjuncts w TLC for patients with LDL-C = 160 Dietary Component Low saturated fat/dietary cholesterol Viscous fiber (10– 25 g/d) Plant stanols/sterols (2 g/d) Total LDL-C (mg/d. L) – 12 – 8 – 16 – 36 mg/dl Walden CE et al. Arterioscler Thromb Vasc Biol 1997; 17: 375 -382. Jenkins DJ et al. Curr Opin Lipidol 2000; 11: 49 -56. Cato N. Stanol meta-analysis. Personal communication, 2000.
 Effect of Lipid-modifying Therapies Therapy TC Bile acid sequestran 7 -10% ts LDL HDL TG Patient tolerability 10 -18% 3% Neutral or Poor to 30 -70% reasonabl e Nicotinic acid 1020% 10 -20% 14 -35% Fibrates (gemfibrozi l) 19% 4 -21% 11 -13% 30% Good Statins* 1937% 25 -50% 4 -12% 14 -29% Good Ezetimibe TC–total 13% cholesterol, 18% density 1% 9% Good LDL–low lipoprotein, HDL–high density lipoprotein, TG–triglyceride. * Daily dose of 40 mg of each drug, excluding rosuvastatin. Questran® Prescribing Information, Colestid ® Prescribing Information, Wel. Chol ® Prescribing information, Niaspan ® Prescribing Information, Lopid ® Prescribing Information, Tri. Cor ® Prescribing Information, Lipitor ® Prescribing Information, Zocor ® Prescribing Information, Mevaco ® r Prescribing Information, Lescol ® Prescribing Information, Pravacol ® Prescribing Information; Zetia ® Prescribing Information.
 Pharmacologic Therapy: Niacin w Reduces HDL catabolism and VLDL production w Primarily used to treat low HDL-C (15%-35% ) and elevated TG (20%-50% ) w LDL-C 5%-25% w Side effects Hepatotoxicity, hyperglycemia, hyperuricemia, upper GI distress, flushing, itching w Contraindicated in patients with liver disease, gout, peptic ulcer Expert Panel on Detection, Evaluation, and Treatment of High Blood Cholesterol in Adults. JAMA. 2001; 285: 2486.
 Pharmacologic Therapy: Fibrates w Inhibit hepatic TG production and increase HDL production w Used to treat elevated TG (20%-50% ) and low HDL-C (10%-20% ) w Variable effect on LDL-C w Side effects Dyspepsia, gallstones, myopathy Increased with statins w Contraindicated in patients with severe renal or hepatic disease Expert Panel on Detection, Evaluation, and Treatment of High Blood Cholesterol in Adults. JAMA. 2001; 285: 2486.
 w Reduce LDL-C 18– 55% &") Drug Therapy HMG Co. A Reductase Inhibitors (Statins) w Reduce LDL-C 18– 55% & TG 7– 30% w Raise HDL-C 5– 15% w Major side effects Myopathy Increased liver enzymes w Contraindications Absolute: liver disease Relative: use with certain drugs
Drug Therapy HMG Co. A Reductase Inhibitors (Statins) w Reduce LDL-C 18– 55% & TG 7– 30% w Raise HDL-C 5– 15% w Major side effects Myopathy Increased liver enzymes w Contraindications Absolute: liver disease Relative: use with certain drugs
 Effect of Statin Therapy on LDL-C Levels: “The Rule of 6” Illingworth DR. Med Clin North Am. 2000; 84: 23 -42.
1, 2 Mean") Percentage Change From Baseline in LDL-C at Week 6 by Dose (ITT)1, 2 Mean Percent Change From Baseline in LDL-C ( SE) Dose 0 10 mg 20 mg 40 mg 80 mg Rosuvastatin Atorvastatin Simvastatin Pravastatin – 10 – 20 – 30 – 40 * – 50 ** † – 60 *P<. 002 vs atorvastatin 10 mg; simvastatin 10 mg, 20 mg, 40 mg; pravastatin 10 mg, 20 mg, 40 mg **P<. 002 vs atorvastatin 20 mg, 40 mg; simvastatin 20 mg, 40 mg, 80 mg; pravastatin 20 mg, 40 mg † P<. 002 vs atorvastatin 40 mg; simvastatin 40 mg, 80 mg; pravastatin 40 mg 1. Jones PH, Davidson MH, Stein EA, et al. Am. J. Cardiology 2003; 93: 152 -160. 2. Data on file, DA-CRS-02 Astra. Zeneca Pharmaceuticals LP, Wilmington, DE.
Percentage Change From Baseline in LDL-C at Week 6 by Dose (ITT)1, 2 Mean Percent Change From Baseline in LDL-C ( SE) Dose 0 10 mg 20 mg 40 mg 80 mg Rosuvastatin Atorvastatin Simvastatin Pravastatin – 10 – 20 – 30 – 40 * – 50 ** † – 60 *P<. 002 vs atorvastatin 10 mg; simvastatin 10 mg, 20 mg, 40 mg; pravastatin 10 mg, 20 mg, 40 mg **P<. 002 vs atorvastatin 20 mg, 40 mg; simvastatin 20 mg, 40 mg, 80 mg; pravastatin 20 mg, 40 mg † P<. 002 vs atorvastatin 40 mg; simvastatin 40 mg, 80 mg; pravastatin 40 mg 1. Jones PH, Davidson MH, Stein EA, et al. Am. J. Cardiology 2003; 93: 152 -160. 2. Data on file, DA-CRS-02 Astra. Zeneca Pharmaceuticals LP, Wilmington, DE.
 When LDL-lowering drug therapy is employed in high-risk or moderately high risk patients, intensity of therapy should be sufficient to achieve a 30– 40% reduction in LDL-C levels.
 Doses of Statins Required to Attain 30 -40% Reduction of LDL-C Dose, mg/d LDL Reduction, % Atorvastatin 10 39 Lovastatin 40 31 Pravastatin 40 34 Simvastatin 20 -40 35 -41 Fluvastatin 40 -80 25 -35 Rosuvastatin 5 -10 39 -45
 Why combination therapy? w Few patients achieve LDL-C goal on monotherapy w Uptitration of dosage is rare w LDL-C goals are getting more aggressive w High-dose statins increase risk of side effects w Can address mixed dyslipidemia (e. g. , few pts achieve adequate control of HDL-C and triglycerides on monotherapy)
 Options for Patients who Fail to Reach LDL-C Goal on Statin Monotherapy Addition of: • Niacin • Bile acid sequestrant • Cholesterol absorption inhibitor
 Bile Acid Sequestrants w. Major actions Reduce LDL-C 15%-30% Raise HDL-C 3%-5% May increase TG w. Side effects GI distress/constipation Decreased absorption of other drugs (1 st generation) w. Contraindications Dysbetalipoproteinemia Elevated TG (especially >400 mg/d. L)
 New Bile Acid Sequestrant: Colesevelam w. Lower dose for effect w. Fewer GI complaints than with other bile acid sequestrants w. Reduces absorption of -carotene w. Requires 4 -6 tablets/day Davidson et al. Expert Opin Investig Drugs. 2000; 9: 2663.
 Colesevelam Monotherapy: Efficacy % Change from baseline at wk 24 LDL-C HDL-C TG † Placebo (n=88) * *P<0. 001 vs placebo. †P=0. 04 vs placebo. Insull et al. Mayo Clin Proc. 2001; 76: 971. Colesevelam 3. 8 g/d (n=95)
 Limitations of Current Intestinal-Acting Agents w. Bile acid sequestrants Noncompliance GI tolerability Reduced absorption of lipid-soluble vitamins May increase TG in patients with hypertriglyceridemia w. Plant stanol and sterol esters Lack of selectivity Some patients may find difficult to incorporate into diet May reduce absorption of lipid-soluble vitamins
 Ezetimibe — Localizes at Brush Border of Small Intestine w. Ezetimibe, a selective cholesterol absorption inhibitor, localizes and appears to act at the brush border of the small intestine and inhibits cholesterol absorption w. This results in A decrease in the delivery of intestinal cholesterol to the liver A reduction of hepatic cholesterol stores and an increase in clearance of cholesterol from the blood
 Ezetimibe and Statins Complementary Mechanisms w Ezetimibe reduces the delivery of cholesterol to the liver w Statins reduce cholesterol synthesis in the liver w The distinct mechanism of ezetimibe is complementary to that of statins w The effects of ezetimibe, either alone or in addition to a statin, on cardiovascular morbidity or mortality have not been established Knopp RH. N Engl J Med. 1999; 341: 498– 511.
 SIMVA 10 mg (n = 12)") Coadministration: Simvastatin + Ezetimibe Placebo (n = 11) SIMVA 10 mg (n = 12) Mean Percent Change in LDL-C From Baseline 0 -10 SIMVA 10+ EZE 10 mg (n = 11) -3. 2 -20 -34. 9* -40 -50 -60 *P < 0. 01 vs placebo †P < 0. 01 vs simvastatin 10 mg Stein, E. Eur Heart J. 2001; 3(suppl E): E 14. 17% -51. 9*†
Coadministration: Simvastatin + Ezetimibe Placebo (n = 11) SIMVA 10 mg (n = 12) Mean Percent Change in LDL-C From Baseline 0 -10 SIMVA 10+ EZE 10 mg (n = 11) -3. 2 -20 -34. 9* -40 -50 -60 *P < 0. 01 vs placebo †P < 0. 01 vs simvastatin 10 mg Stein, E. Eur Heart J. 2001; 3(suppl E): E 14. 17% -51. 9*†