2f4526a645e657cd659eb26a95b9d2eb.ppt
- Количество слайдов: 30
 Network Monitoring Prof. Choong Seon HONG Kyung Hee University 1
 Network Monitoring q Access to monitored information How to define monitoring information, and how to get that information from a resource to a manager q Design of monitoring mechanisms How best to obtain information from resources q Application of monitored information How the monitored information is used in various management functional areas Kyung Hee University 2
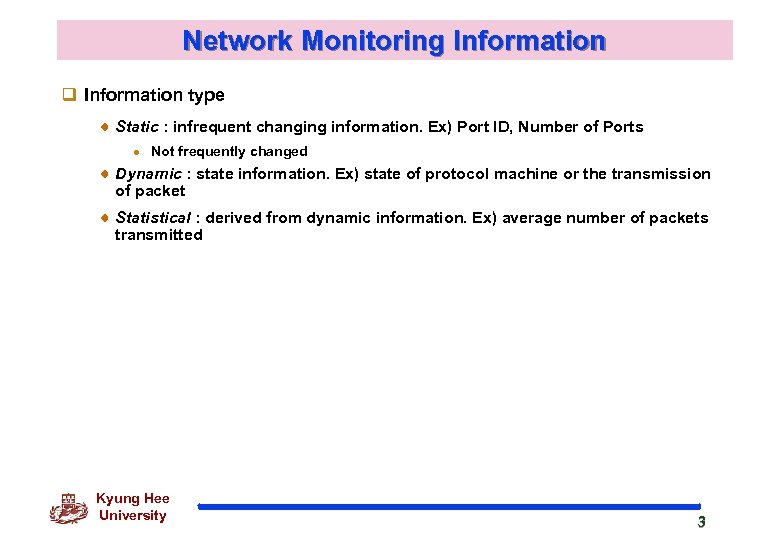 Network Monitoring Information q Information type Static : infrequent changing information. Ex) Port ID, Number of Ports l Not frequently changed Dynamic : state information. Ex) state of protocol machine or the transmission of packet Statistical : derived from dynamic information. Ex) average number of packets transmitted Kyung Hee University 3
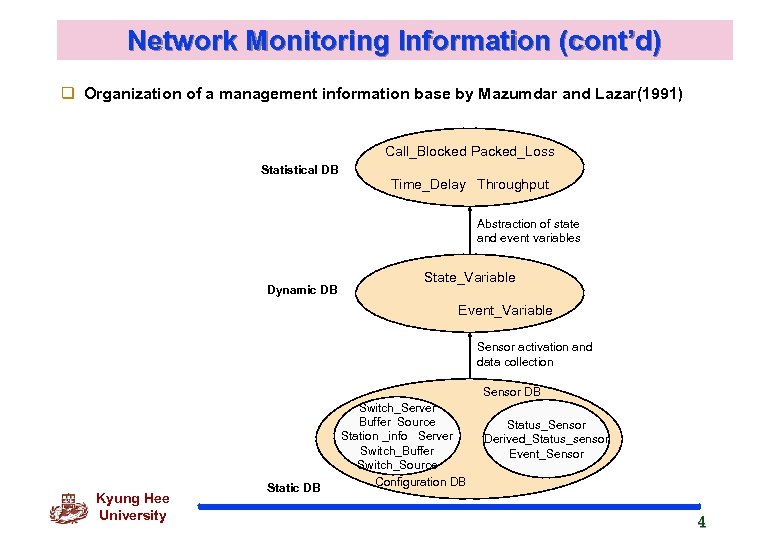 Network Monitoring Information (cont’d) q Organization of a management information base by Mazumdar and Lazar(1991) Call_Blocked Packed_Loss Statistical DB Time_Delay Throughput Abstraction of state and event variables Dynamic DB State_Variable Event_Variable Sensor activation and data collection Sensor DB Kyung Hee University Static DB Switch_Server Buffer Source Station _info Server Switch_Buffer Switch_Source Configuration DB Status_Sensor Derived_Status_sensor Event_Sensor 4
 Network monitoring configurations q Monitoring application : visible to user such as performance monitoring, fault monitoring and accounting monitoring q Manager function : having basic monitoring function q Agent function : gathering and recording management information from one or more elements, and communicate with monitor q Managed objects : management information that represents resources and their activities q Monitoring agent : generating summaries and statistical analyses of management information Kyung Hee University 5
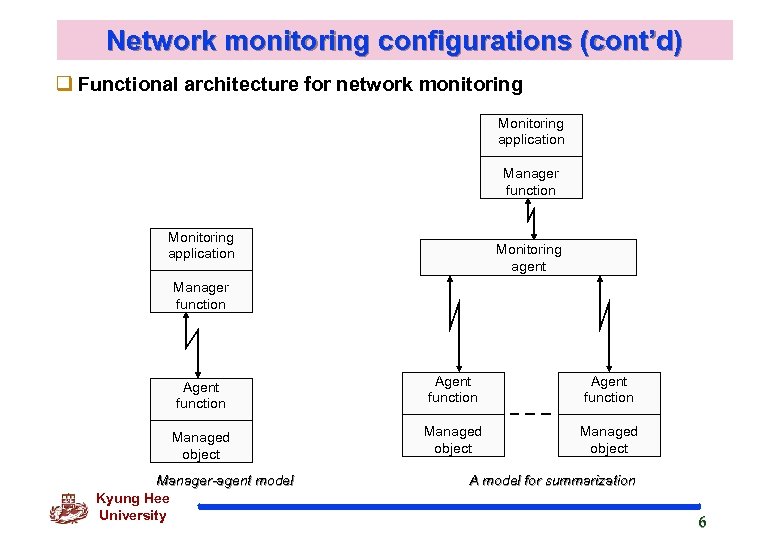 Network monitoring configurations (cont’d) q Functional architecture for network monitoring Monitoring application Manager function Monitoring application Monitoring agent Manager function Agent function Managed object Manager-agent model Kyung Hee University A model for summarization 6
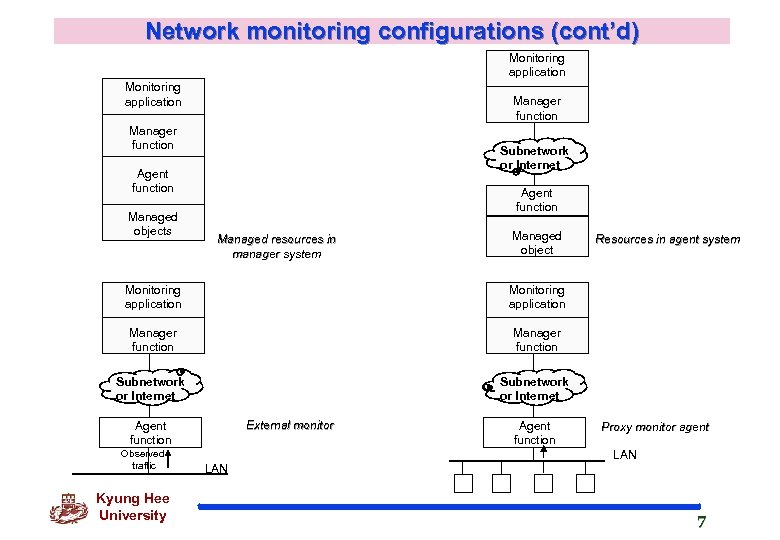 Network monitoring configurations (cont’d) Monitoring application Manager function Subnetwork or Internet Agent function Managed objects Agent function Managed resources in manager system Managed object Monitoring application Manager function Subnetwork or Internet Resources in agent system Subnetwork or Internet External monitor Agent function Observed traffic Kyung Hee University LAN Agent function Proxy monitor agent LAN 7
 Polling and event reporting q Information is collected and stored by agents and it is used by multiple managers q Two techniques to make the information polling : request-response interaction between a manager and agent l l querying any agent and requesting the values of various information elements agent responding with information from its MIB event reporting : initiative with the agent and the manager with the role of a listener l giving current status of agent to manager l preconfigurable reporting period or settable by manger l l generating a report when a significant event (ex, a change of state or an unusual event (ex. , fault) more efficient than polling for monitoring object whose states or values change relatively infrequently Kyung Hee University 8
 Polling and event reporting (cont’d) q Telecommunications management system : very high reliance on event reporting q SNMP approach puts very little reliance on event reporting q SNMP and OSI systems management Kyung Hee University 9
 Performance monitoring q Performance indicators absolute prerequisite for the management of telecom network : measuring the performance of the network, or performance monitoring difficulties to choose appropriate indicators because of following: l there are too many indicators in use l the meanings of most indicators are not yet clearly understood l some indicators are introduced and supported some manufacturers only l most indicators are not suitable for comparison with each other l l frequently, the indicators are accurately measured but incorrectly interpreted in many cases, the calculation of indicators takes too much time, and the final results can hardly be used for controlling the environments service-oriented measures (availability, response time, accuracy) and efficiency-oriented measures (throughput, utilization) Kyung Hee University 10
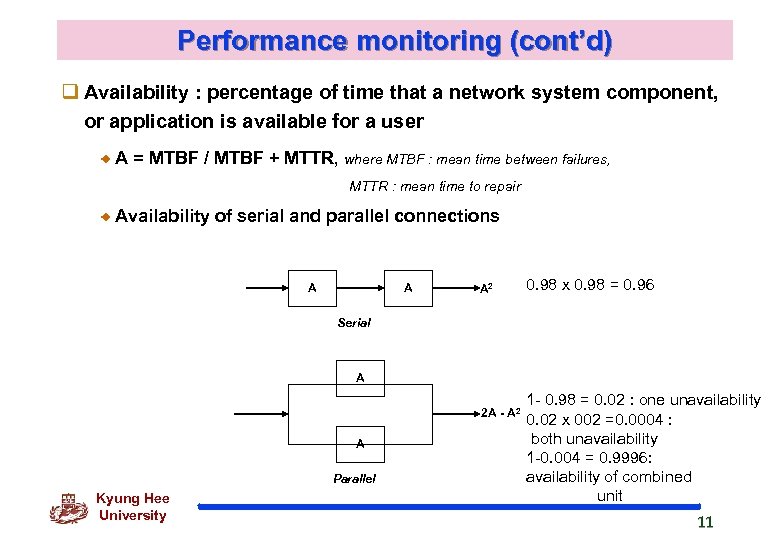 Performance monitoring (cont’d) q Availability : percentage of time that a network system component, or application is available for a user A = MTBF / MTBF + MTTR, where MTBF : mean time between failures, MTTR : mean time to repair Availability of serial and parallel connections A A A 2 0. 98 x 0. 98 = 0. 96 Serial A 2 A - A 2 A Parallel Kyung Hee University 1 - 0. 98 = 0. 02 : one unavailability 0. 02 x 002 =0. 0004 : both unavailability 1 -0. 004 = 0. 9996: availability of combined unit 11
 Performance monitoring (cont’d) q Response time Several studies show that a computer and a user interacts at a pace that neither has to wait on the other l productivity increases significantly l the cost of work drops l quality tends to improve Up to two seconds : it was acceptable for most interactive applications User response time: the time span between the moment a user receives a complete reply to one command enters the next command - referred to as think time System response time: the time span between the moment the user enters a command the moment a complete response is displayed Kyung Hee University 12
 Performance monitoring (cont’d) q Elements related to response time Inbound terminal delay : the delay in getting an inquiry from terminal to the communications line Inbound queuing time : the time required for processing by the controller or PAD device Inbound service time : the time to transmit the communications link and nodes (controller to host’s front-end processor) Processor delay : the time for processing in the front-end processor, the host processor, the disk driver and so on Outbound queuing time : the time a reply spends at a port in the frontend processor waiting to be dispatched to the network. Outbound service time : the time to transmit the communications facility from the host’s front-end processor to the controller. Outbound terminal delay : primarily due to line speed Kyung Hee University 13
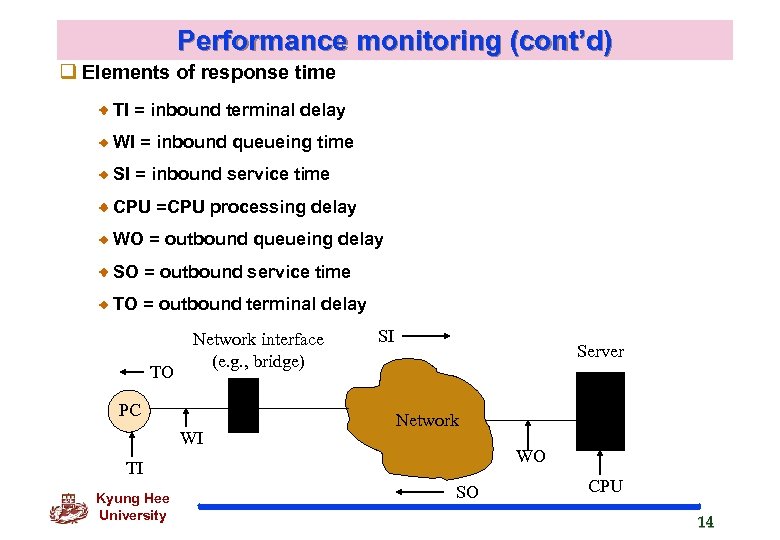 Performance monitoring (cont’d) q Elements of response time TI = inbound terminal delay WI = inbound queueing time SI = inbound service time CPU =CPU processing delay WO = outbound queueing delay SO = outbound service time TO = outbound terminal delay TO Network interface (e. g. , bridge) PC WI SI Server Network WO TI Kyung Hee University SO CPU 14
 Performance monitoring (cont’d) q Accuracy Accurate transmission of data between user and host or between two hosts using error-correction mechanisms in protocol such as the data link and transport protocols generally not user concern rejection rate: the percentage of time the network cannot transfer information because of a lack of resources and performance – > 2% indicates significant problems q Throughput an application-oriented measure l l l the number of transactions of a given type for a certain period of time the number of customer sessions of a given application during a certain period of time the number of calls for a circuit-switched environment Kyung Hee University 15
 Performance monitoring (cont’d) q Goodput the probability or the rate of successfully received packets with no packet loss that causes packet loss at the receiver q Utilization a more fine-grained measure than throughput determining the percentage of time that a resource is in use over a given period of time to search for potential bottlenecks and areas of congestion usually increasing exponentially as the utilization of a resource increases (see figure 2. 10) Kyung Hee University 16
 Performance monitoring (cont’d) q Collecting utilization data On a bridge or router l packet forwarding rate l percentage of dropped frames (on each interface) l number of packets in a queue l processor load On a file server l processor load l disk access rate l NIC utilization Kyung Hee University 17
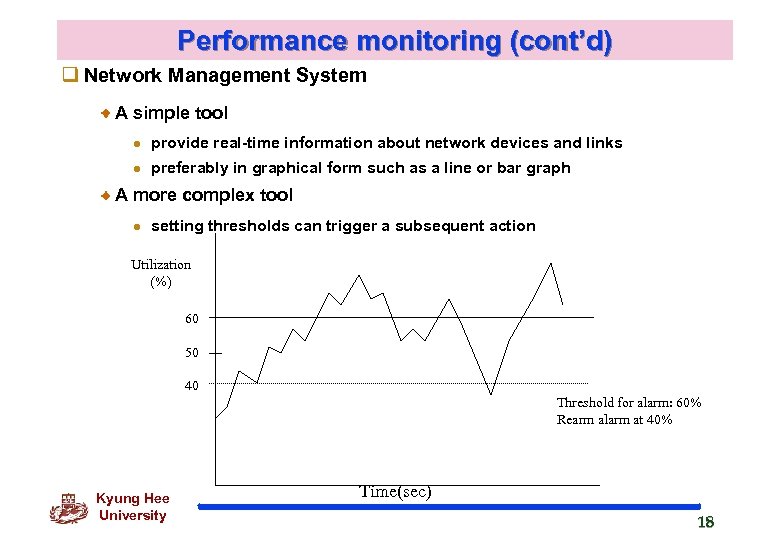 Performance monitoring (cont’d) q Network Management System A simple tool l provide real-time information about network devices and links l preferably in graphical form such as a line or bar graph A more complex tool l setting thresholds can trigger a subsequent action Utilization (%) 60 50 40 Threshold for alarm: 60% Rearm alarm at 40% Kyung Hee University Time(sec) 18
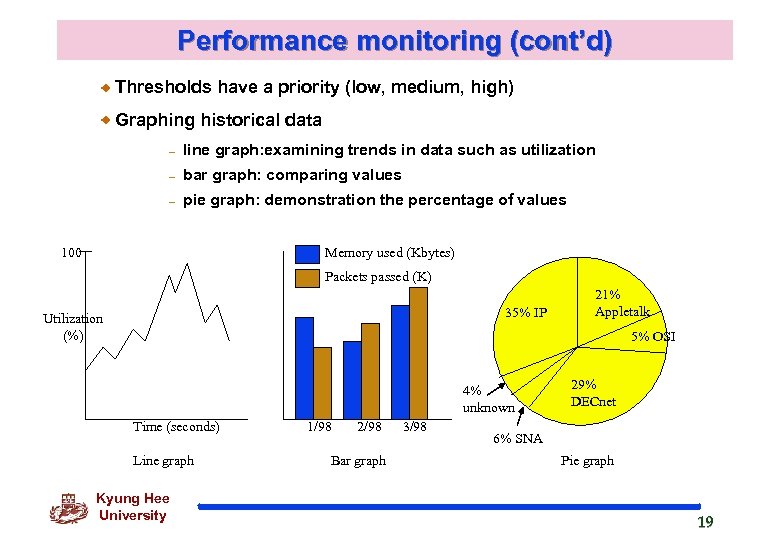 Performance monitoring (cont’d) Thresholds have a priority (low, medium, high) Graphing historical data – line graph: examining trends in data such as utilization – bar graph: comparing values – pie graph: demonstration the percentage of values 100 Memory used (Kbytes) Packets passed (K) 35% IP Utilization (%) 21% Appletalk 5% OSI 4% unknown Time (seconds) Line graph Kyung Hee University 1/98 2/98 Bar graph 3/98 29% DECnet 6% SNA Pie graph 19
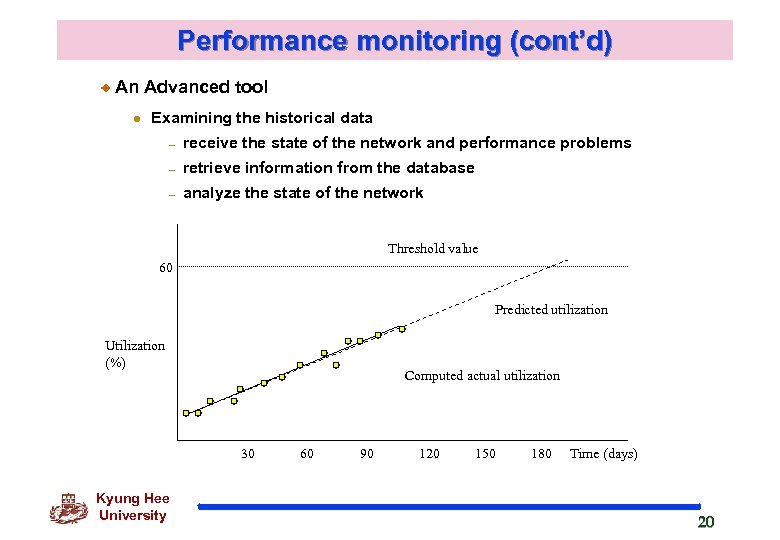 Performance monitoring (cont’d) An Advanced tool l Examining the historical data – receive the state of the network and performance problems – retrieve information from the database – analyze the state of the network Threshold value 60 Predicted utilization Utilization (%) Computed actual utilization 30 Kyung Hee University 60 90 120 150 180 Time (days) 20
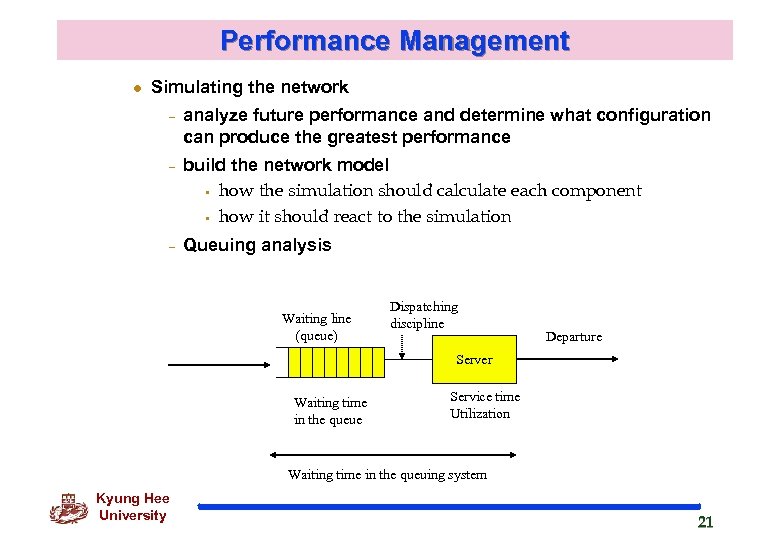 Performance Management l Simulating the network – – – analyze future performance and determine what configuration can produce the greatest performance build the network model • how the simulation should calculate each component • how it should react to the simulation Queuing analysis Waiting line (queue) Dispatching discipline Departure Server Waiting time in the queue Service time Utilization Waiting time in the queuing system Kyung Hee University 21
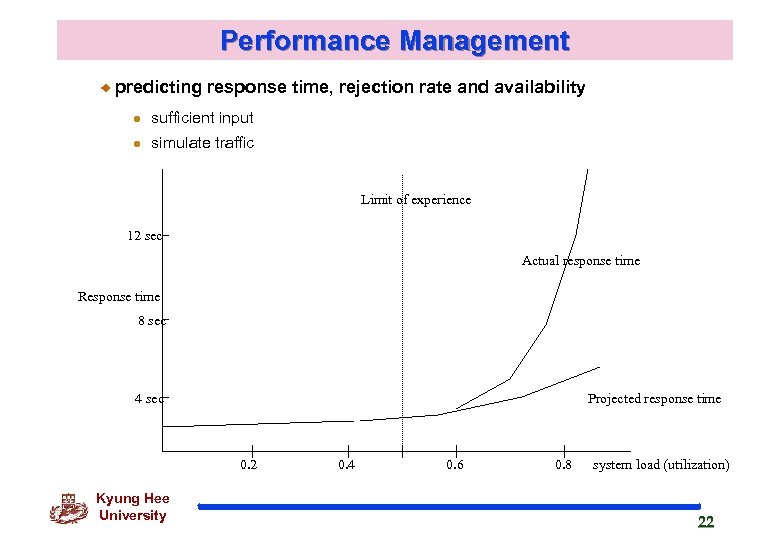 Performance Management predicting response time, rejection rate and availability l sufficient input l simulate traffic Limit of experience 12 sec Actual response time Response time 8 sec 4 sec Projected response time 0. 2 Kyung Hee University 0. 4 0. 6 0. 8 system load (utilization) 22
 Performance Management q Reporting performance information text reports are the most common way l utilization and error rates l network devices and links data in either a graphical format or on a bitmapped display Kyung Hee University 23
 Fault Management q Problems of Fault Monitoring Fault observation l l l unobservable faults (e. g. the existence of deadlock) partially observable faults (e. g. failure of some low-level protocol in an attached device) uncertainty in observation (e. g. Lack of response) Fault diagnosis l multiple potential causes l too many related observation l interference between diagnosis and local recovery l absence of automated testing tools Kyung Hee University 24
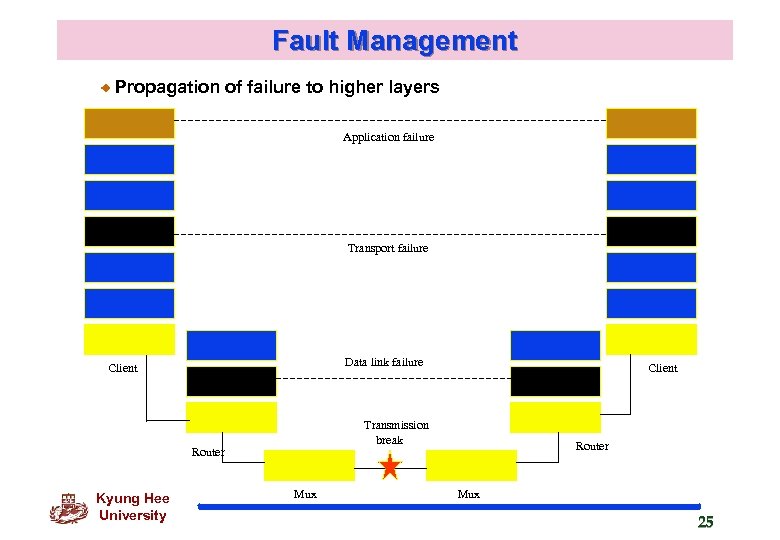 Fault Management Propagation of failure to higher layers Application failure Transport failure Data link failure Client Transmission break Router Kyung Hee University Client Mux Router Mux 25
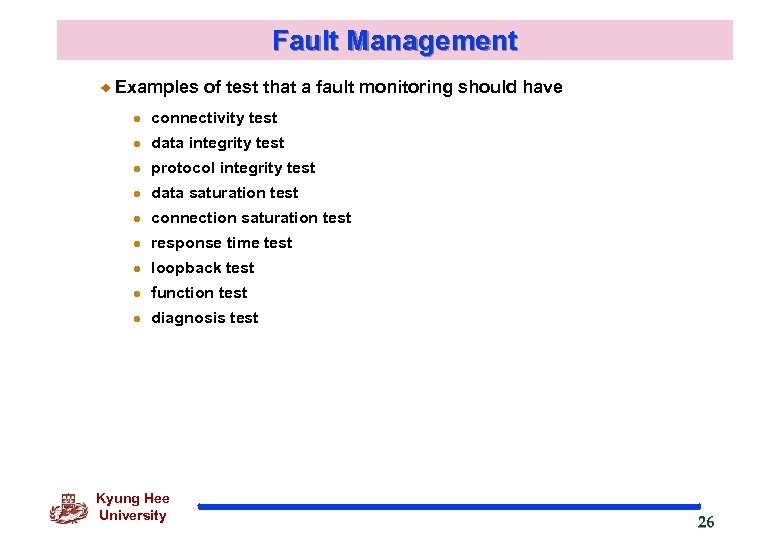 Fault Management Examples of test that a fault monitoring should have l connectivity test l data integrity test l protocol integrity test l data saturation test l connection saturation test l response time test l loopback test l function test l diagnosis test Kyung Hee University 26
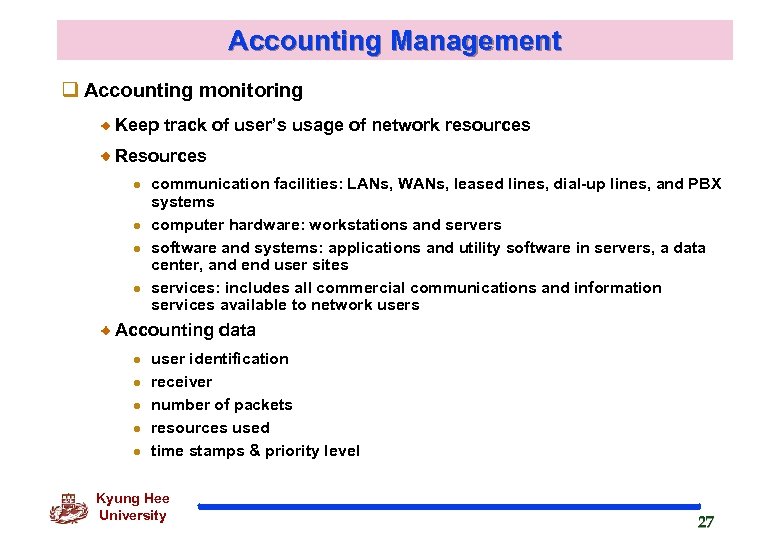 Accounting Management q Accounting monitoring Keep track of user’s usage of network resources Resources l l communication facilities: LANs, WANs, leased lines, dial-up lines, and PBX systems computer hardware: workstations and servers software and systems: applications and utility software in servers, a data center, and end user sites services: includes all commercial communications and information services available to network users Accounting data l l l user identification receiver number of packets resources used time stamps & priority level Kyung Hee University 27
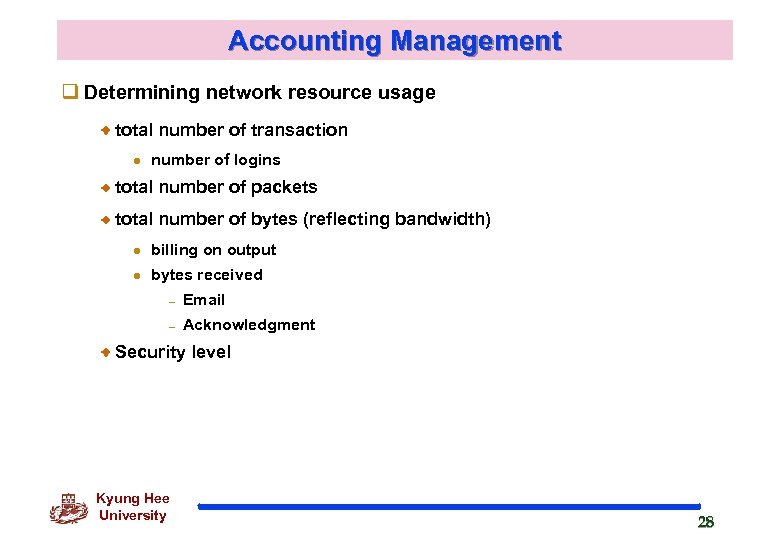 Accounting Management q Determining network resource usage total number of transaction l number of logins total number of packets total number of bytes (reflecting bandwidth) l billing on output l bytes received – Email – Acknowledgment Security level Kyung Hee University 28
 Accounting Management q Accomplishing Accounting Management Gathering data about the utilization of network resources Using metrics to help set usage quotas Billing users for their network use q Metrics and Quotas SNMP l RFC 1272 “Internet Accounting Background” l define services to be metered and usage reporting l define the types of information necessary at various layers Metrics work with quotas q Billing One-time installation fee Monthly fee Fee based on amount of network resources consumed Kyung Hee University 29
 Accounting Management q Network management system A simple tool l l monitor for metrics that exceed quotas report that data A more complex tool l l perform network billing determine where to poll for billing information An advanced tool l forecast the need for network resources establish reasonable metrics and quotas predict their billing costs q Reporting real-time display: the current value of a metric text reports: historical accounting and billing information Kyung Hee University 30


