9638d945c088c3fd7809346927a9eebb.ppt
- Количество слайдов: 121
Network Management Tools Presentations Tuesday, September 18 th & 25 th, 2007 CSE 552 – Network Management Fall 2007 (Term 071) Assignment 2
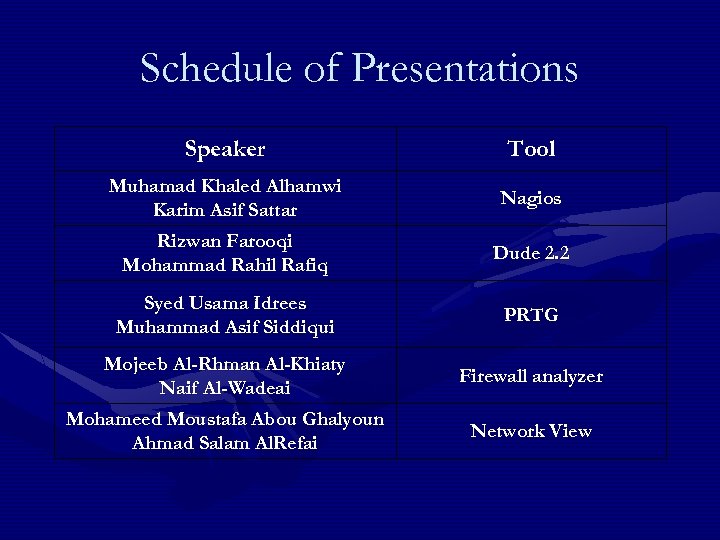
Schedule of Presentations Speaker Tool Muhamad Khaled Alhamwi Karim Asif Sattar Nagios Rizwan Farooqi Mohammad Rahil Rafiq Dude 2. 2 Syed Usama Idrees Muhammad Asif Siddiqui PRTG Mojeeb Al-Rhman Al-Khiaty Naif Al-Wadeai Firewall analyzer Mohameed Moustafa Abou Ghalyoun Ahmad Salam Al. Refai Network View
NM Tool (Nagios) CSE-552 Assignment#2 Karim Asif Sattar Muhamad Khaled Alhamwi
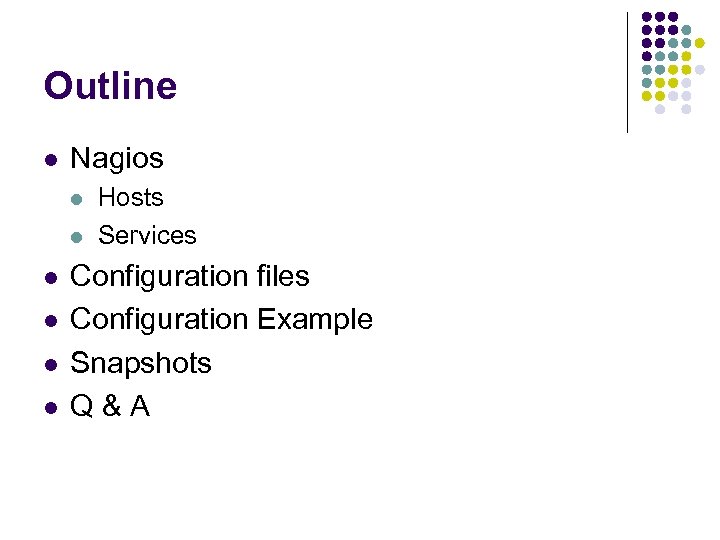
Outline l Nagios l l l Hosts Services Configuration files Configuration Example Snapshots Q&A
Nagios l l l Free & open-source network management tool Run under Linux Has web interface l l l Can be viewed remotely Can be used to monitor your host and services Very flexible l Many plug-ins and add-ons
Nagios – cont’ l l l Not SNMP-based NM tool Monitor Windows & Linux hosts Monitor any service l l Monitor public services l l You just need to write the appropriate plug-in HTTP, DNS, Email Monitor private services with the help of other add-ons l CPU, Memory, and Disk usage
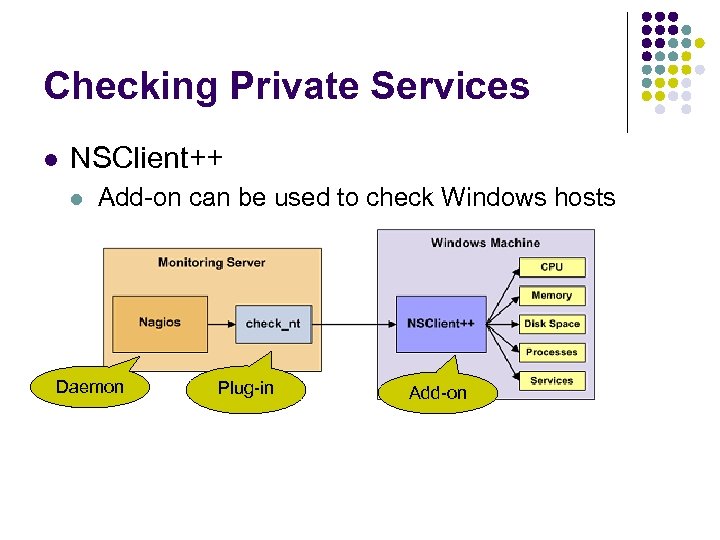
Checking Private Services l NSClient++ l Add-on can be used to check Windows hosts Daemon Plug-in Add-on
Hosts l Hosts can be defined with parent-child relation l l l Useful to reflect the real topology Hosts can be grouped in different groups Monitored host has several possible states l l l UP – The host is up and running DOWN – The host is not responding UNREACHABLE – The host can not be reached because some other host in between is down
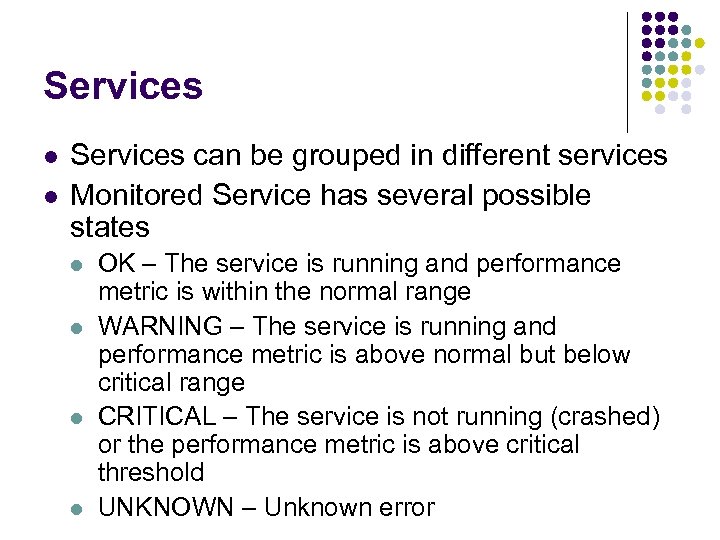
Services l l Services can be grouped in different services Monitored Service has several possible states l l OK – The service is running and performance metric is within the normal range WARNING – The service is running and performance metric is above normal but below critical range CRITICAL – The service is not running (crashed) or the performance metric is above critical threshold UNKNOWN – Unknown error
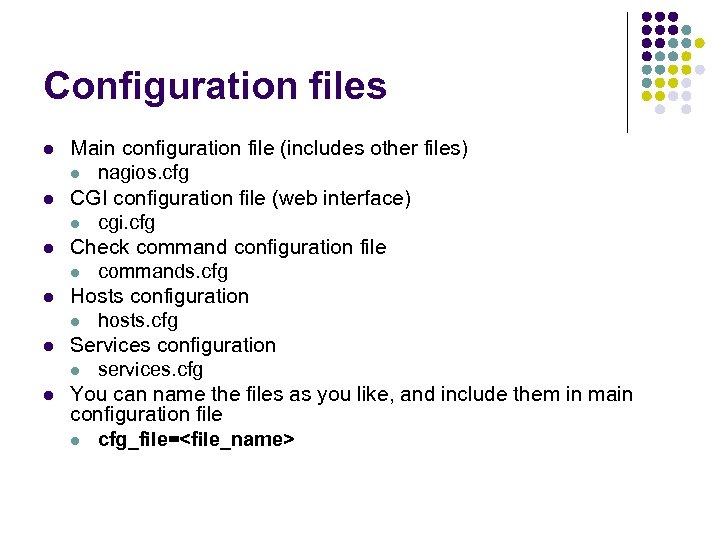
Configuration files l l l Main configuration file (includes other files) l nagios. cfg CGI configuration file (web interface) l cgi. cfg Check command configuration file l commands. cfg Hosts configuration l hosts. cfg Services configuration l services. cfg You can name the files as you like, and include them in main configuration file l cfg_file=<file_name>
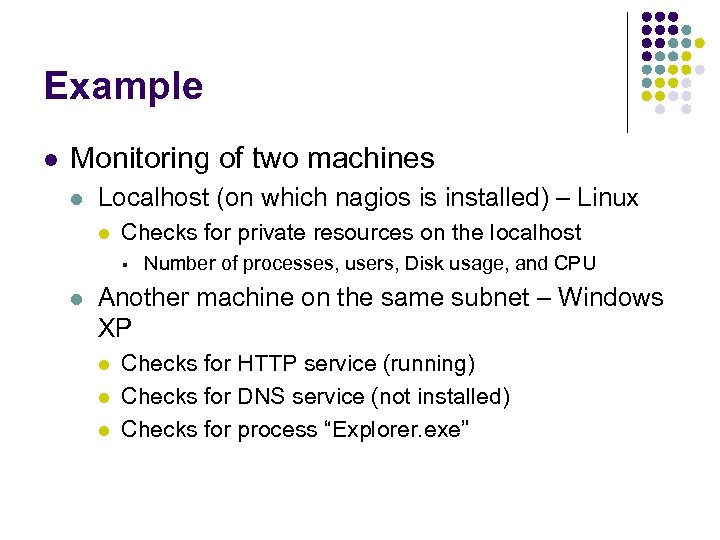
Example l Monitoring of two machines l Localhost (on which nagios is installed) – Linux l Checks for private resources on the localhost § l Number of processes, users, Disk usage, and CPU Another machine on the same subnet – Windows XP l l l Checks for HTTP service (running) Checks for DNS service (not installed) Checks for process “Explorer. exe”
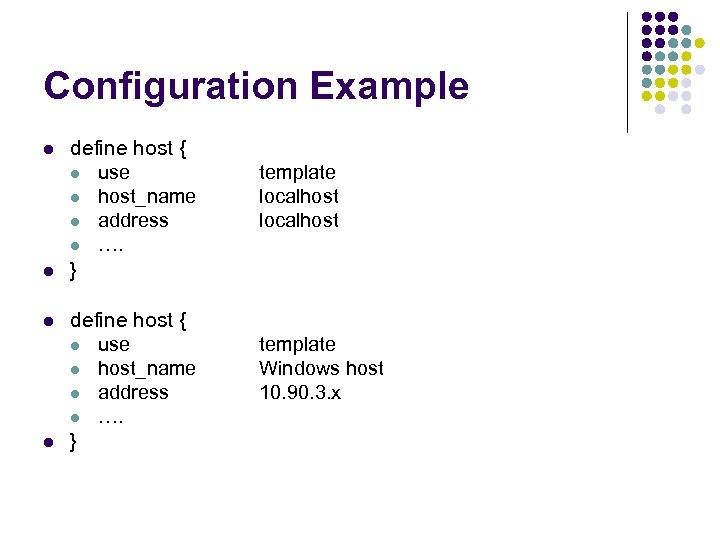
Configuration Example l l define host { l use l host_name l address l …. } template localhost template Windows host 10. 90. 3. x
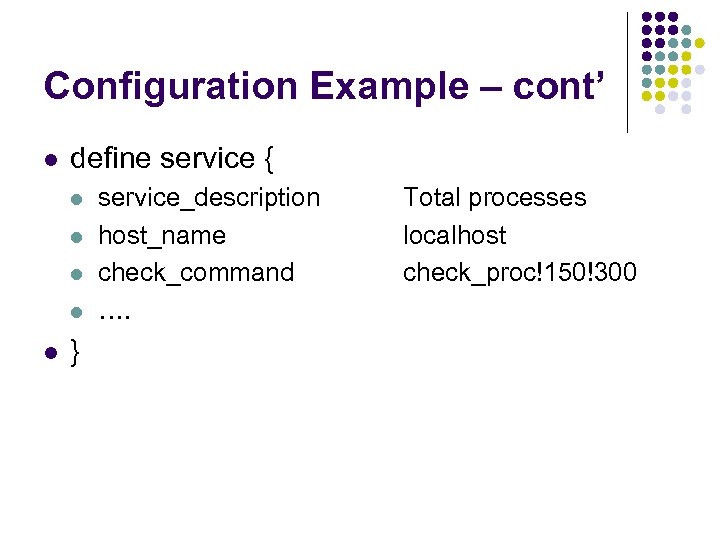
Configuration Example – cont’ l define service { l l l } service_description host_name check_command …. Total processes localhost check_proc!150!300
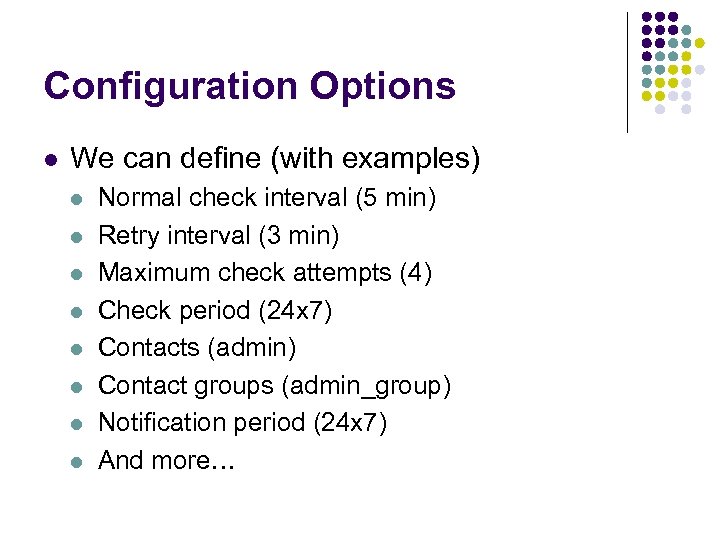
Configuration Options l We can define (with examples) l l l l Normal check interval (5 min) Retry interval (3 min) Maximum check attempts (4) Check period (24 x 7) Contacts (admin) Contact groups (admin_group) Notification period (24 x 7) And more…
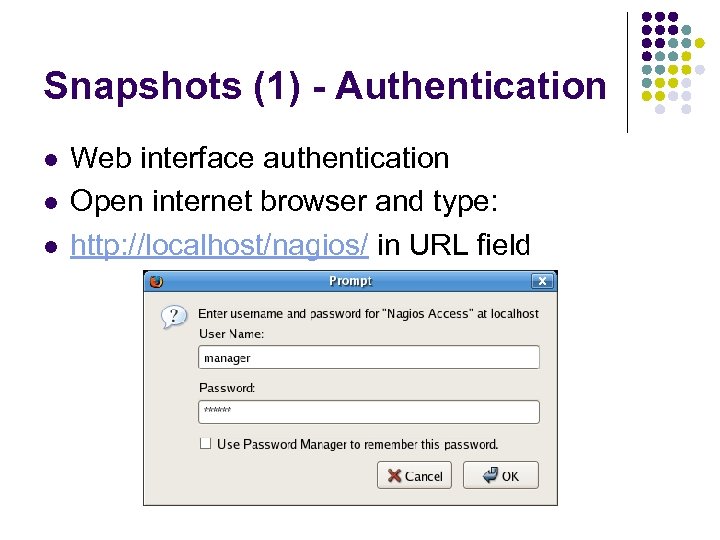
Snapshots (1) - Authentication l l l Web interface authentication Open internet browser and type: http: //localhost/nagios/ in URL field
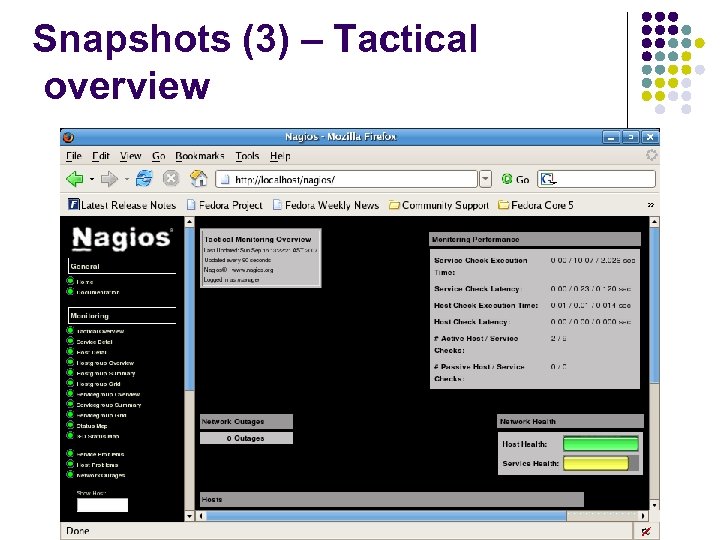
Snapshots (3) – Tactical overview
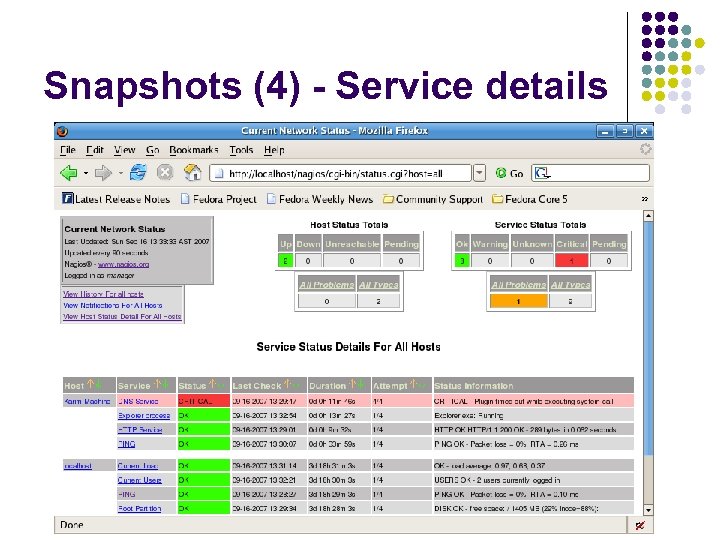
Snapshots (4) - Service details
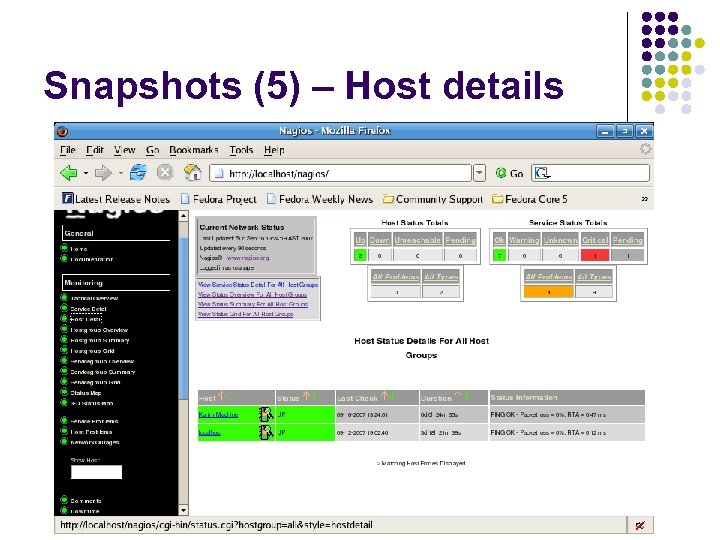
Snapshots (5) – Host details
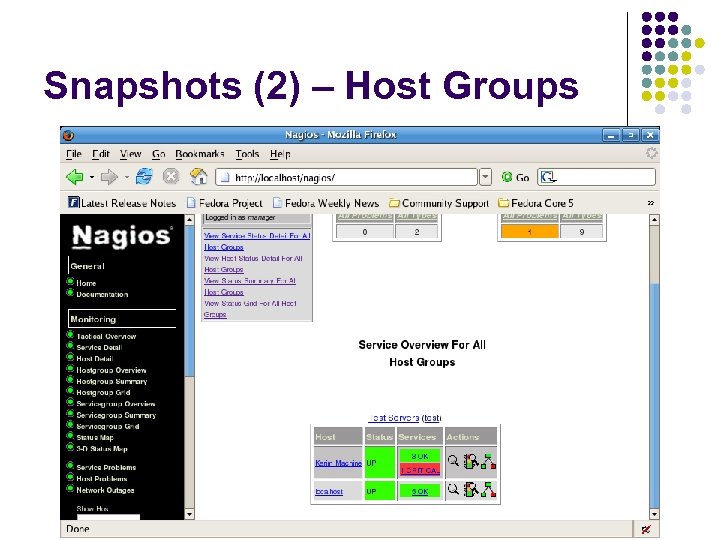
Snapshots (2) – Host Groups
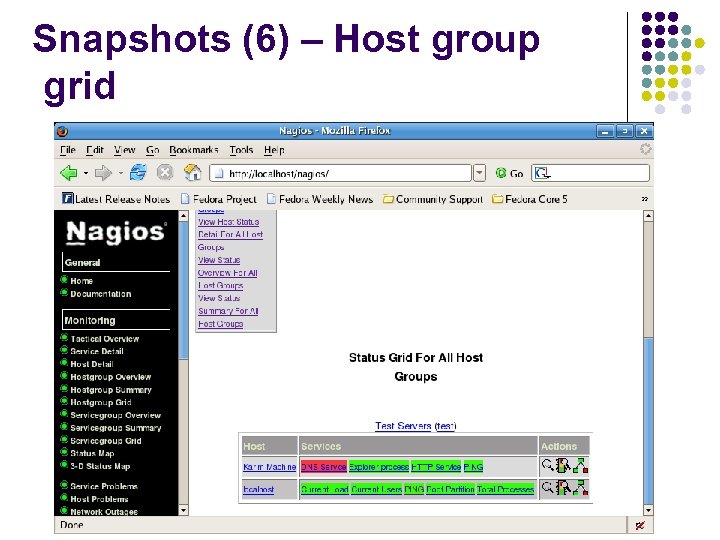
Snapshots (6) – Host group grid
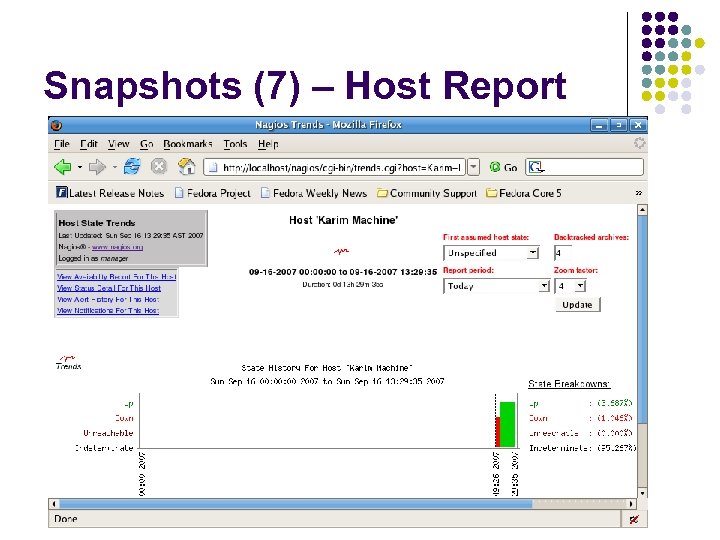
Snapshots (7) – Host Report

Thank you l Q&A

The Dude Network Management Tool Presentation CSE-552 Network Management Term 071 By M. M. Rizwan Farooqi (250501) Mohammad Rahil Rafiq (260308)
Overview Introduction System Requirements Features Modes of Operation Interface Layout Logs Probes Snapshots Pros. & Cons. Conclusion References Q&A
Introduction Network monitoring tool that incorporates map of the network layout It helps you visualize the structure of your network It also provides direct access to network functions specific to each item. It can automatically discover your local network and draw a preliminary layout that can be further customized and saved.
System Requirements RAM: minimum - 64 MB, recommended minimum - 128 MB OS: Windows 2000/XP (does not work with Windows 95/98/Me) with Administrator permissions Video: at least 800 x 600 resolution
Features Supports various network monitoring tasks from simple ping checks to port probes and service checks. Individual Link usage monitoring and graphs. Direct access to remote control tools for device management. Helps in checking bandwidth to a device or monitor its traffic in real-time.
Features Contd. . Automatically detects any existing subnets and begins scanning them. Detected devices are then probed to determine which IP-based services are supported (like Net. BIOS, HTTP, FTP, etc. ), Additional probes for any services can also be configured. After discovery process, the results are plotted as icons on a map grid including which of its services are up, down, or unstable.
Features Contd. . How long to wait before timing out a device Which services are polled on which devices Window layout is stored on the server rather than the client, so everything set up on the server can be viewed from multiple clients.
Features Contd. . Supports remote Dude server and local clients. Supports SNMP, ICMP, DNS and TCP monitoring for devices that support it. Easy installation Runs on Linux, Mac OS, and Windows. Best price/value ratio compared to other products (free of charge).
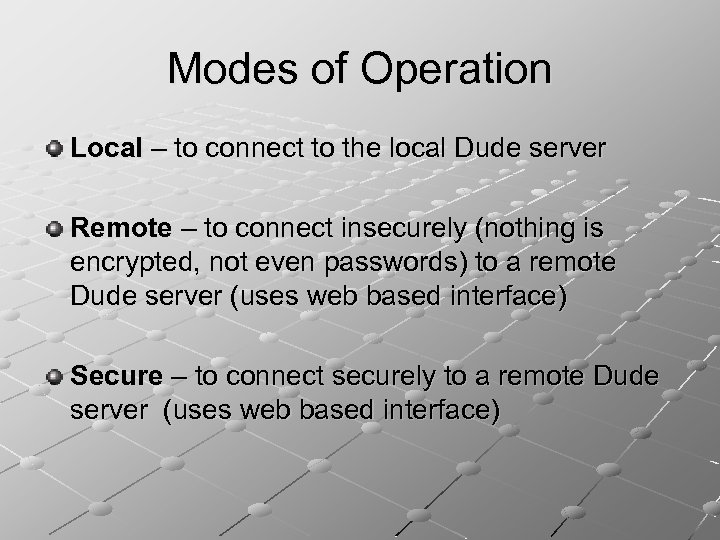
Modes of Operation Local – to connect to the local Dude server Remote – to connect insecurely (nothing is encrypted, not even passwords) to a remote Dude server (uses web based interface) Secure – to connect securely to a remote Dude server (uses web based interface)
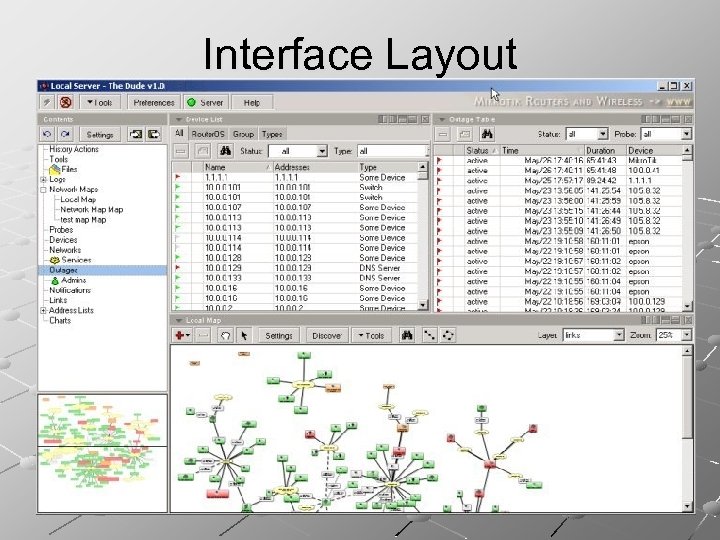
Interface Layout
Logs Debug – shows all changes happening in the system Action – lists manual operations performed by an administrator (for example, device add/remove events) Event – stores network events (for example, information about failing services)
Probes ICMP – regular ping. TCP – a test, which opens a regular TCP connection to a given port. DNS – probe the given UDP port (usually, 53) with a valid DNS request for the given domain name. SNMP – check the specified OID( Object Identifier).
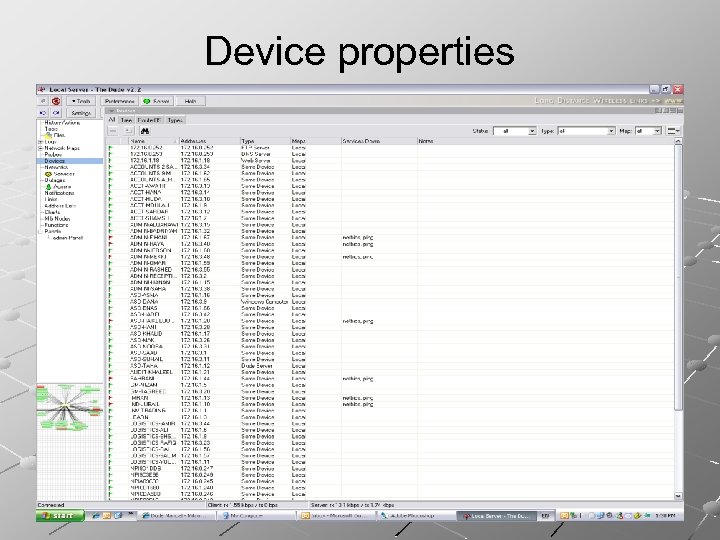
Device properties
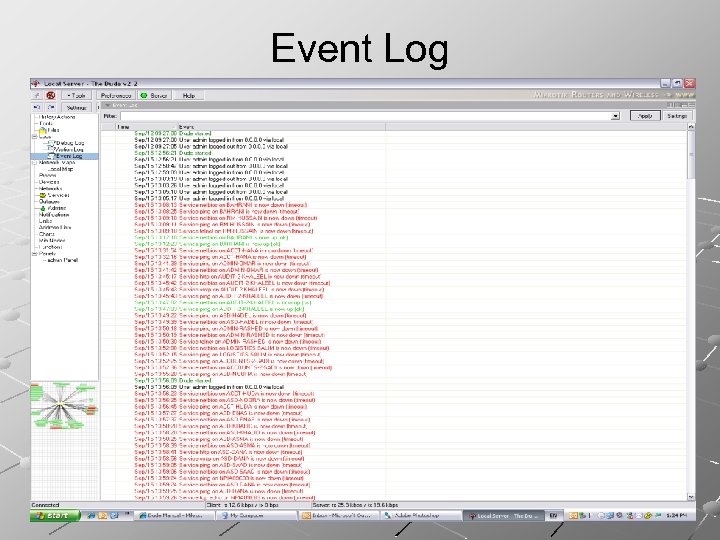
Event Log
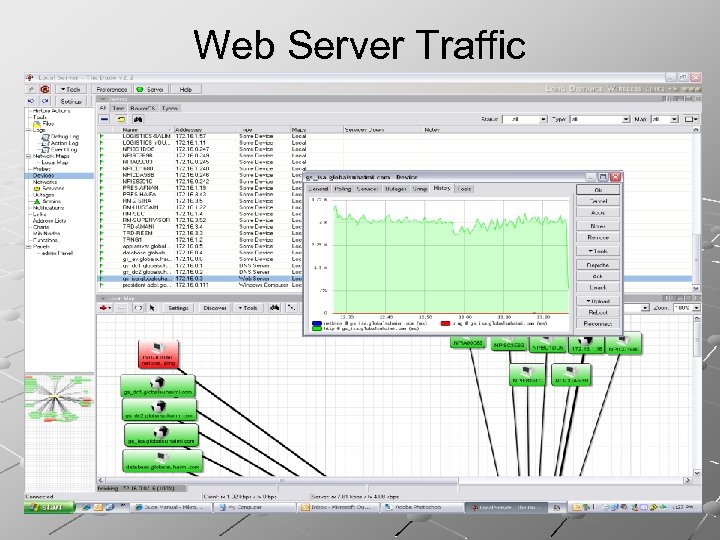
Web Server Traffic
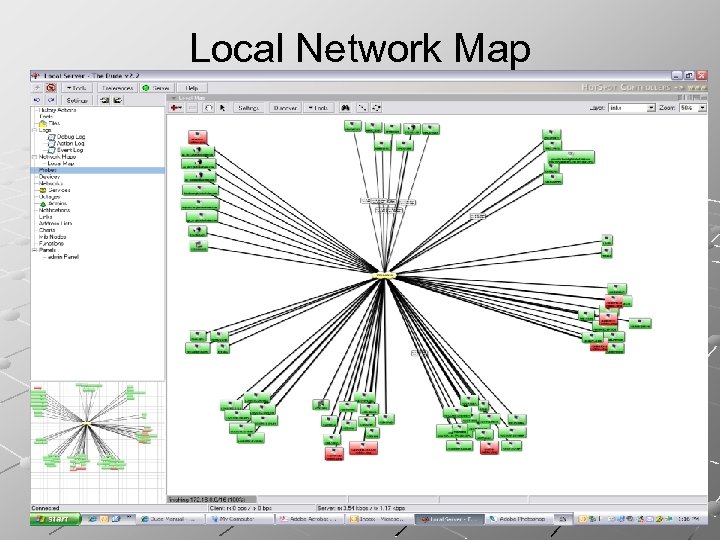
Local Network Map
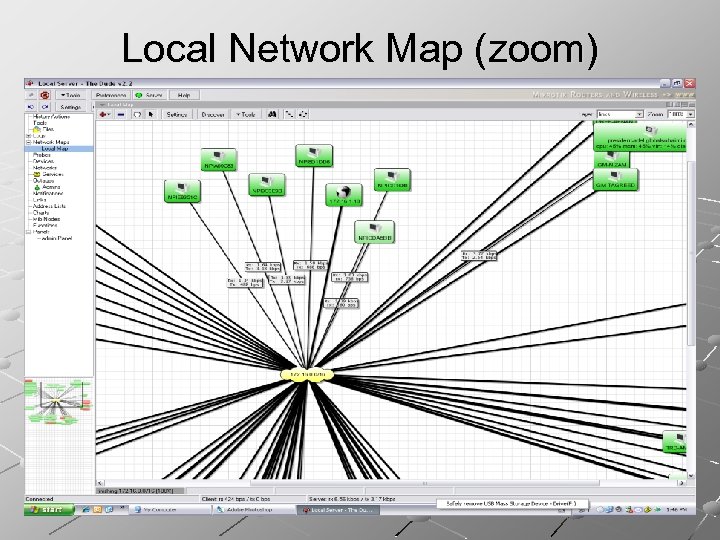
Local Network Map (zoom)
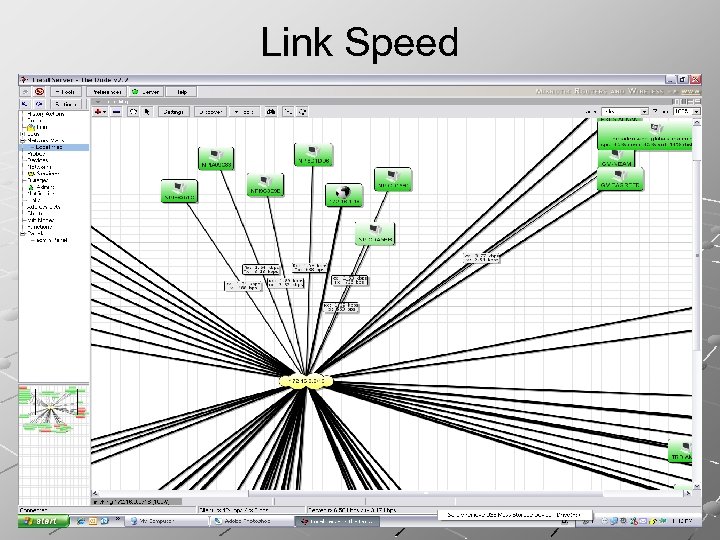
Link Speed
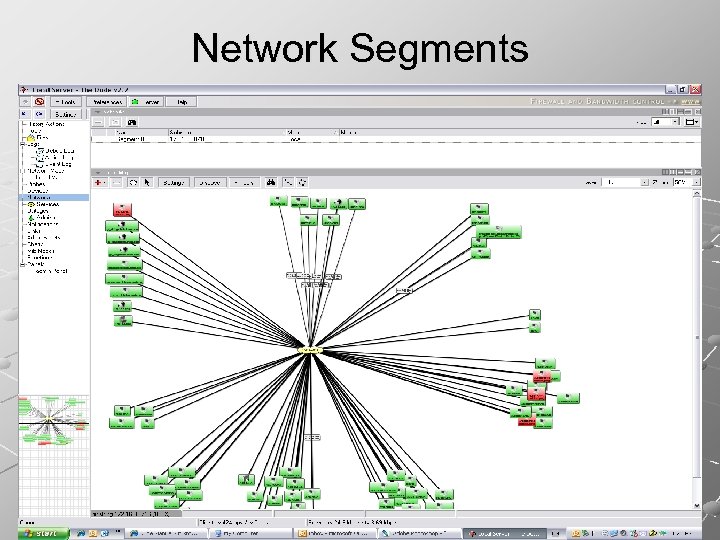
Network Segments
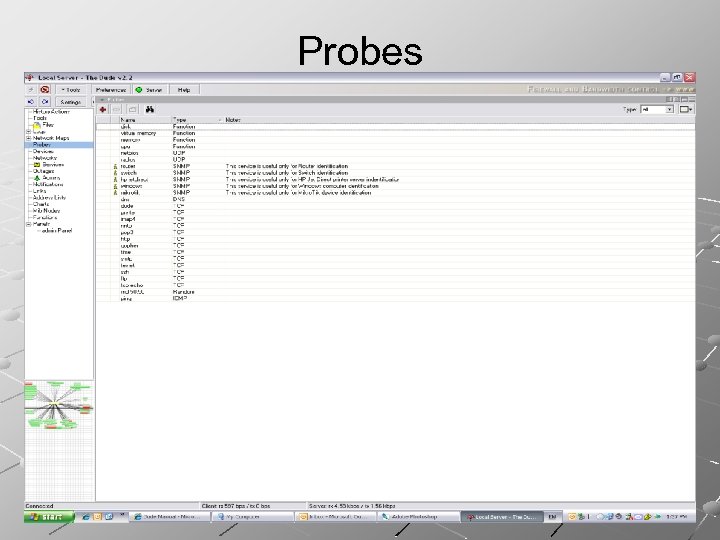
Probes
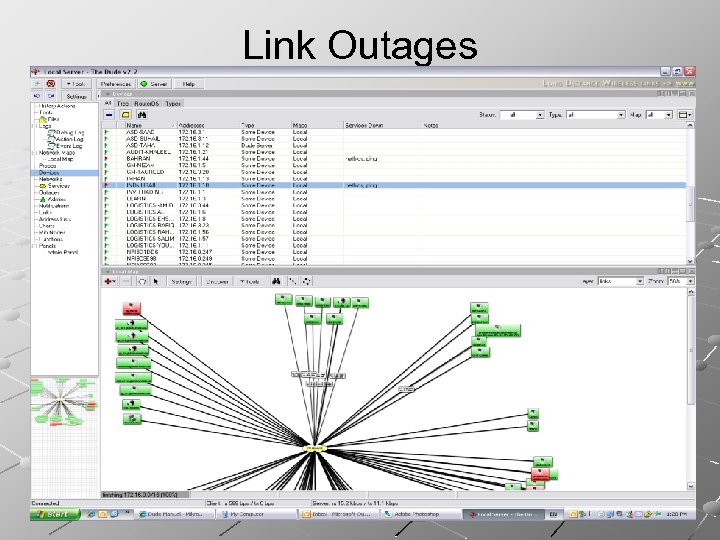
Link Outages
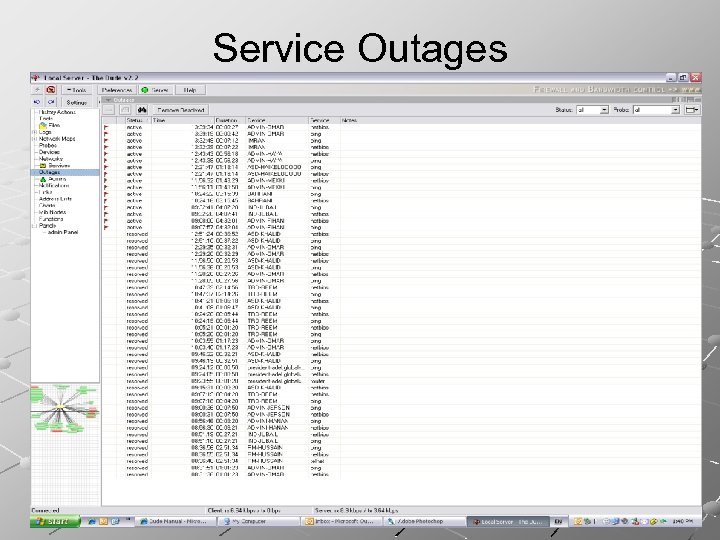
Service Outages
Device Up/Down time
Pros: Freeware Lots of customizable options Useful network mapping features Separate Client & Server Uses ftp, http, Net. BIOS & ping, SNMP Export and Import in PNG & PDF format Email, popup and beep alerts Secure remote login
Cons: Rather unintuitive user interface Device alerts not turned on by default Minimal and out of date documentation Web based interface not comprehensive compared to its windows based client
Conclusion Good Freeware Cannot work if firewall is enabled. Separate client and server No support Server logout - Dude service closes
References http: //wiki. mikrotik. com/wiki/Dude_usage_ notes#Device_Representation http: //www. steveatwal. com/the-dude-freenetwork-diagramming-tool/ http: //www. smallbusinesscomputing. com/ webmaster/article. php/3692871

Q&A

Thank you
PRTG ( Paessler Router Traffic Grapher ) By: Muhammad Asif Siddiqui & Syed Usama Idrees May 24, 2007 PRTG (Paessler Router Traffic Grapher) MSR – A Comparative Analysis 52
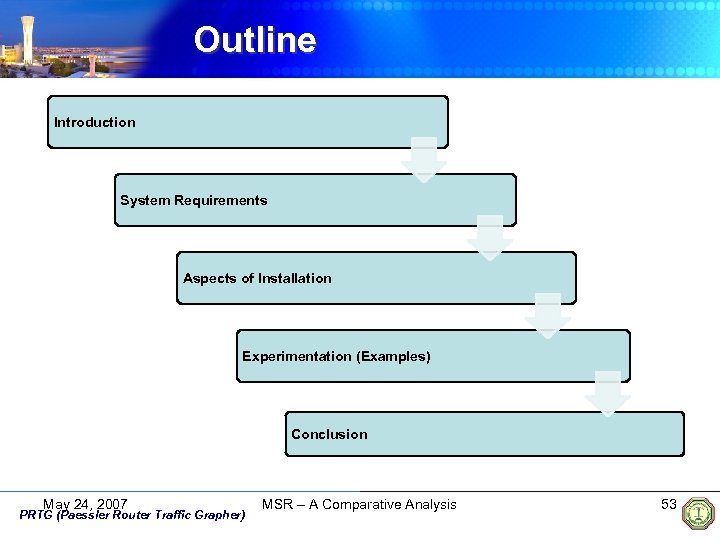
Outline Introduction System Requirements Aspects of Installation Experimentation (Examples) Conclusion May 24, 2007 PRTG (Paessler Router Traffic Grapher) MSR – A Comparative Analysis 53
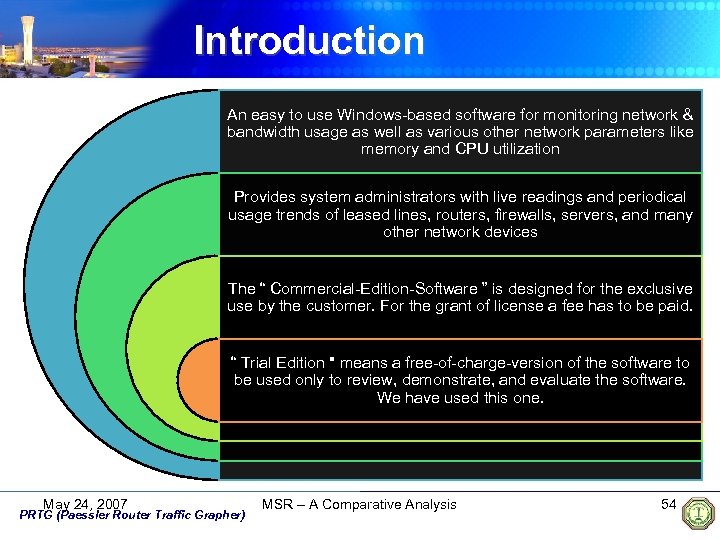
Introduction An easy to use Windows-based software for monitoring network & bandwidth usage as well as various other network parameters like memory and CPU utilization Provides system administrators with live readings and periodical usage trends of leased lines, routers, firewalls, servers, and many other network devices The “ Commercial-Edition-Software ” is designed for the exclusive use by the customer. For the grant of license a fee has to be paid. “ Trial Edition " means a free-of-charge-version of the software to be used only to review, demonstrate, and evaluate the software. We have used this one. May 24, 2007 PRTG (Paessler Router Traffic Grapher) MSR – A Comparative Analysis 54
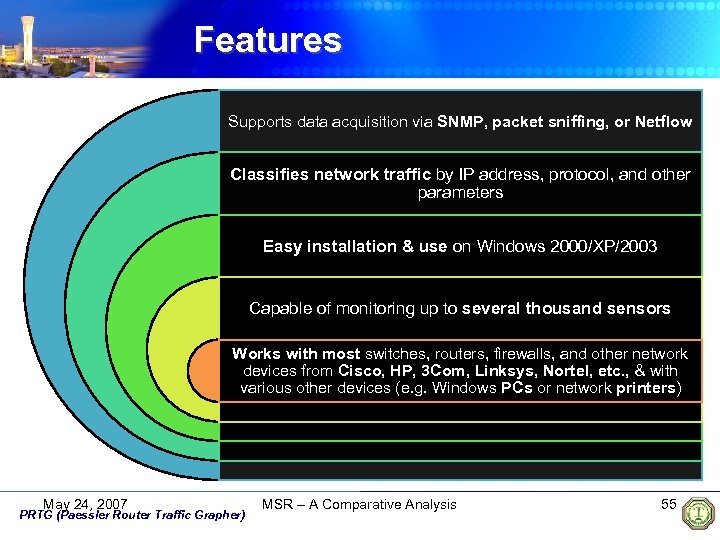
Features Supports data acquisition via SNMP, packet sniffing, or Netflow Classifies network traffic by IP address, protocol, and other parameters Easy installation & use on Windows 2000/XP/2003 Capable of monitoring up to several thousand sensors Works with most switches, routers, firewalls, and other network devices from Cisco, HP, 3 Com, Linksys, Nortel, etc. , & with various other devices (e. g. Windows PCs or network printers) May 24, 2007 PRTG (Paessler Router Traffic Grapher) MSR – A Comparative Analysis 55
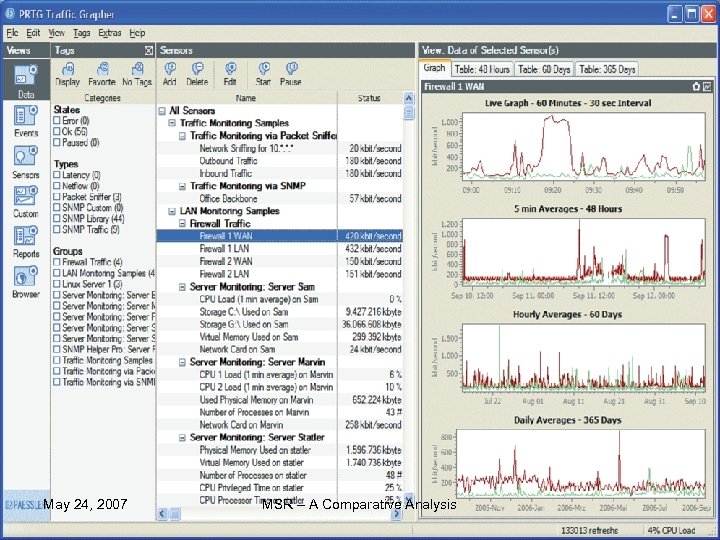
… continued May 24, 2007 PRTG (Paessler Router Traffic Grapher) MSR – A Comparative Analysis 56
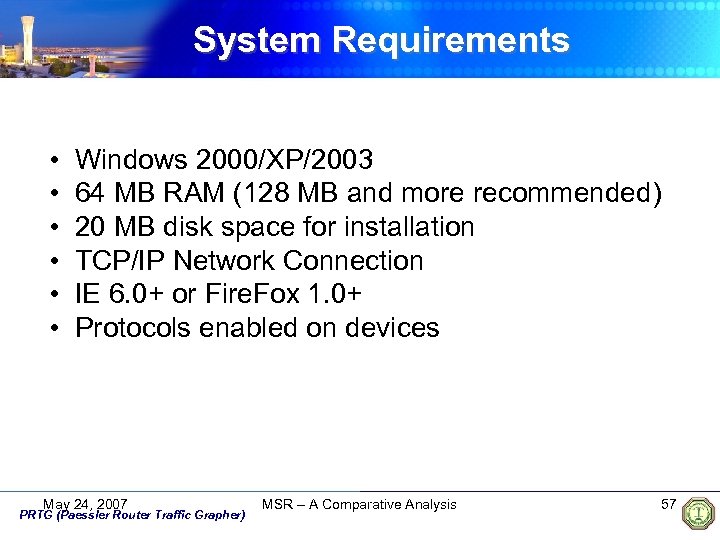
System Requirements • • • Windows 2000/XP/2003 64 MB RAM (128 MB and more recommended) 20 MB disk space for installation TCP/IP Network Connection IE 6. 0+ or Fire. Fox 1. 0+ Protocols enabled on devices May 24, 2007 PRTG (Paessler Router Traffic Grapher) MSR – A Comparative Analysis 57
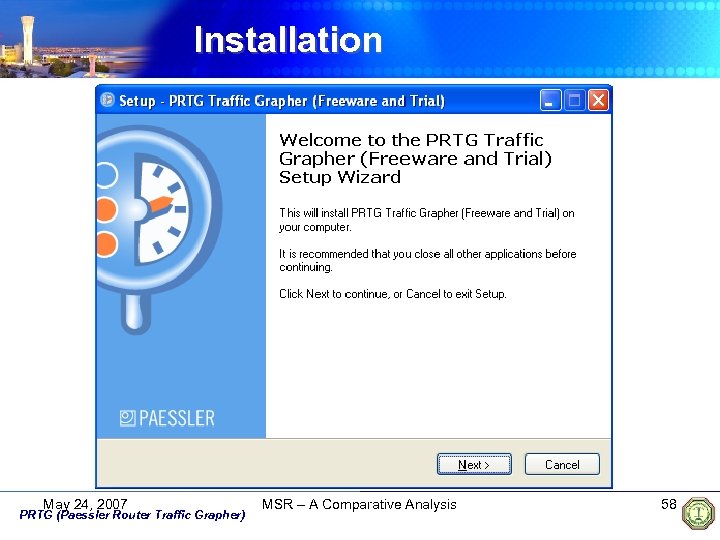
Installation May 24, 2007 PRTG (Paessler Router Traffic Grapher) MSR – A Comparative Analysis 58
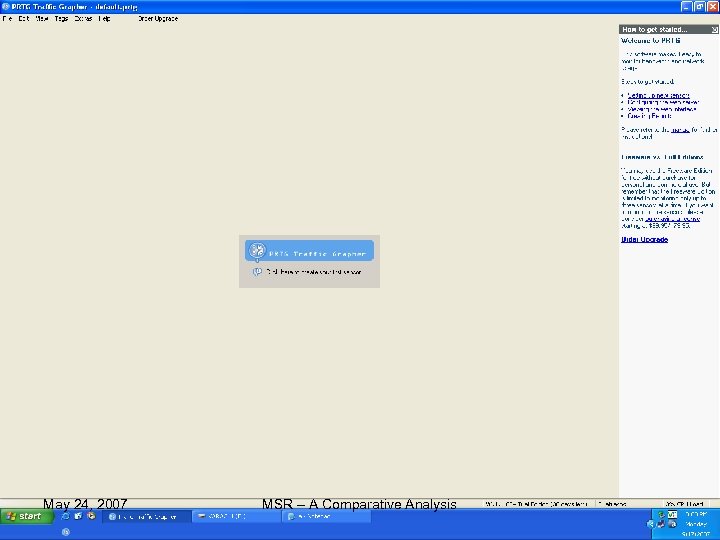
… continued May 24, 2007 PRTG (Paessler Router Traffic Grapher) MSR – A Comparative Analysis 59
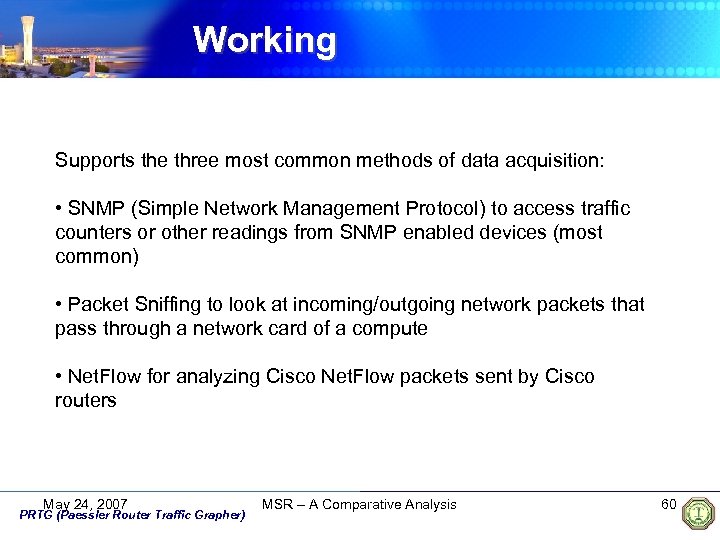
Working Supports the three most common methods of data acquisition: • SNMP (Simple Network Management Protocol) to access traffic counters or other readings from SNMP enabled devices (most common) • Packet Sniffing to look at incoming/outgoing network packets that pass through a network card of a compute • Net. Flow for analyzing Cisco Net. Flow packets sent by Cisco routers May 24, 2007 PRTG (Paessler Router Traffic Grapher) MSR – A Comparative Analysis 60
User Interface • Monitoring data can be accessed via a Windows GUI and/or a web based front end • Integrated web server for remote access (no external web server necessary) • Results are shown in various graphs & tables • Graphs are always generated on-the-fly for live reporting May 24, 2007 PRTG (Paessler Router Traffic Grapher) MSR – A Comparative Analysis 61
Reports • Configurable reports (graphs and data tables) in HTML, Excel, TIFF, RTF or PDF format • Daily, monthly, and yearly reports can be exported via email or saved to file • x% percentile calculation for any value, any interval, and any time frame • Includes a billing system for bandwidth based billing May 24, 2007 PRTG (Paessler Router Traffic Grapher) MSR – A Comparative Analysis 62
Notifications • For each sensor, individual email notifications can be configured for : ü Errors (e. g. device is not reachable) ü Reaching traffic limits (e. g. more than x MB transferred per day or month) ü Reaching traffic or usage thresholds (e. g. more than 700 kbit bandwidth for more than one hour) May 24, 2007 PRTG (Paessler Router Traffic Grapher) MSR – A Comparative Analysis 63
Experimentation (Examples) ü Generate reports ü Use web interface ü Specify thresholds ü Add and edit sensors ü Automatic Network Discovery ü Export data tables and graphs ü Add customized graphs / tables ü Customize graphs and tables view May 24, 2007 PRTG (Paessler Router Traffic Grapher) MSR – A Comparative Analysis 64
Running the PRTG • When we run PRTG for the first time, it does not have any sensor to read. So we need to add some sensors to collect the data • After we have added some sensors, the main window looks like this: May 24, 2007 PRTG (Paessler Router Traffic Grapher) MSR – A Comparative Analysis 65
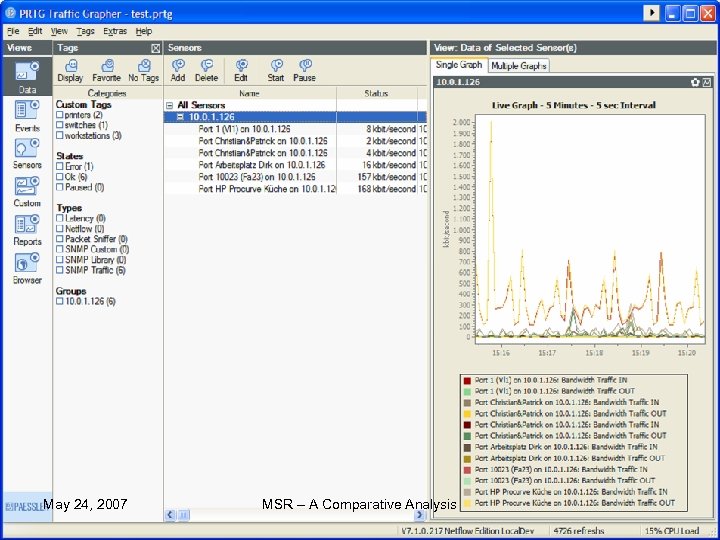
Running the PRTG • When we run PRTG for the first time, it does not have any sensor to read. So we need to add some sensors to collect the data • After we have added some sensors, the main window looks like this: May 24, 2007 PRTG (Paessler Router Traffic Grapher) MSR – A Comparative Analysis 66
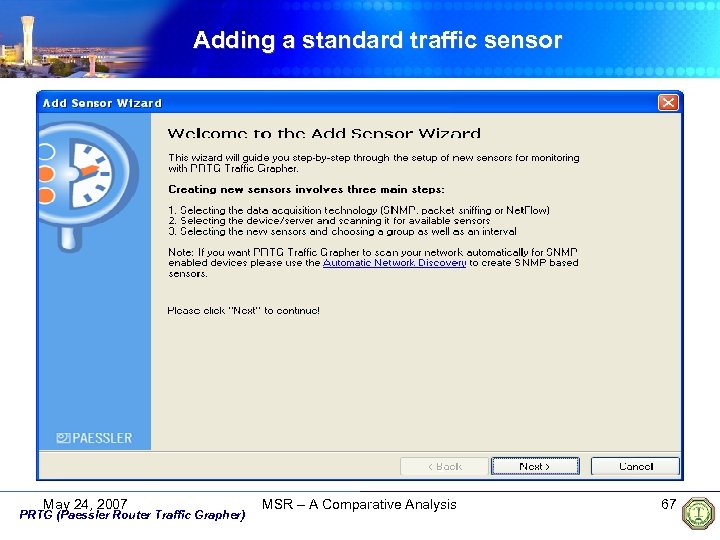
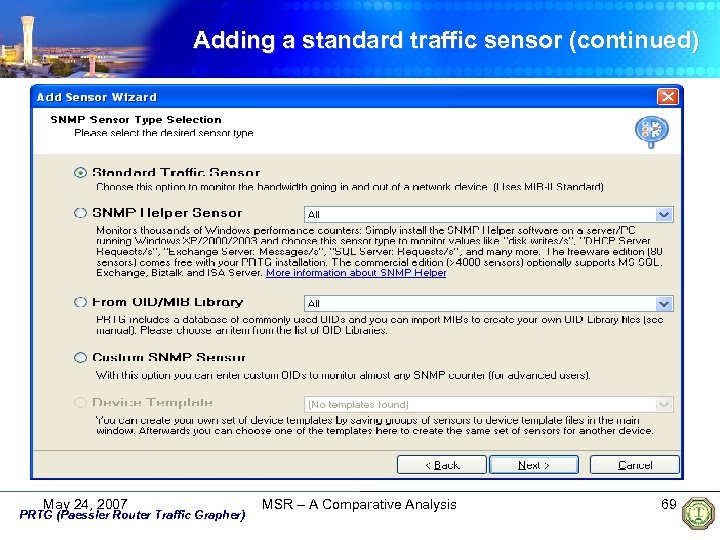
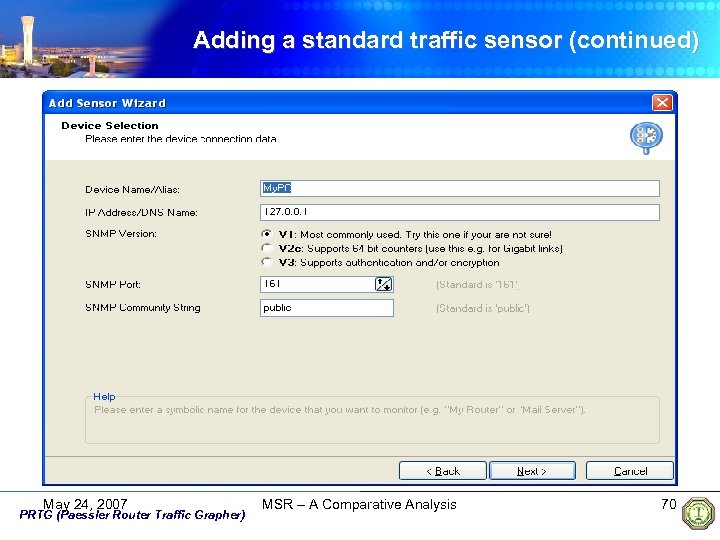
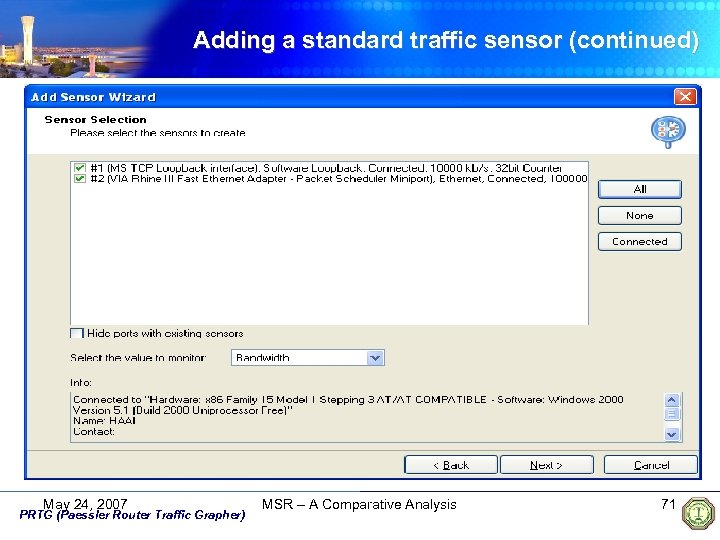
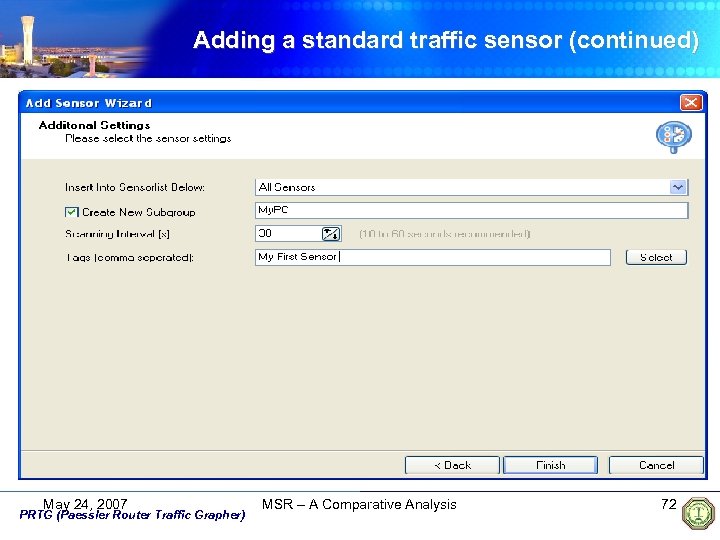
Adding a standard traffic sensor May 24, 2007 PRTG (Paessler Router Traffic Grapher) MSR – A Comparative Analysis 67
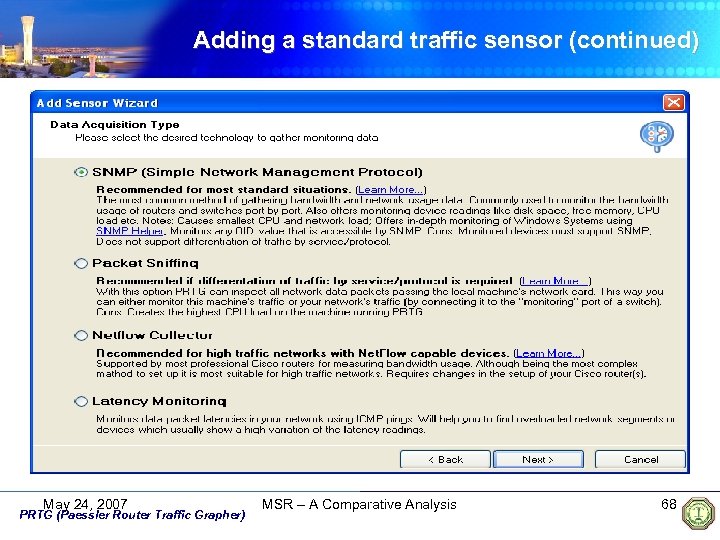
Adding a standard traffic sensor (continued) May 24, 2007 PRTG (Paessler Router Traffic Grapher) MSR – A Comparative Analysis 68
Adding a standard traffic sensor (continued) May 24, 2007 PRTG (Paessler Router Traffic Grapher) MSR – A Comparative Analysis 69
Adding a standard traffic sensor (continued) May 24, 2007 PRTG (Paessler Router Traffic Grapher) MSR – A Comparative Analysis 70
Adding a standard traffic sensor (continued) May 24, 2007 PRTG (Paessler Router Traffic Grapher) MSR – A Comparative Analysis 71
Adding a standard traffic sensor (continued) May 24, 2007 PRTG (Paessler Router Traffic Grapher) MSR – A Comparative Analysis 72
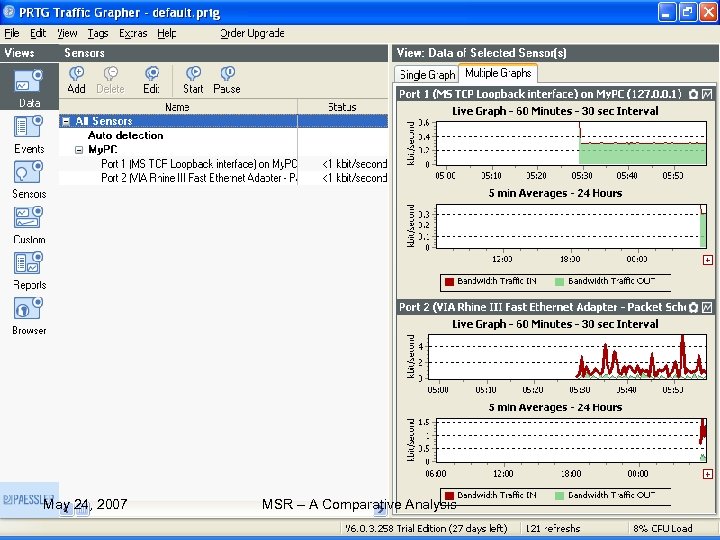
Adding a standard traffic sensor May 24, 2007 PRTG (Paessler Router Traffic Grapher) MSR – A Comparative Analysis 73
… continued The above example clearly showed you how a Standard Traffic Sensor in PRTG is added and monitored May 24, 2007 PRTG (Paessler Router Traffic Grapher) MSR – A Comparative Analysis 74
Conclusion • The GUI of PRTG is user friendly for the installation and usage purpose • Graphical view of the network and bandwidth usage provides better monitoring of networks • Provides easily identifying network bottlenecks • Better quality of service can be assured and plan according to the desired needs May 24, 2007 PRTG (Paessler Router Traffic Grapher) MSR – A Comparative Analysis 75

PRTG THANK YOU ! May 24, 2007 September 18, 2007 MSR – A Comparative Analysis 76

Firewall Analyzer 4 By: -Mojeeb Al-Rhman Al-Khiaty -Naif Al-Wadeai
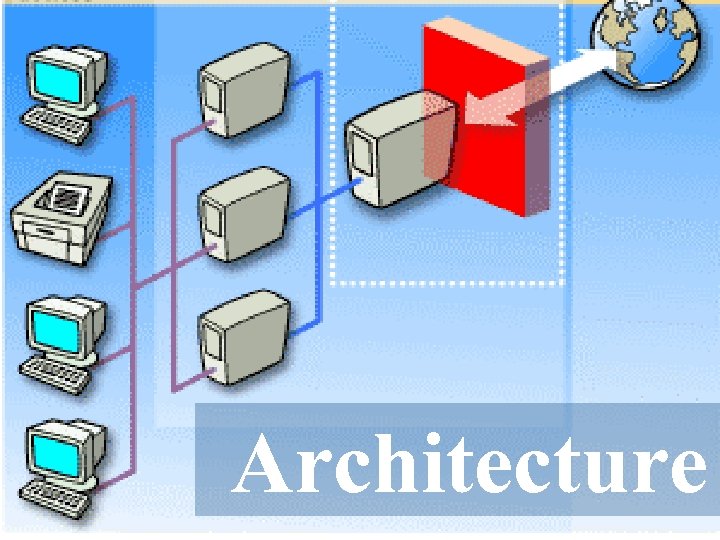
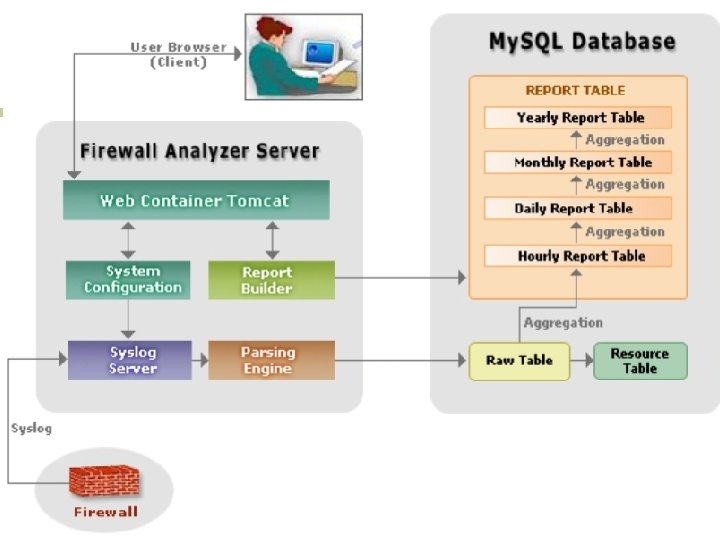
Outline: n n n n Reasons for choosing this tool ! What is Firewall ? Firewall Analyzer 4 ( Quick description). Features, Characteristics and Areas. How can you use this tool? Examples Firewall Architecture. References.

Reasons for choosing this tool! n Our team members are interest in the security and security management in networks. n We attempt to achieve the highest benefits from this course and connect it with our thesis ides.

What is Firewall ? n A Firewall is an important perimeter defense tool that protects your network from attacks. Security tools like Firewalls and Proxy Servers generate a huge quantity of traffic logs, which can be mined to generate a wealth of security information reports. [2]
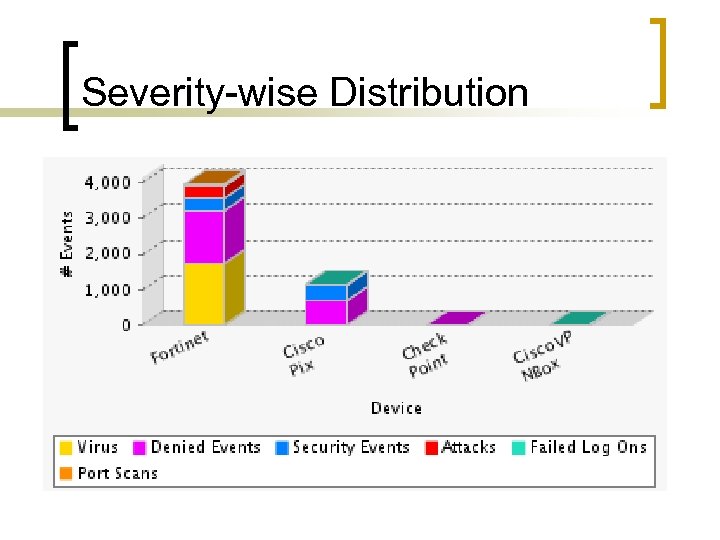
Firewall Analyzer 4. 0 !!! n n A web-based, cross-platform, log analysis tool that analyzes logs received from different firewalls and generates useful reports and graphs. Helps network administrators in doing: ¡ ¡ Trend analysis Capacity planning Policy enforcement Security compromises. [3]

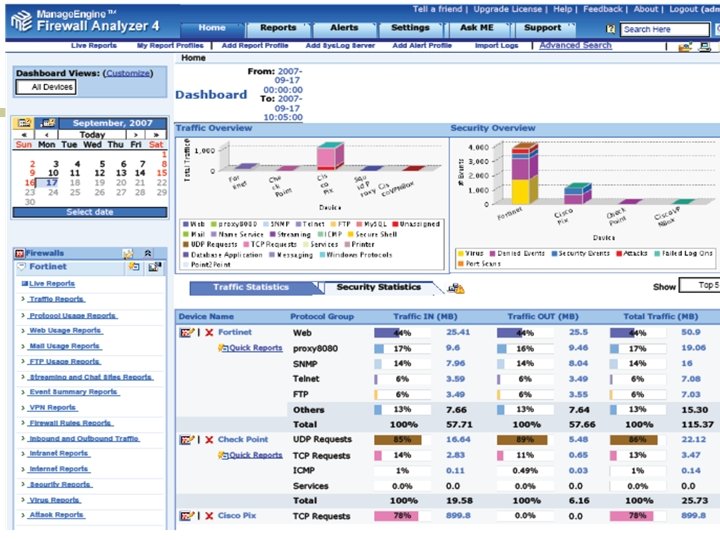
How can Firewall Analyzer help you? n n n n Analyze incoming and outgoing traffic/bandwidth patterns Identify top Web users, and top websites accessed Project trends in user activity and network activity Identify potential virus attacks and hack attempts Determine bandwidth utilization by host, protocol, and destination Alert on firewalls generating specific log events Analyze efficiency of firewall rules and modify them if needed Determine the complete security posture of the enterprise
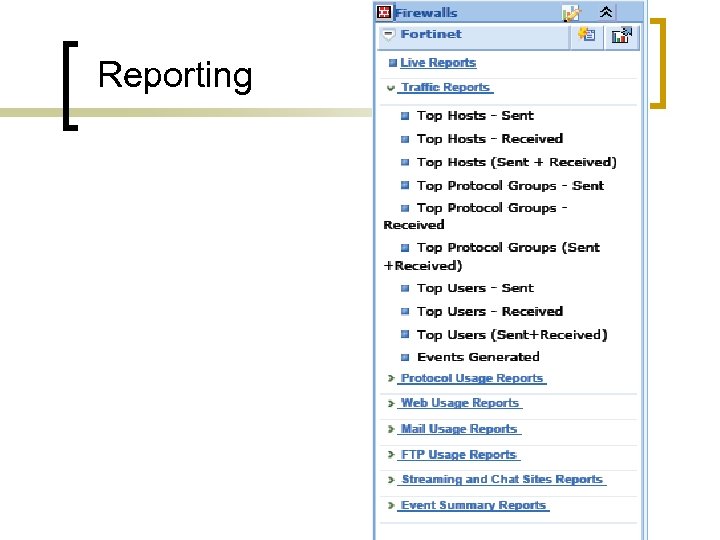
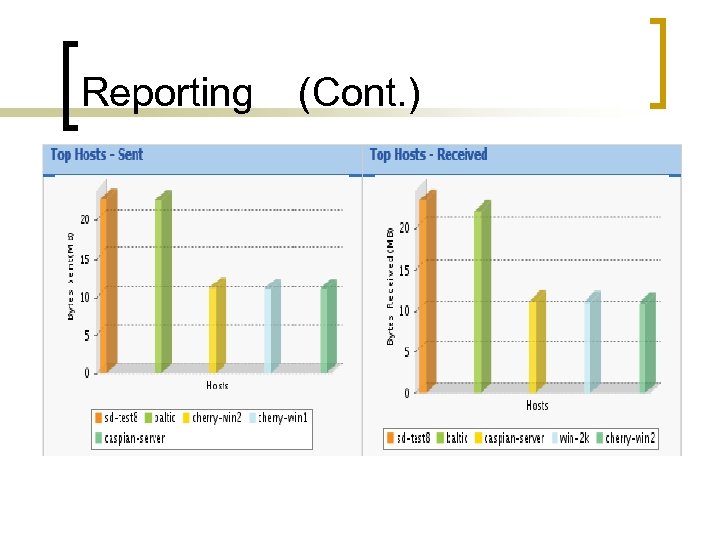
Firewall Analyzer 4. 0 (Cont. ) The reporting features available in this release include, n Pre-defined reports on bandwidth, protocol, users, etc. n Instant reports on firewall activity n Scheduling of reports n Custom report profiles n Historical trend reports n Export and save reports to PDF n Custom alert settings.
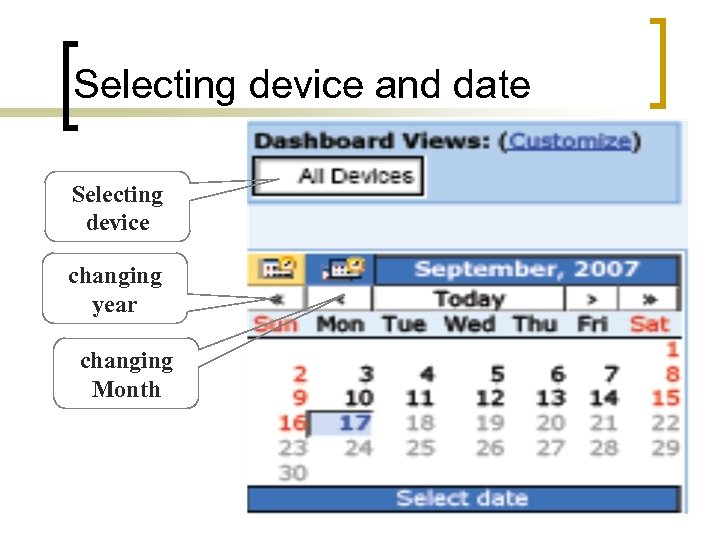
Features and Benefits (cont. ) n n n Multiple firewall vendor support: Support for most leading enterprise firewall appliances and servers. Automated syslog collection and processing : Automatically collects and parses logs, and updates the database at user-defined intervals Syslog archiving : Allows for archiving of log files at user-defined intervals Built-in database: Stores and processes syslog data in the embedded My. SQL database Dashboard : Provides a quick view of current activity across all devices from a single place
Features and Benefits (cont. ) n n Automatic alerting: Automatically notifies and warns against specific events based on userdefined thresholds Pre-defined device reports: Includes traffic analysis reports across all devices or specific to firewalls, proxy servers, and Radius servers Historical trending : Allows you to analyze trends in bandwidth usage, protocol usage, etc. over varying time periods Customizable report profiles: Allows you to build reports to meet your specific needs
Features and Benefits (cont. ) n n Report scheduling: Automatically generates reports at specified time intervals and delivers them as PDF reports via email. Multiple report formats: Generates and exports reports in HTML, PDF, and CSV formats. Advanced user management: Allows you to create different users and set appropriate access privileges Multi-platform support : Runs on Windows and Linux platforms
Examples
Protocol-wise Distribution
Severity-wise Distribution
Selecting device and date Selecting device changing year changing Month
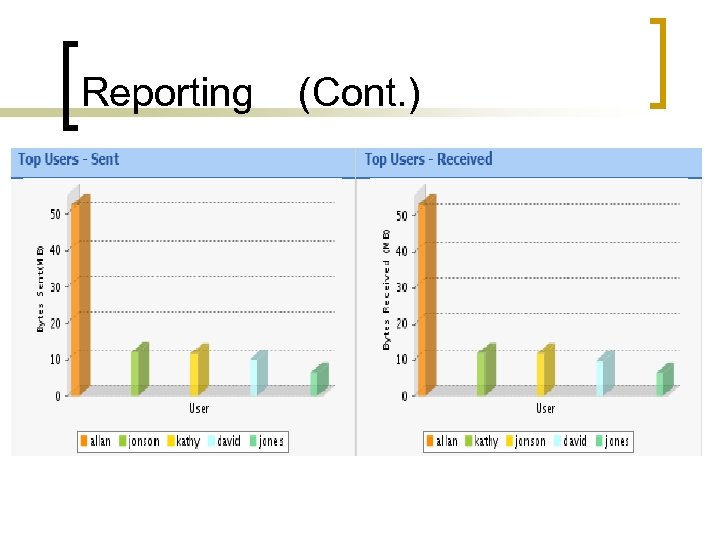
Reporting
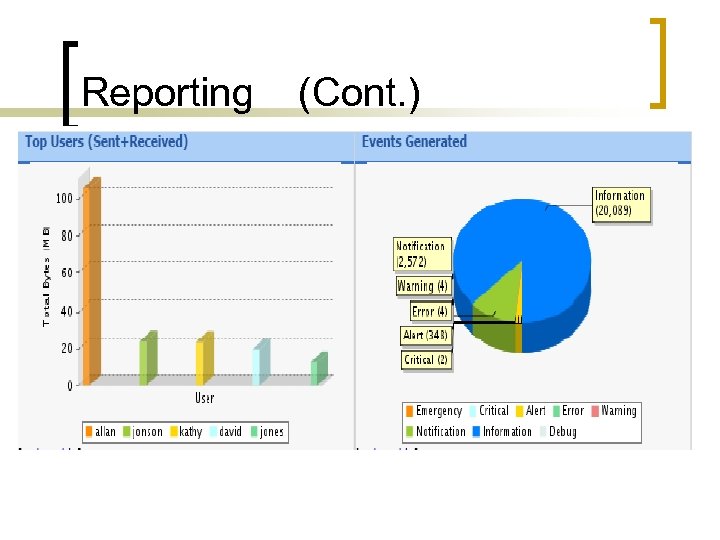
Reporting (Cont. )
Reporting (Cont. )
Reporting (Cont. )
Architecture
References: 1. 2. 3. “SNMP, SNMPv 2, SNMPv 3, AND RMON 1 and 2” by William Stallings, Addison-Wesley, Third Edition, 1996. http//www. manageengene. com http// www. fwanalyzer. com
AT THE END n Thanks for your attention n Team Members

Ahmad Salam Al. Refai Mohamed Abu Ghalioun WORM DETECTION SYSTEM
OUTLINE What is Worm? Intrusion Detection System (IDS). Billy Goat System. Collaborative Distributed Attack Detection. Theory of Attack Detection. Cooperative Messaging Protocol Questions & Answers. 101
WHAT IS WORM Worm is a self replicating computer program similar to a virus. A virus within another program, it executes when the other program executes, it need a host program cause mischief: deleting data, altering display. Worms move or propagate in network replicate themselves in machines before jumping to others Create much network traffic that overwhelms network (DOS) 102
INTRUSION DETECTION SYSTEM Started in 1987 by Dorothy E. Denning, a computer scientist then at SRI international, Menlo Park, Calif. In "An Intrusion detection Model" published in IEEE transactions on software engineering she describes how to model the statistical characteristics of a system operating normally so that deviations from the model could be taken as evidence that intruders were present. IDS tries to detect illegal things, however legitimate and illegitimate activities look similar, the diagnoses depends heavily on the context. 103
TYPES OF INTRUSION DETECTION SYSTEM A centralized system uses a single device to monitor the entire network. Centralized systems are designed primarily to protect enterprises by monitoring aggregate traffic at fixed locations in the network and responding by blocking or delaying observed malicious behavior. Distributed systems model tracks anomalies more reliably but requires installation in each machine. In this model all events are generated on the local systems individually. 104
BILLY GOAT SYSTEM The main problem of previous intrusion detection systems is the many false alarms they produce, their lack of resistance to both malicious attacks and accidental failures, and the constant appearance of new attacks and vulnerabilities. IBM Zurich Research Laboratory working in a remedy for worms that differs from other approaches in targeting worms specifically rather than trying to prevent all breaches of computer security. Billy Goat system does the work extremely accurately. Billy Goat is specialized worm-detection system that runs on dedicated machine connected to the network and detects worm-infected machines anywhere in it. Billy Goat is designed to take advantage of the way worms propagate. 105
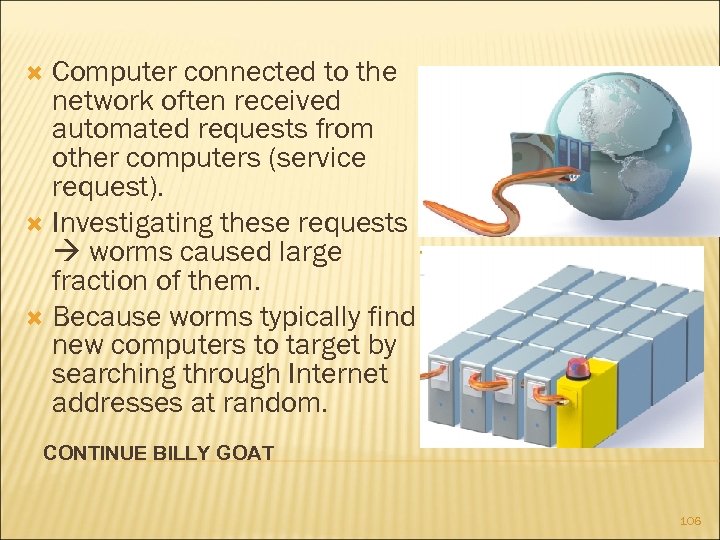
Computer connected to the network often received automated requests from other computers (service request). Investigating these requests worms caused large fraction of them. Because worms typically find new computers to target by searching through Internet addresses at random. CONTINUE BILLY GOAT 106

Strategy effective because the ever increasing number of infected machines in an attack can soon be generating hundreds of millions of addresses to try. The machines are assigned unused and unadvertised addresses. Because no one knew the existence of those machines so we can assume that the traffic would almost surely be illegitimate. CONTINUE BILLY GATE 107
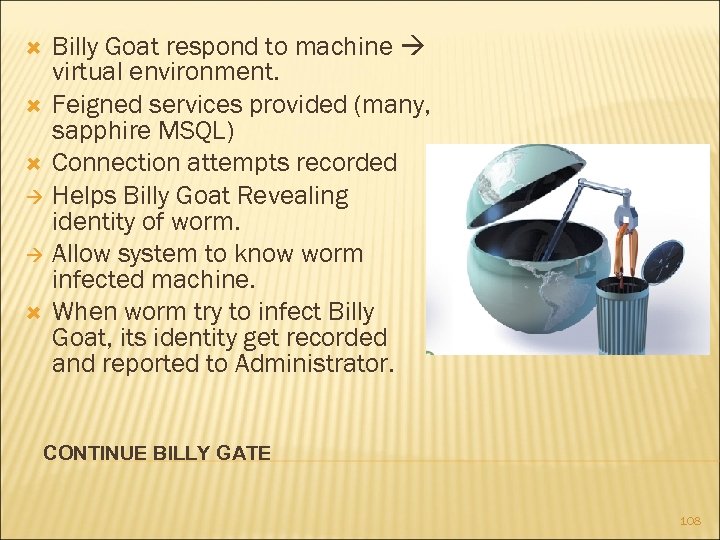
Billy Goat respond to machine virtual environment. Feigned services provided (many, sapphire MSQL) Connection attempts recorded Helps Billy Goat Revealing identity of worm. Allow system to know worm infected machine. When worm try to infect Billy Goat, its identity get recorded and reported to Administrator. CONTINUE BILLY GATE 108
CONTINUE BILLY GATE More than one address can be assigned to the same machine. The machine provide many virtual services. To ensure that Billy Goat keep working under heavy worm attack, we can use distributed architecture. Extremely effective, discover infective machines in seconds. 109
CENTRALIZED SYSTEMS VS. DISTRIBUTED LOCAL SYSTEMS Centralized Systems: Global view of the enterprise network. Which means a centralized decision maker. High quality (low false positive and low false negative). Not scalable for large networks may not be sufficient trust between sub-domains to accept a centralized protection policy. large numbers of mobile nodes may exit and enter the network leaving them temporarily without protection 110
CENTRALIZED SYSTEMS VS. DISTRIBUTED LOCAL SYSTEMS (CONT. ) Distributed System: Scalable for large networks. Lack of global view Low quality high false positive and high false negative. 111
COLLABORATIVE DISTRIBUTED ATTACK DETECTION It is a suggested solution: It uses a distributed system model, all events are generated using software detection agents on individual hosts. Solving the problem of the lack of global view Sharing information between nodes. 112
MECHANISM OF COLLABORATIVE DISTRIBUTED ATTACK DETECTION Attack Detection Cooperative Messaging Protocols 113
ATTACK DETECTION collaborating sites maintain a decision table. It is constructed using the ratio of the likelihood of features are a good indicator of the current worm attack to the likelihood for the features to occur at random. When the observed behavior exceeds predetermined threshold, enough evidence has been accumulated to reach a correct decision with high probability. 114
THEORY OF ATTACK DETECTION let H 1 to be the hypotheses that there is a worm. and H 0 be the hypotheses that there is no worm. Let Yi be the random variable that says there is an attack or not at site i. Yi= 1 if there is an attack; could be a false positive (fp) Yi= 0 if there is no attack; could be a false negative (fn). The observation vector L(Y) = {Y 1, Y 2 · · · Yn} then is the set of measurements obtained by n conditionally independent end -hosts. 115
THEORY OF ATTACK DETECTION (CONT) the table is constructed using many random walks through a collection of local detectors. The strength of the desired global detectors is specified by two quantities: Desired detection rate and desired false alarm rate. Using these, one can calculate thresholds in the table of likelihood ratios: T 0 = (1 − DD/1 − DF) and T 1 = (DD/ DF). 116
THEORY OF ATTACK DETECTION (CONT) Each host, then, implements a global intrusion detector that makes decisions as follows: if, after including the local detector state, the calculated likelihood ratio, L(Y) < T 0, accept the hypothesis that there is no worm (H 0) and halt the query. If L(Y) > T 1, accept the worm hypothesis (H 1) and raise a global alarm, otherwise continue the random walk among end hosts. 117
COOPERATIVE MESSAGING PROTOCOLS Cooperating hosts contain a random subset of the addresses of all nodes in the collection. Nodes with new alerts from their local detectors choose m other end-hosts at random and send the message “{1, 1}”, which means, “One site has reported one alert”. Hosts receiving this message add their local information (e. g. it would generate a “{2, 1}” if had not seen the activity, and a “{2, 2}” if had) 118
COOPERATIVE MESSAGING PROTOCOLS (CONT. ) If no decision is reached, m new sites are selected at random and the message propagates. In this manner multiple sequences (chains) of evidence are spread randomly across cooperating end-hosts. If “normal behavior” decisions are reached in any chain, that chain halts. If a “likely worm attack” decision is reached at any point, a global warning is broadcast to all nodes. 119

References How to hook Worms, JAMES RIORDAN, ANDREAS WESPI, DIEGO ZAMBONI, May 2005 A Distributed Host-based Worm Detection System, Senthilkumar G. Cheetancheri, John Mark Agosta, Denver H. Dash, Karl N. Levitt, , Jeff. Rowe, Eve M. Schooler,

QUESTIONS & ANSWERS 121
9638d945c088c3fd7809346927a9eebb.ppt