
Natural increase & Demographic structures Rates of


natural_increase_and_demographic_structure.ppt
- Размер: 11.3 Мб
- Автор:
- Количество слайдов: 61
Описание презентации Natural increase & Demographic structures Rates of по слайдам
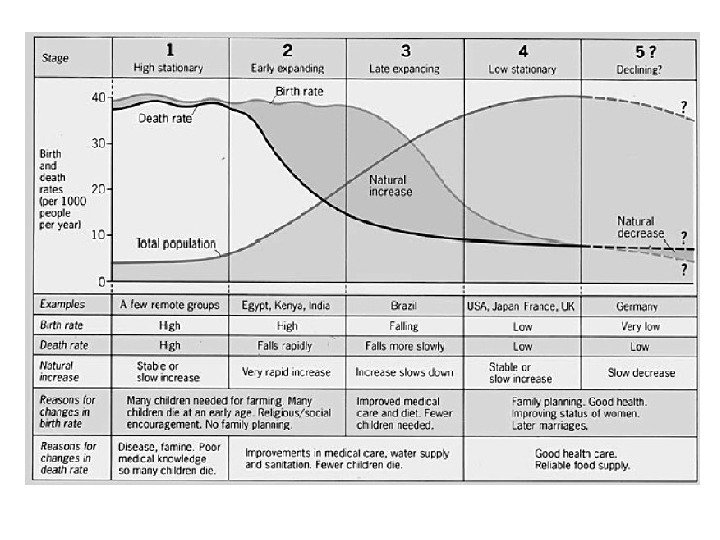
Natural increase & Demographic structures
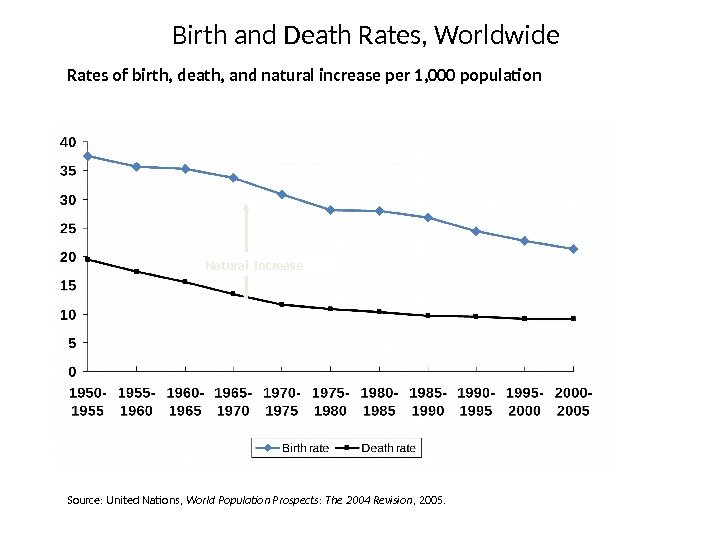
Rates of birth, death, and natural increase per 1, 000 population Natural Increase Source: United Nations, World Population Prospects: The 2004 Revision , 2005. Birth and Death Rates, Worldwide
Birth rates in 2006 8 — 12 13 — 19 20 — 27 28 — 38 39 —
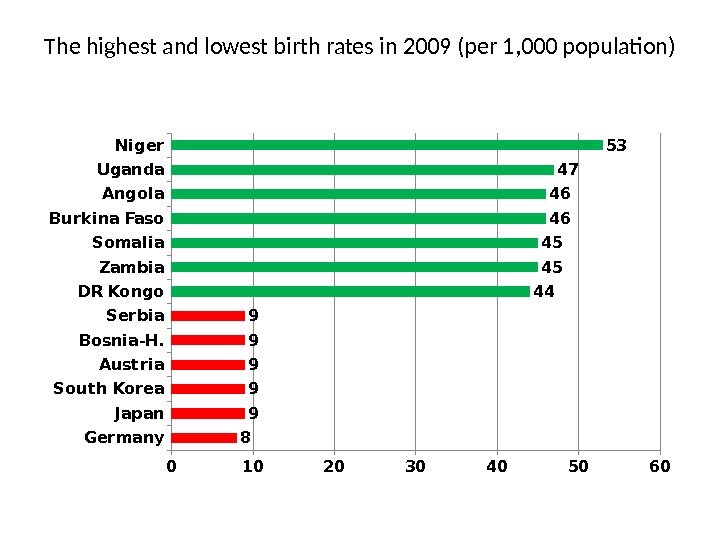
The highest and lowest birth rates in 2009 (per 1, 000 population) Germany Japan. South Korea Austria. Bosnia-H. Serbia. DR Kongo Zambia. Somalia. Burkina Faso Angola. Uganda Niger
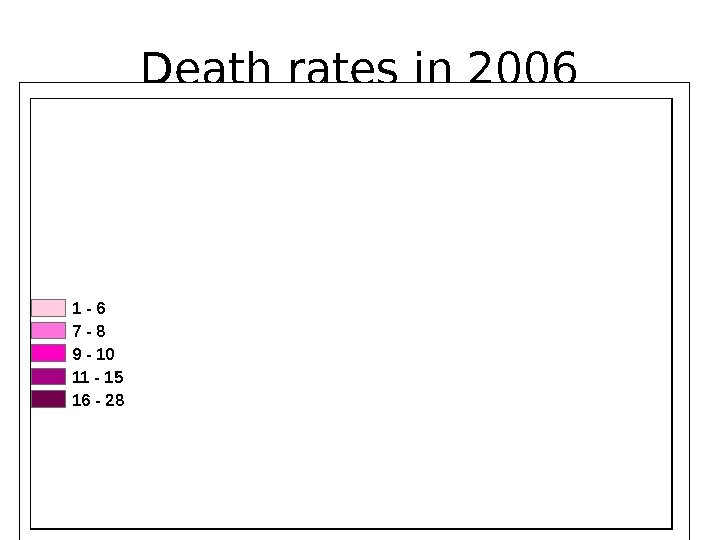
Death rates in 2006 1 — 6 7 — 8 9 — 10 11 — 15 16 —
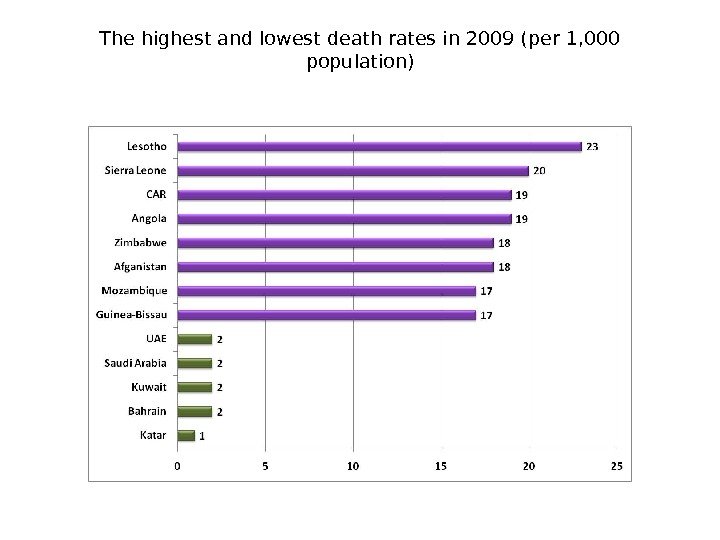
The highest and lowest death rates in 2009 (per 1, 000 population)
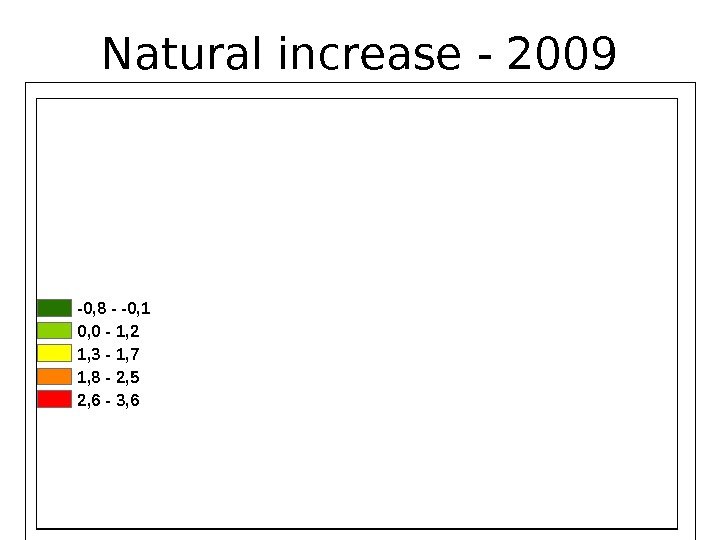
-0, 8 — -0, 1 0, 0 — 1, 2 1, 3 — 1, 7 1, 8 — 2, 5 2, 6 — 3, 6 Natural increase —
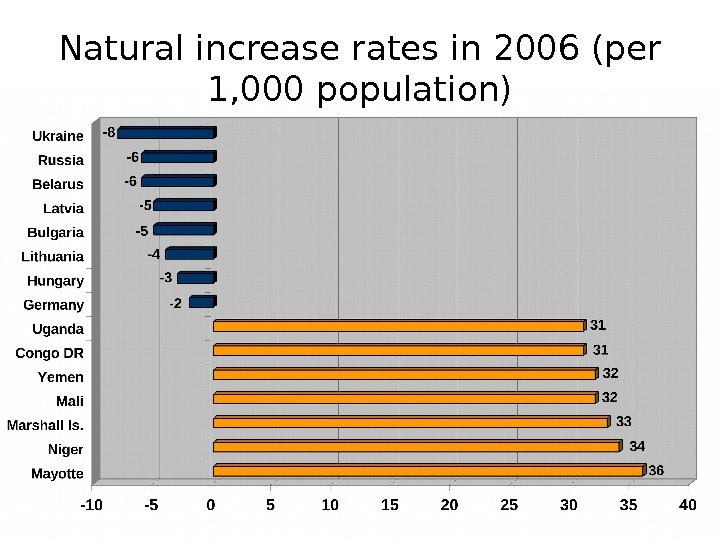
Natural increase rates in 2006 (per 1, 000 population)
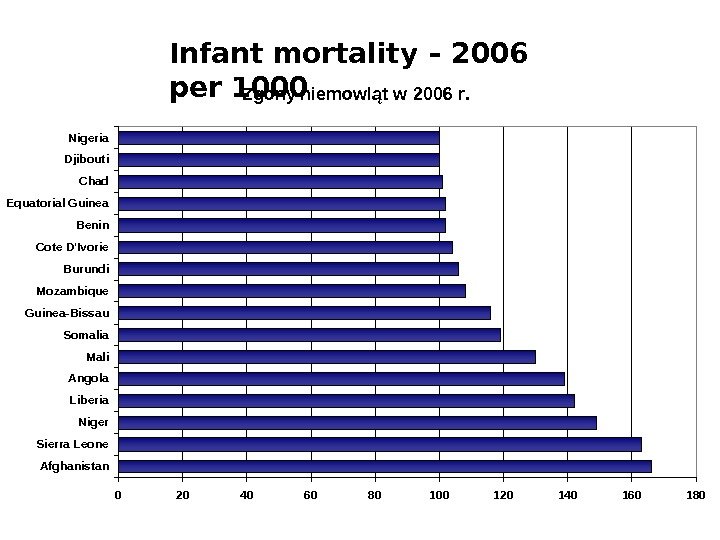
Infant mortality — 2006 WORLD_ZN 0, 0 — 16, 0 16, 1 — 40, 0 40, 1 — 68, 0 68, 1 — 108, 0 108, 1 — 166,
Zgony niemowląt w 2006 r. 0 20 40 60 80 100 120 140 160 180 Afghanistan. Sierra Leone Niger. Liberia. Angola Mali. Somalia. Guinea-Bissau Mozambique Burundi. Cote D’Ivorie Benin. Equatorial Guinea Chad. Djibouti Nigeria Infant mortality – 2006 per
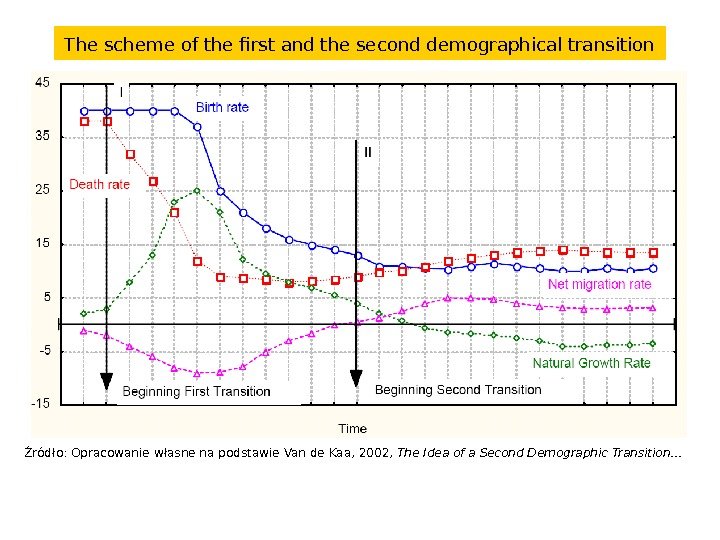
• The theory of Demographic Transition • Established in 1945 by American scientist F. Notestein • The main issue: the change of demographic reproduction from traditional to modern one.
The scheme of the first and the second demographical transition Źródło: Opracowanie własne na podstawie Van de Kaa, 2002, The Idea of a Second Demographic Transition…
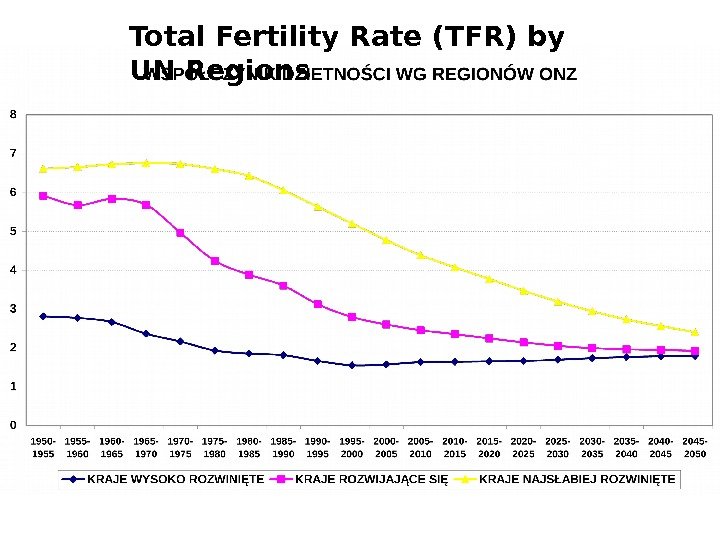
Total Fertility Rate (TFR) by UN Regions
The change of TFR by UN regions in Europe
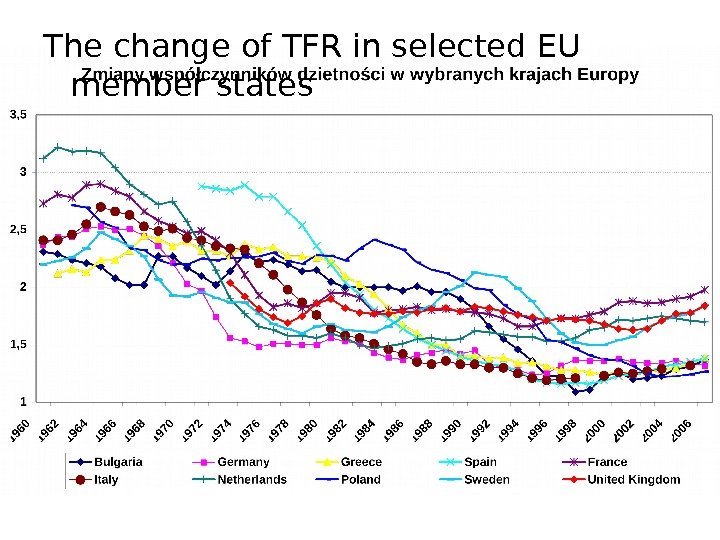
The change of TFR in selected EU member states
The influence of TFR on natural dectease TFR Decrease per year The number of years needed for population reduction by half 1, 5 -1, 07% 64, 7 1, 3 -1, 57% 44, 3 1, 1 -2, 14% 32, 4 źródło: Billari (2005)
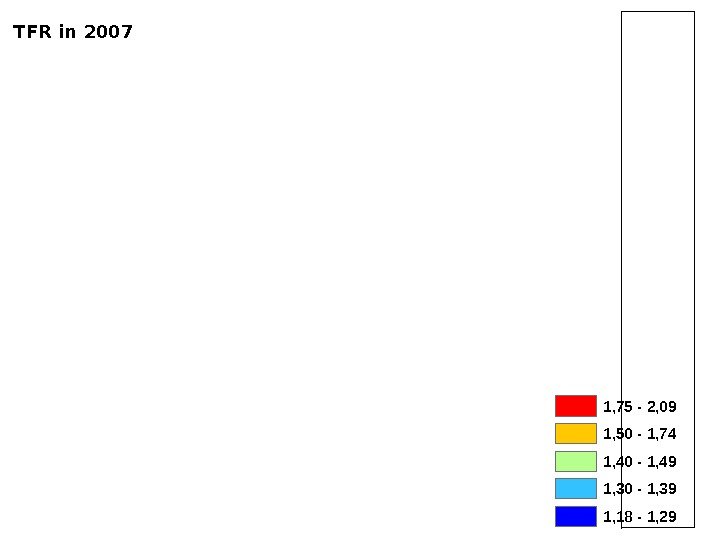
1, 41 1, 33 1, 96 1, 40 1, 88 1, 37 1, 83 1, 311, 90 1, 35 1, 301, 84 1, 37 1, 422, 09 1, 32 1, 381, 44 1, 35 1, 411, 33 2, 01 1, 40 1, 22 1, 25 1, 63 1, 46 1, 251, 72 1, 70 2, 00 1, 461, 84 1, 38 1, 69 1, 391, 61 1, 18 1, 37 1, 75 — 2, 09 1, 50 — 1, 74 1, 40 — 1, 49 1, 30 — 1, 39 1, 18 — 1, 29 TFR in
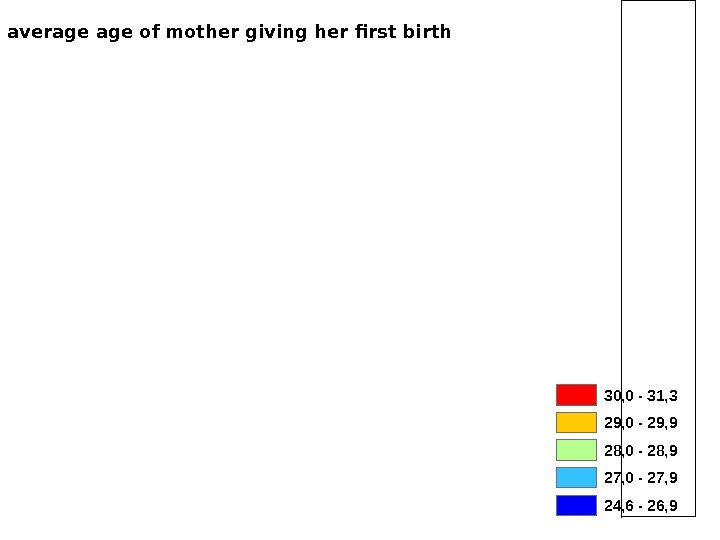
26, 4 25, 6 29, 8 30, 9 30, 5 29, 6 30, 0 28, 329, 8 30, 9 26, 929, 2 26, 2 24, 629, 5 28, 7 27, 529, 228, 9 27, 7 29, 929, 5 30, 7 27, 8 28, 5 27, 3 27, 9 28, 4 30, 6 25, 830, 6 29, 3 27, 3 30, 930, 3 30, 9 29, 629, 2 28, 4 29, 8 29, 930, 3 28, 4 29, 9 30, 3 28, 6 30, 0 — 31, 3 29, 0 — 29, 9 28, 0 — 28, 9 27, 0 — 27, 9 24, 6 — 26, 9 The average of mother giving her first birth
8, 9 4, 2 4, 6 5, 2 4, 5 5, 6 6, 55, 0 4, 2 8, 85, 2 9, 3 3, 95, 5 5, 64, 1 4, 4 5, 24, 35, 55, 1 6, 8 5, 6 5, 2 5, 0 5, 1 5, 34, 5 8, 26, 7 4, 3 7, 1 7, 63, 24, 1 6, 15, 1 7, 1 Małżeństwa na 1000 mieszk. w 2006 r. 6, 9 — 9, 3 5, 6 — 6, 8 5, 2 — 5, 5 4, 4 — 5, 1 3, 2 — 4, 3 Marriages per 1000 inhabitants
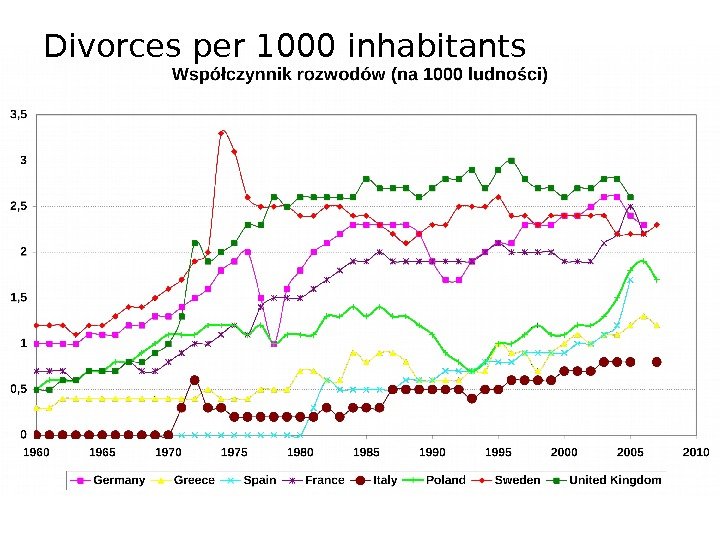
Divorces per 1000 inhabitants
Divorces per 100 matrimonies in 200859, 7 51, 8 50, 9 62, 7 42, 5 50, 7 43, 4 25, 4 40, 4 20, 7 23, 9 53, 4 47, 5 50, 9 34, 1 63, 1 22, 2 57, 0 59, 7 5, 2 42, 9 21, 2 54, 5 15, 4 48, 0 21, 5 44, 8 57, 1 47, 2 8, 2 47, 3 42, 3 63, 5 19, 1 39, 3 33, 9 12, 6 27, 9 51, 0 35, 1 55, 0 — 63, 5 45, 0 — 54, 9 35, 0 — 44, 9 25, 0 — 34, 9 5, 2 — 24,
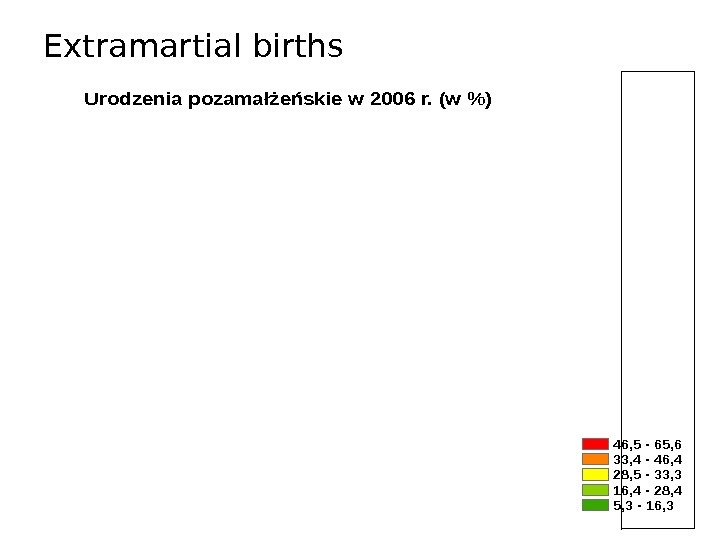
Extramartial births 30, 0 49, 5 28, 4 55, 5 30, 0 40, 6 15, 4 29, 0 5, 3 50, 8 65, 6 20, 9 35, 637, 2 11, 6 15, 4 21, 4 18, 9 53, 1 43, 724, 1 31, 6 33, 3 33, 2 29, 6 43, 4 11, 0 27, 5 58, 2 37, 1 23, 9 46, 4 12, 5 47, 2 28, 8 20, 0 16, 3 9, 938, 6 Urodzenia pozamałżeńskie w 2006 r. (w %) 46, 5 — 65, 6 33, 4 — 46, 4 28, 5 — 33, 3 16, 4 — 28, 4 5, 3 — 16,
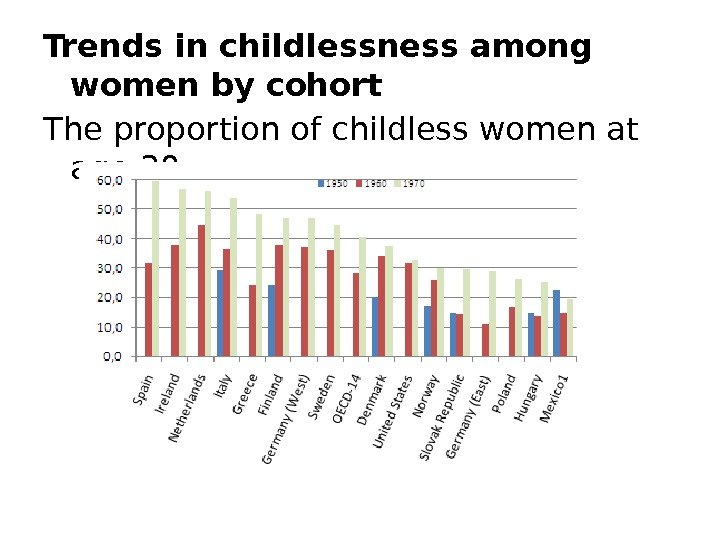
Trends in childlessness among women by cohort The proportion of childless women at age
Summary • Decrease of TFR below „Zero Growth Minimum” • Putting the first and next births aside • Increasing number of extramartial births • TFR extremely varied in different regions • Diffusion of processes connected with 1 st and 2 nd transition • Importance of pro-family policies • Results of low fertility: – Ageing of societies – Depopulation
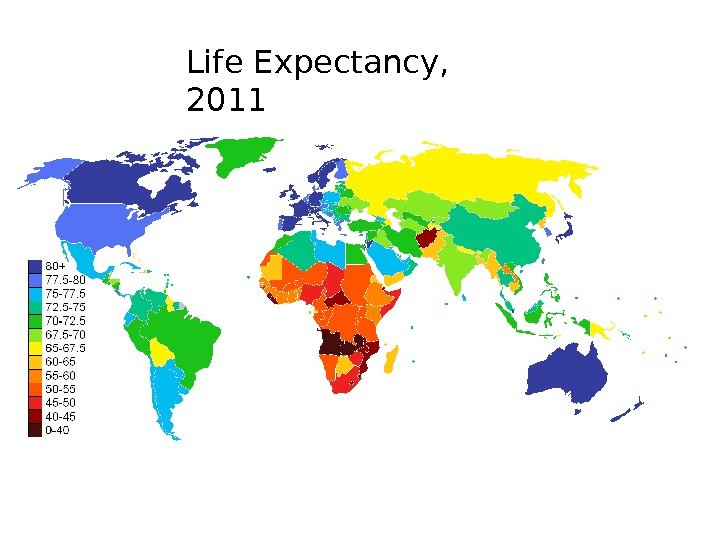
Life Expectancy,
63 54 50 50 46 37 All Ages 60+ Ages 80+ Women Men. Wo me n a nd A gi ng Projected World Population, by Sex, at Specified Age Groups, 202 5 Percent Source: United Nations, World Population Prospects: The 2002 Revision (medium scenario), 2003.
T re nds i n A gi ng, by Wo rl d R e gi o n Population Ages 65 and Older Percent 7 3 6 6 14 11 4 10 10 21 World Africa Asia Latin America/ Caribbean More Developed Regions 2000 2025 (Project ed) Source: United Nations, World Population Prospects: The 2002 Revision (medium scenario), 2003.
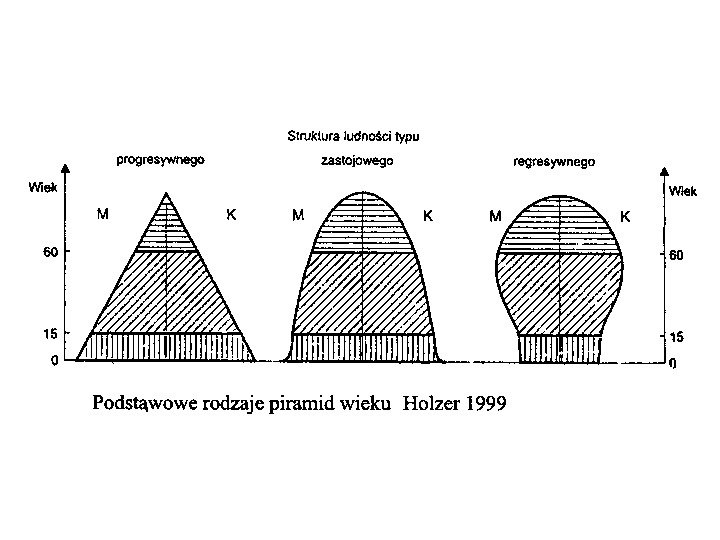
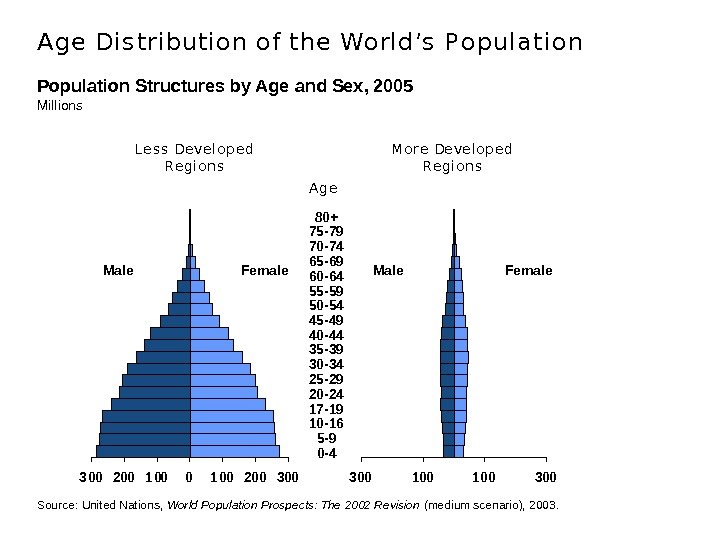
Population Structures by Age and Sex, 2005 Millions 300 100 300300 200 100 200 300 L e s s De ve l o p e d R e gio ns M o re De ve lo pe d R e gi o ns Male Female 80+ 75 — 79 70 — 74 65 — 69 60 — 64 55 — 59 50 — 54 45 — 49 40 — 44 35 — 39 30 — 34 25 — 29 20 — 24 17 — 19 10 — 16 5 — 9 0 — 4 A ge Source: United Nations, World Population Prospects: The 2002 Revision (medium scenario), 2003. A ge Di s tri buti o n o f the Wo rl d ’ s P o pul a ti o n
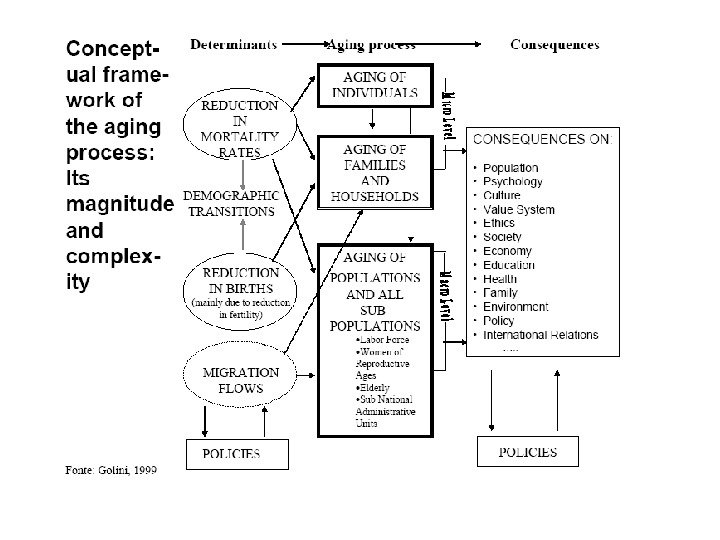
Source: Golini The changing age structure of population and its consequences for development Panel discussion – Thursday, 12 October 200 Dag Hammarskjold Library Auditorium of United Nations
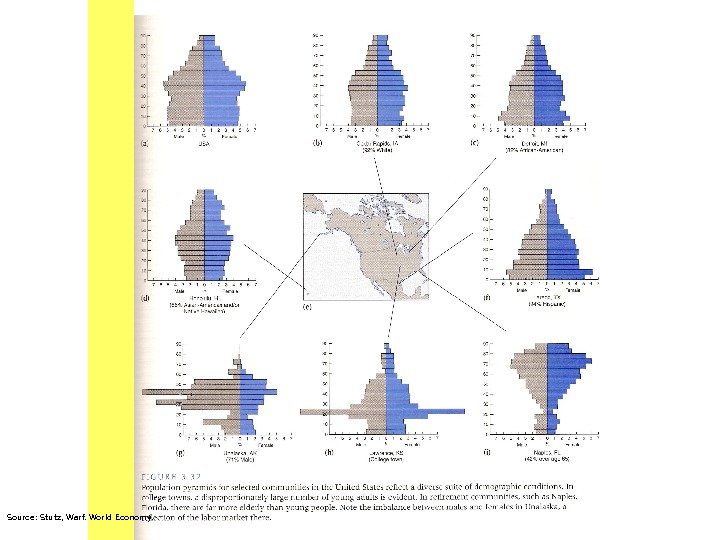
Source: Stutz, Warf. World Economy.
POPULATION AGED UNDER 15 (%) 13 — 20 21 — 29 30 — 36 37 — 43 44 —
POPULATION AGED UNDER 15 (%)
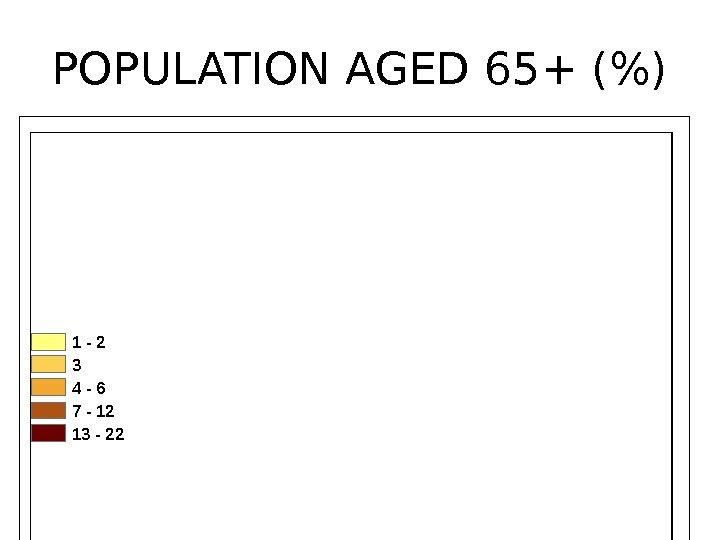
POPULATION AGED 65+ (%) 1 — 2 3 4 — 6 7 — 12 13 —
POPULATION AGED 65+ (%)
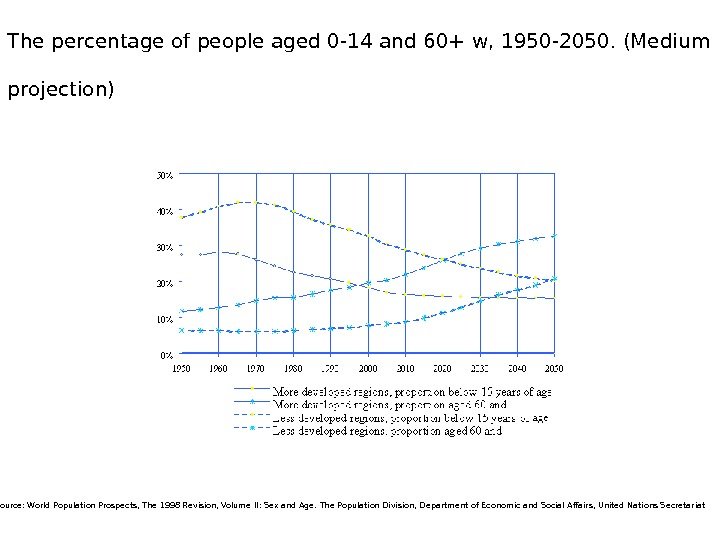
The percentage of people aged 0 -14 and 60+ w, 1950 -2050. (Medium projection) Source: World Population Prospects, The 1998 Revision, Volume II: Sex and Age. The Population Division, Department of Economic and Social Affairs, United Nations Secretariat
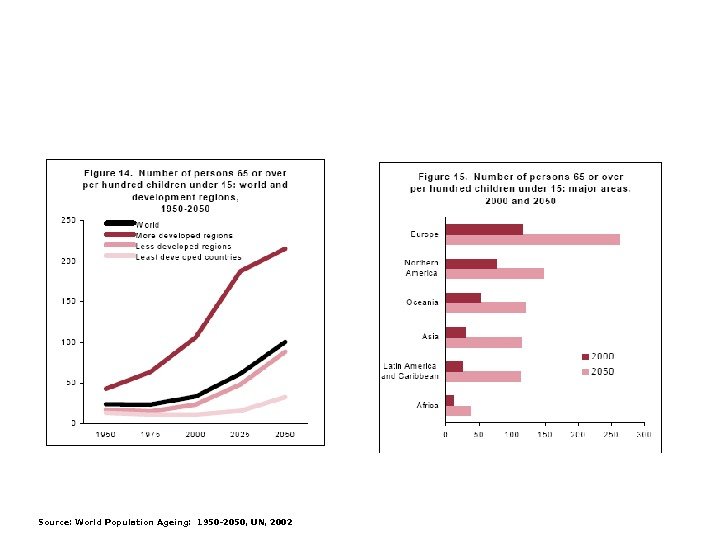
Source: World Population Ageing: 1950 -2050, UN,
Three centuries of world population ageing Source: Long-Range World Population Projections: Based on the 1998 Revision. The Population Division, Department of Economic and Social Affairs, United Nations Secretariat
Percentage Increase in Age 60 and Over by Region, 2000 -2050 Source: World Population Prospects, The 1998 Revision, Volume II: Sex and Age. The Population Division, Department of Economic and Social Affairs, United Nations Secretariat
Source: World Population Ageing: 1950 -2050, UN,
Source: World Population Ageing: 1950 -2050, UN,
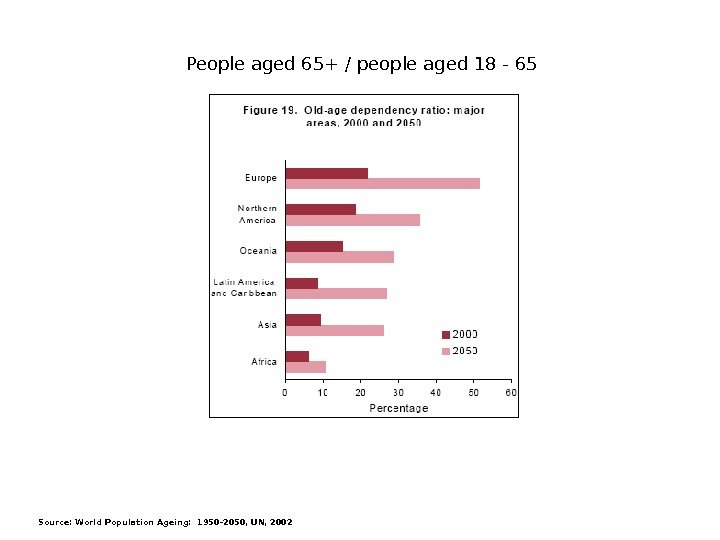
Source: World Population Ageing: 1950 -2050, UN, 2002 People aged 65+ / people aged 18 —
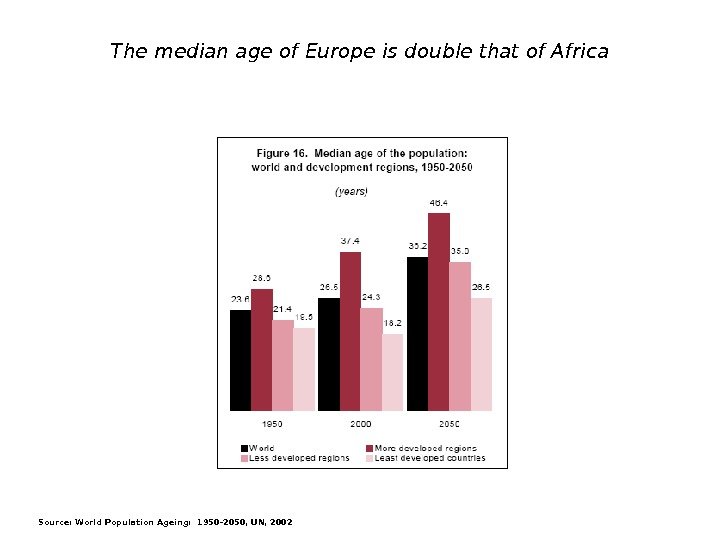
The median age of Europe is double that of Africa Source: World Population Ageing: 1950 -2050, UN,
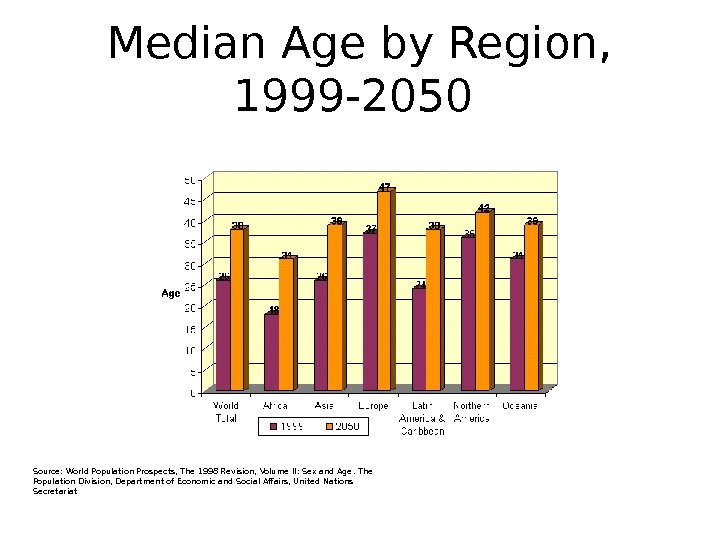
Median Age by Region, 1999 -2050 Source: World Population Prospects, The 1998 Revision, Volume II: Sex and Age. The Population Division, Department of Economic and Social Affairs, United Nations Secretariat
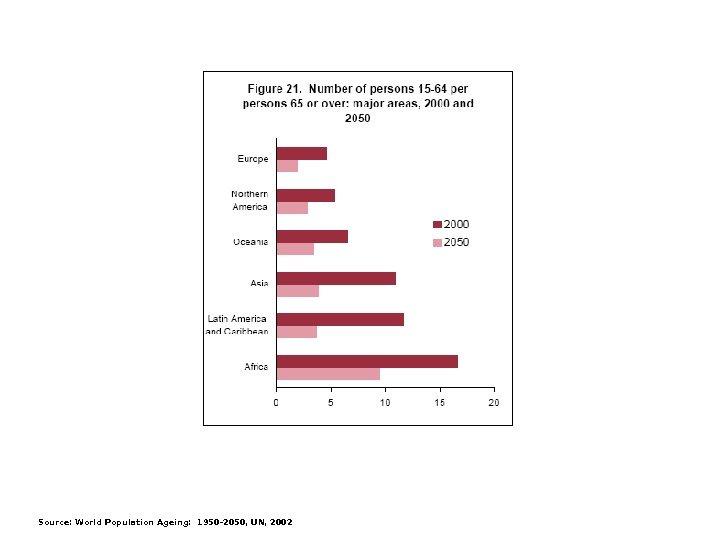
Source: World Population Ageing: 1950 -2050, UN, 2002 People aged 15 -65 / People aged 65+
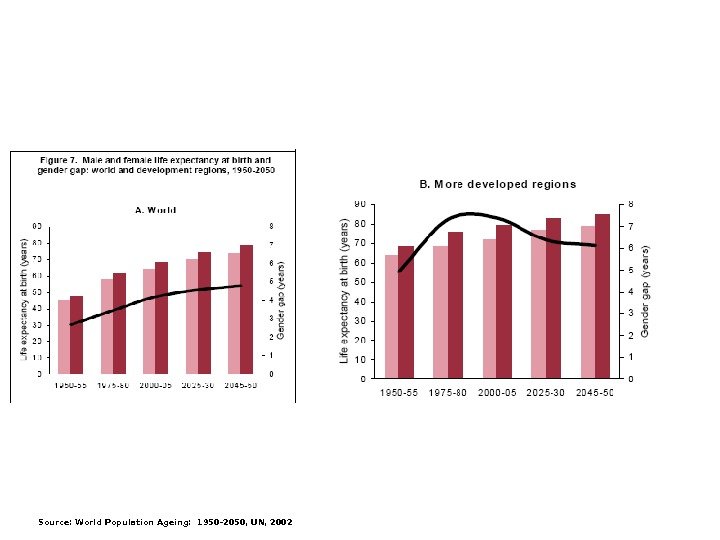
Source: World Population Ageing: 1950 -2050, UN,
Source: World Population Ageing: 1950 -2050, UN, 2002 People aged 85+ / people aged 50 —
Source: World Population Ageing: 1950 -2050, UN,
Source: World Population Ageing: 1950 -2050, UN,
Source: World Population Ageing: 1950 -2050, UN,
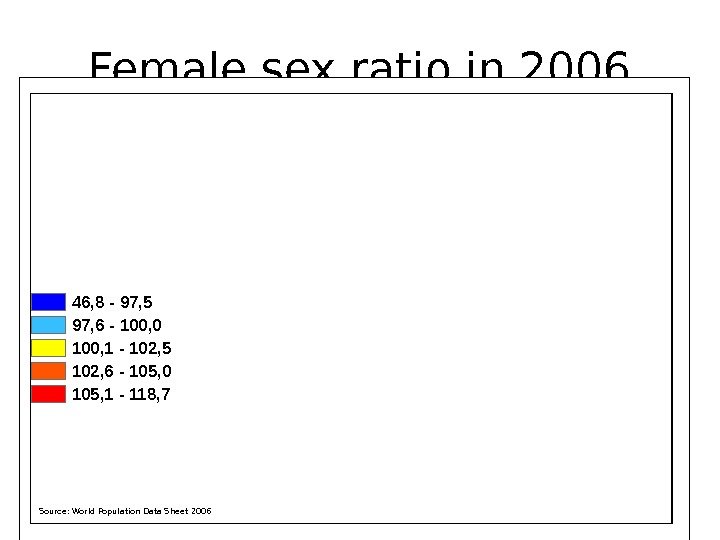
Female sex ratio in 2006 46, 8 — 97, 5 97, 6 — 100, 0 100, 1 — 102, 5 102, 6 — 105, 0 105, 1 — 118, 7 Source: World Population Data Sheet
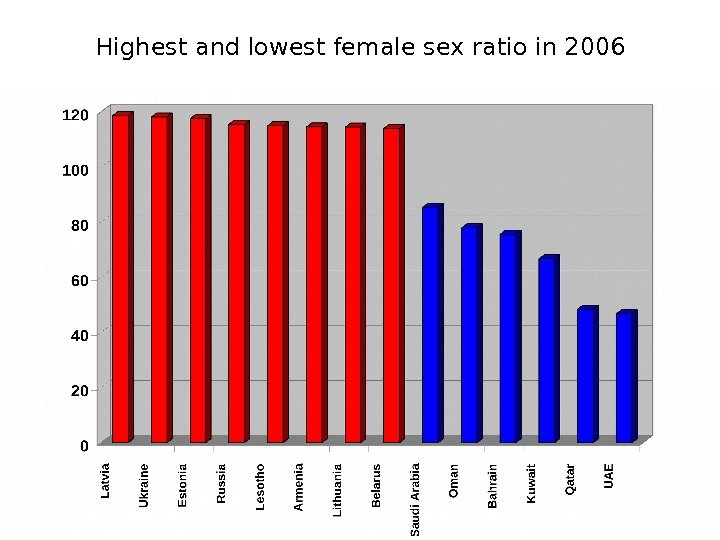
Highest and lowest female sex ratio in