
Natural increase & Demographic structures Life Expectancy, 2011


")

")


")


")


")
")
")
")


8150-natural_increase_and_demographic_structure.ppt
- Количество слайдов: 57
Natural increase & Demographic structures
Life Expectancy, 2011
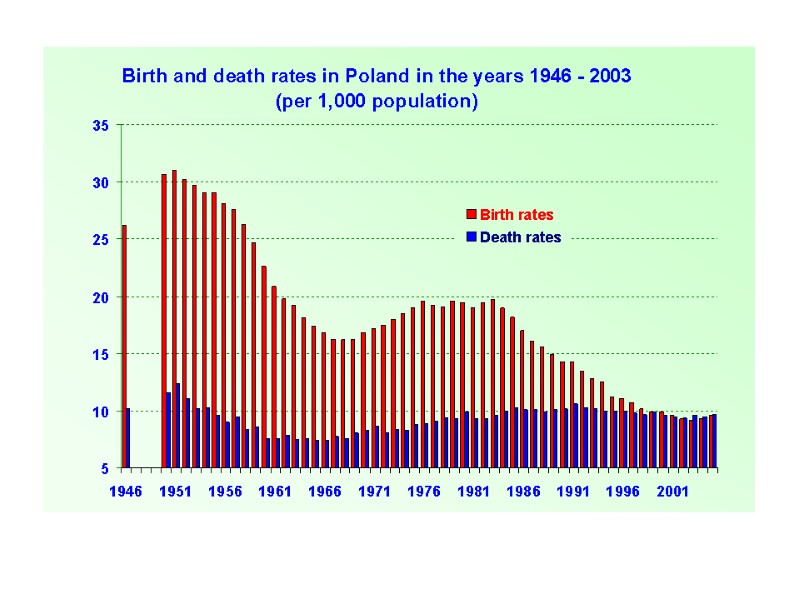
Rates of birth, death, and natural increase per 1,000 population Natural Increase Source: United Nations, World Population Prospects: The 2004 Revision, 2005. Birth and Death Rates, Worldwide
The highest and lowest birth rates in 2009 (per 1,000 population)
Birth rates in 2006
The highest and lowest death rates in 2009 (per 1,000 population)
Death rates in 2006
Przyrost naturalny na 1000 osób w 2009 r.
Natural increase rates in 2006 (per 1,000 population)
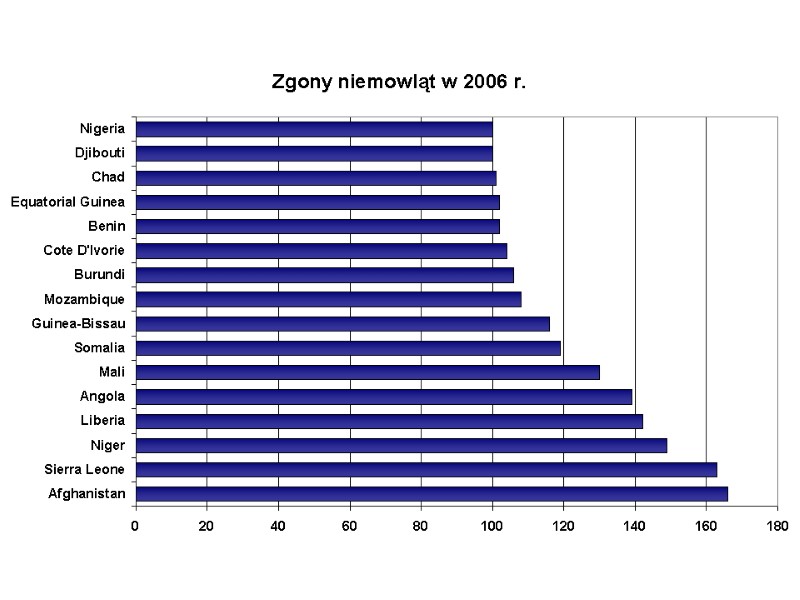
Zgony niemowląt w 2006 r.
Teoria przejścia demograficznego Sformułowana w 1945 r. przez amerykańskiego demografa F. Notesteina Przedmiotem teorii przejścia demograficznego jest zmiana reprodukcji ludności z rozrzutnej na oszczędną (lub inaczej: z tradycyjnej na nowoczesną).
Model Pierwszego i Drugiego Przejścia Demograficznego Źródło: Opracowanie własne na podstawie Van de Kaa, 2002, The Idea of a Second Demographic Transition…
Wpływ TFR na ubytek rzeczywisty w populacji stacjonarnej źródło: Billari (2005)
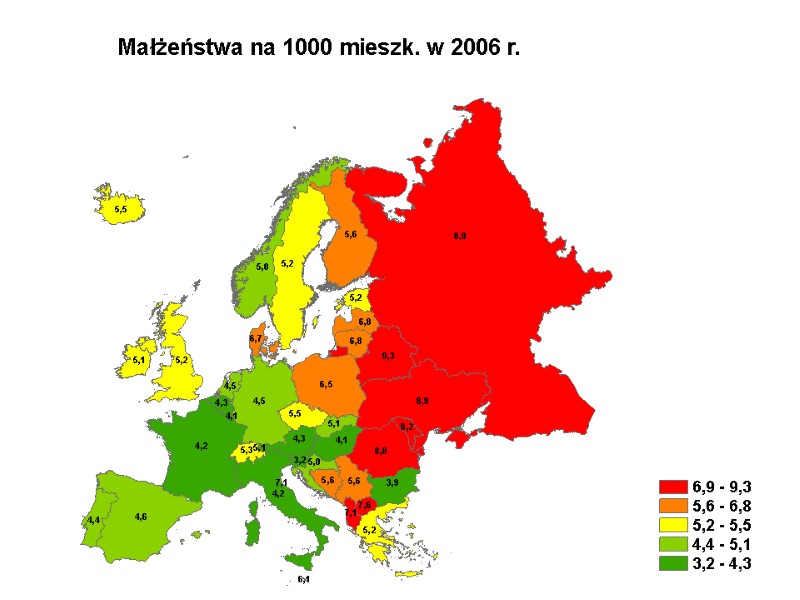
Współczynnik dzietności w 2007 r.
Średni wiek matki w momencie urodzenia dziecka w 2006 r.
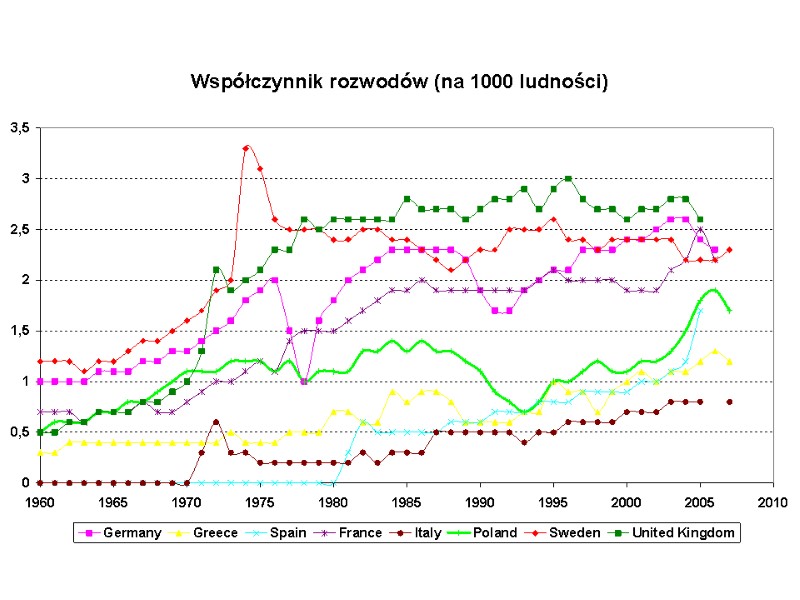
Rozwody na 100 zawartych małżeństw w 2008 r.
Trends in childlessness among women by cohort The proportion of childless women at age 30
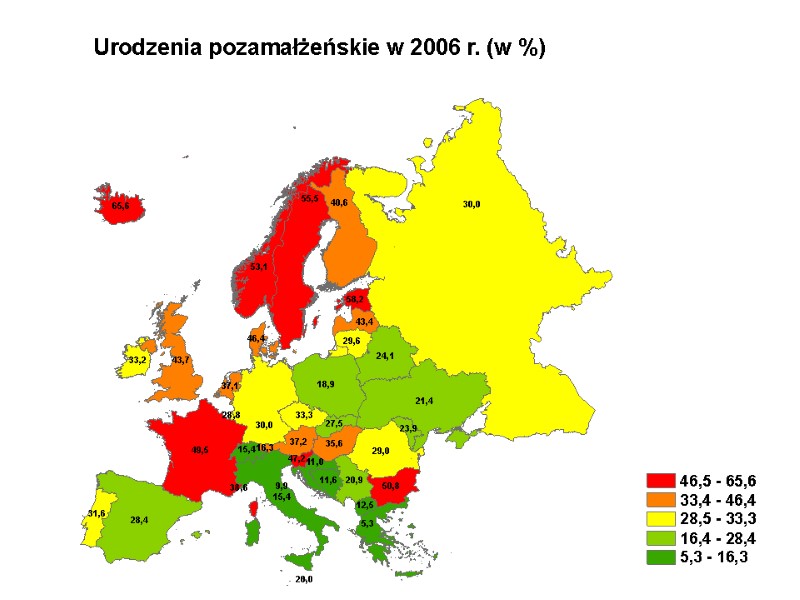
Podsumowanie spadek dzietności poniżej poziomu gwarantującego zastępowalność pokoleń odkładanie urodzeń wzrost urodzeń pozamałżeńskich 3 regiony o zróżnicowanej dzietności (Europa Płn. i Zach., Europa Płd. oraz Europa Środk.-Wsch.) dyfuzja przemian związanych z drugim przejściem demograficznym odwrócenie niekorzystnego trendu w krajach Europy Pn. i Zach. wzrost znaczenia polityki prorodzinnej konsekwencje niskiej płodności: starzenie się społeczeństw depopulacja
Female sex ratio in 2006 Source: World Population Data Sheet 2006
Highest and lowest female sex ratio in 2006
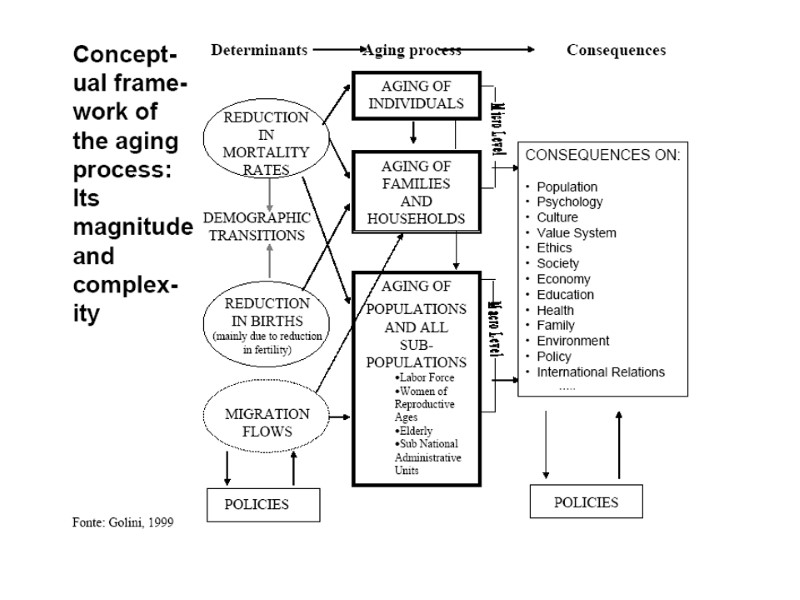
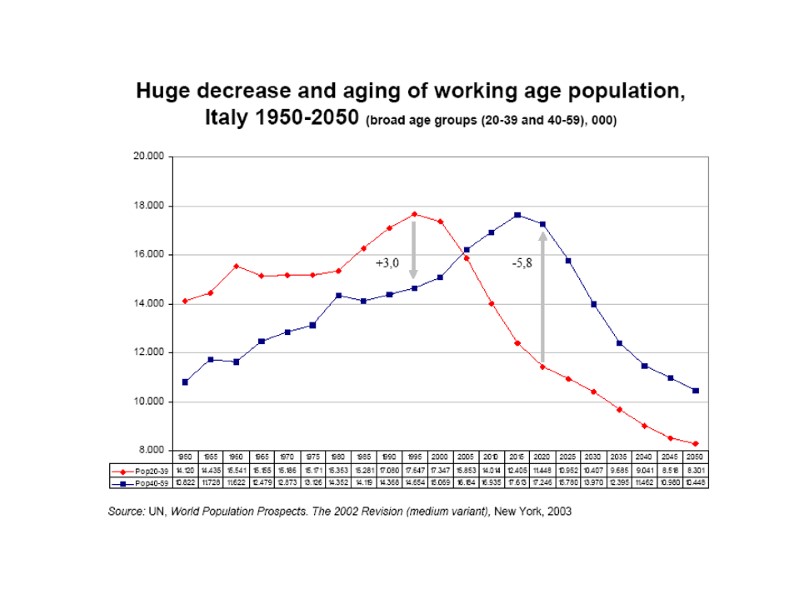
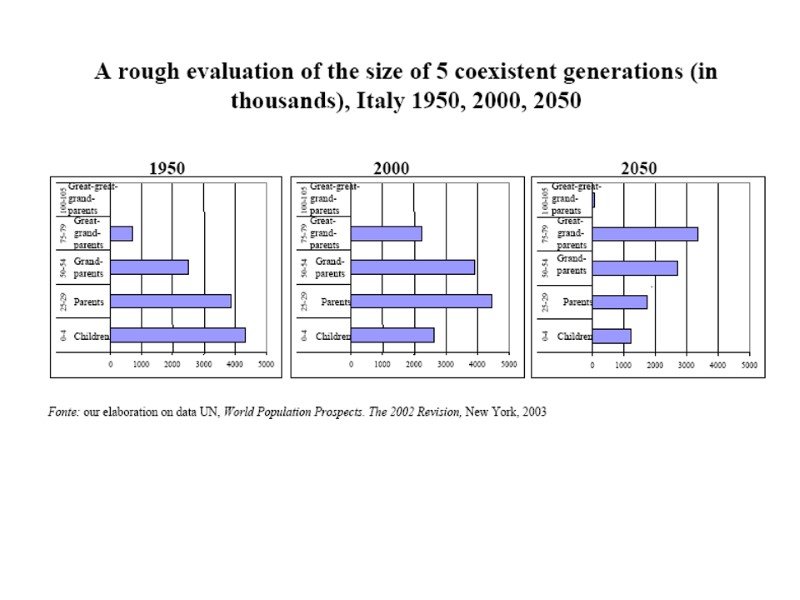
Source: GoliniThe changing age structure of population and its consequences for development Panel discussion – Thursday, 12 October 200 Dag Hammarskjold Library Auditorium of United Nations
Source: Stutz, Warf. World Economy.
POPULATION AGED UNDER 15 (%)
POPULATION AGED UNDER 15 (%)
POPULATION AGED 65+ (%)
POPULATION AGED 65+ (%)
Udział ludności w wieku 0-14 oraz 60+ w regionach bardziej i słabiej rozwiniętych, 1950-2050. (Wariant średni prognozy) Source: World Population Prospects, The 1998 Revision, Volume II: Sex and Age. The Population Division, Department of Economic and Social Affairs, United Nations Secretariat
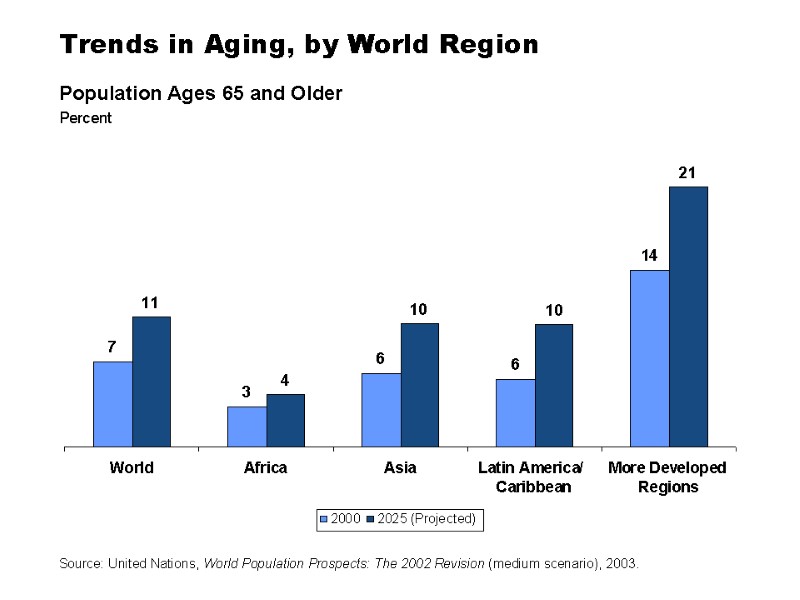
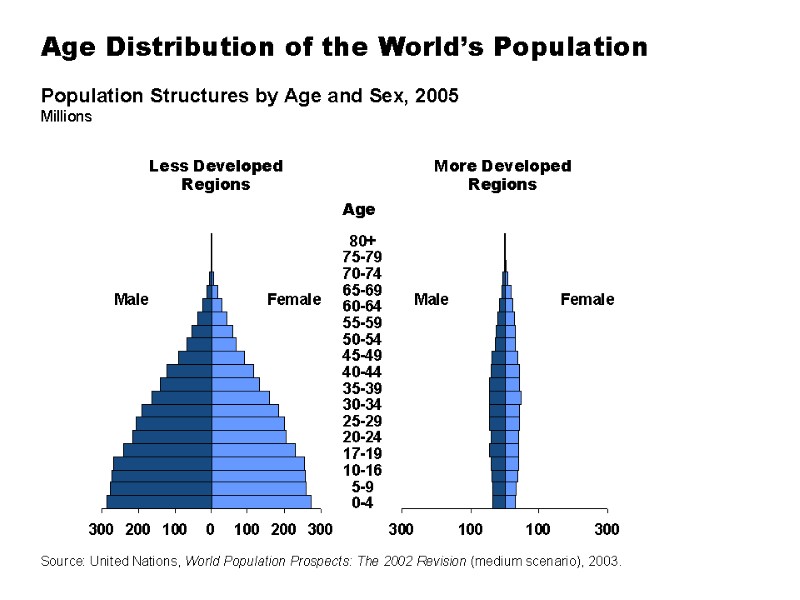
Source: World Population Ageing: 1950-2050, UN, 2002
Three centuries of world population ageing Source: Long-Range World Population Projections: Based on the 1998 Revision. The Population Division, Department of Economic and Social Affairs, United Nations Secretariat
Percentage Increase in Age 60 and Over by Region, 2000-2050 Source: World Population Prospects, The 1998 Revision, Volume II: Sex and Age. The Population Division, Department of Economic and Social Affairs, United Nations Secretariat
Source: World Population Ageing: 1950-2050, UN, 2002
Struktura wskaźnika obciążenia ekonomicznego: regiony bardziej i słabiej rozwinięte, 1950-2050 Source: World Population Ageing: 1950-2050, UN, 2002
Source: World Population Ageing: 1950-2050, UN, 2002
The median age of Europe is double that of Africa Source: World Population Ageing: 1950-2050, UN, 2002
Median Age by Region, 1999-2050 Source: World Population Prospects, The 1998 Revision, Volume II: Sex and Age. The Population Division, Department of Economic and Social Affairs, United Nations Secretariat
Source: World Population Ageing: 1950-2050, UN, 2002
Source: World Population Ageing: 1950-2050, UN, 2002
Source: World Population Ageing: 1950-2050, UN, 2002
Source: World Population Ageing: 1950-2050, UN, 2002
Source: World Population Ageing: 1950-2050, UN, 2002
Source: World Population Ageing: 1950-2050, UN, 2002