

e998c43782a00703306c47bb66f21c25.ppt
- Количество слайдов: 30
 National Innovation Systems in Perspective: The Performance of the Portuguese NIS Manuel Mira Godinho (ISEG/Technical University of Lisbon and CISEP) Paper presented to «The Network Society and the Knowledge Economy: Portugal in the Global Context» Seminar promoted by His Excellence The President of the Portuguese Republic Lisbon, 5 -6 March 2005
 Structure of the presentation: 1. NIS: The Concept 2. Analytical Framework 3. Framework deployment 4. The Portuguese NIS 5. Concluding Remarks
 • • Diversity of actors Links and") 1. National Innovation Systems (the NIS concept) • • Diversity of actors Links and communication Density of interactions Production and distribution of knowledge Other resources (labour, finance…) Learning dynamics History and previous conditions Institutions
1. National Innovation Systems (the NIS concept) • • Diversity of actors Links and communication Density of interactions Production and distribution of knowledge Other resources (labour, finance…) Learning dynamics History and previous conditions Institutions
 2. The Analytical Framework • • 4 groups of factors 8 dimensions 29 variables 69 countries
 4 groups of factors and 8 dimensions 1. Preconditions 1. 1. market conditions 1. 2. institutional conditions 2. System Inputs 2. 1 intangible and tangible investments 2. 2. basic and applied knowledge 3. Structural organization 3. 1. economic structure 3. 2. external communication 4. System outputs 4. 1. diffusion 4. 2. innovation
 Dimension 1 - “Market conditions” -Income per capita -Overall GDP size -Population density 8 dimensions 29 indicators Dimension 2 - “Institutional conditions” -GINI index -Youth of population -Life expectancy -Corruption index Dimension 3 - “Intangible and tangible investment” -Education expenditures as a percentage of GDP -Education expenditures per capita -GERD as a percentage of GDP -GERD per capita -Investment rate (GFCF as a percentage of GDP) Dimension 4 - “Knowledge” -Population with 2+3 Education as a percentage of total population -Researchers as a percentage of labour force -Scientific papers per Capita
") Dimension 5 - “Economic structure” -Value Added in High-Tech & Medium High-Tech Activities (%) -High-Tech & Medium High-Tech Exports (%) -Sales of home-based top 500 global R&D companies / Dimension 6 - “External communication” GDP -(Exports + Imports) / GDP -(Inward + Outward stocks of FDI) / GDP -Bandwidth in international connections (bits per Capita) Dimension 7 - “Diffusion” -Personal Computers per capita -Internet Hosts per capita -Internet Users per capita -Cellular Phones per capita -ISO 9000 + ISO 14000 Certificates per capita Dimension 8 - “Innovation” -US Patents per Capita -Trademarks per Capita 8 dimensions 29 indicators
Dimension 5 - “Economic structure” -Value Added in High-Tech & Medium High-Tech Activities (%) -High-Tech & Medium High-Tech Exports (%) -Sales of home-based top 500 global R&D companies / Dimension 6 - “External communication” GDP -(Exports + Imports) / GDP -(Inward + Outward stocks of FDI) / GDP -Bandwidth in international connections (bits per Capita) Dimension 7 - “Diffusion” -Personal Computers per capita -Internet Hosts per capita -Internet Users per capita -Cellular Phones per capita -ISO 9000 + ISO 14000 Certificates per capita Dimension 8 - “Innovation” -US Patents per Capita -Trademarks per Capita 8 dimensions 29 indicators
 69 Countries • Developed, emerging and developing economies • Countries with > 20 million inhabitants • Overall: 87. 4% of the world population
 3. Framework deployment • Aggregation procedure • Mapping and map analysis • NIS Ranking • Cluster analysis • NISs taxanomy
 Aggregation procedure • • Between 2 and 6 indicators per dimension Weight of each indicator: 1; 0, 5 Standardisation of indicators In each dimension 0 value ≈ sample mean
 Mapping… … and benchmarking
 Analysis: NIS “evenness” etc.
 NIS ranking 1. Switzerland 2. Sweden 3. Netherlands 1, 15 24. Hungary 1, 13 25. Czech R. 0, 91 26. Slovenia 0, 27 47. India 0, 23 48. Turkey 0, 23 49. Ukraine -0, 39 -0, 42 -0, 43 4. Denmark 5. Finland 6. Hong Kong 7. United Kingdom 8. United States 9. Singapore 10. Japan 11. Germany 12. Ireland 13. Korea (R. of) 14. France 15. Taiwan 0, 90 0, 88 0, 86 0, 85 0, 81 0, 67 0, 62 0, 60 27. New Zealand 28. Portugal 29. Malta 30. Malaysia 31. Slovak R. 32. Greece 33. China 34. Estonia 35. Poland 36. Mexico 37. Cyprus 38. Thailand 0, 21 0, 13 0, 05 0, 00 -0, 07 -0, 10 -0, 11 -0, 12 -0, 23 -0, 26 50. Egypt 51. Romania 52. Venezuela 53. Bulgaria 54. Indonesia 55. Morocco 56. Viet Nam 57. Colombia 58. Algeria 59. Peru 60. Iran (I. R. ) 61. Bangladesh -0, 43 -0, 45 -0, 52 -0, 56 -0, 58 -0, 59 -0, 63 -0, 67 -0, 68 -0, 75 -0, 77 16. Austria 17. Norway 18. Belgium 19. Spain 20. Canada 21. Italy 22. Austrália 23. Luxembourg 0, 57 0, 51 0, 50 0, 44 0, 40 0, 38 39. Brazil 40. Lithuania 41. Chile 42. Russia 43. Latvia 44. Argentina 45. South Africa 46. Philippines -0, 27 -0, 29 -0, 30 -0, 35 -0, 36 62. Pakistan 63. Nigeria 64. Kenya 65. Ethiopia 66. Myanmar 67. Tanzania 68. D. R. Congo 69. Sudan -0, 82 -0, 89 -0, 94 -0, 97 -0, 98 -0, 99 -1, 05 -1, 06
 Cluster analysis Object of the analysis • 69 countries X 8 NIS dimensions Results’ interpretation led to a three-level structure • 1 st level 2 “Mega-clusters” • 2 nd level 6 “Clusters” • 3 rd level 15 “Sub-clusters”
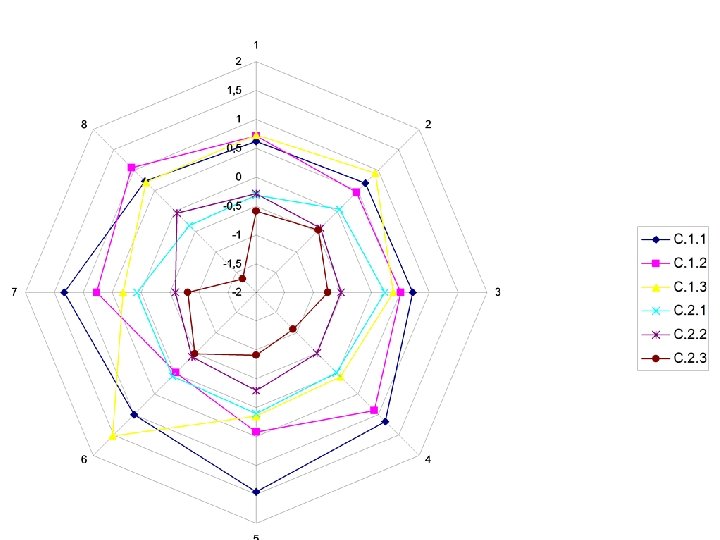
 1 st and 2 nd level Groups Megacluster 1 – Developed NIS Cluster 1. 1 – Dynamic innovation systems Cluster 1. 2 – Performing innovation systems Cluster 1. 3 – Unevenly developed NISs Megacluster 2 – Developing NIS Cluster 2. 1 – Catching up NISs Cluster 2. 2 – Hesitating NISs Cluster 2. 3 – Unformed NISs
 MEGACLUSTERS SUBCLUSTERS Groups of Countries M. 0. Hong-Kong C. 0") 3 rd level (a) MEGACLUSTERS SUBCLUSTERS Groups of Countries M. 0. Hong-Kong C. 0 G 1 M. 1. C. 1. 1 Ireland + Netherlands + Switzerland + Finland + Singapore + Sweden G 2 S. C. 1. 2. 1 Germany + UK + France + Italy + South Korea + Taiwan G 3 S. C. 1. 2. 2 U. S. + Japan G 4 S. C. 1. 2. 3 Canada + Norway + Australia + Austria + New Zealand + Spain G 5 C. 1. 2 C. 1. 3 Denmark +Belgium + Luxembourg G 6
3 rd level (a) MEGACLUSTERS SUBCLUSTERS Groups of Countries M. 0. Hong-Kong C. 0 G 1 M. 1. C. 1. 1 Ireland + Netherlands + Switzerland + Finland + Singapore + Sweden G 2 S. C. 1. 2. 1 Germany + UK + France + Italy + South Korea + Taiwan G 3 S. C. 1. 2. 2 U. S. + Japan G 4 S. C. 1. 2. 3 Canada + Norway + Australia + Austria + New Zealand + Spain G 5 C. 1. 2 C. 1. 3 Denmark +Belgium + Luxembourg G 6
 MEGACLUSTERS M. 2. CLUSTERS C. 2. 1 SUBCLUSTERS Groups of") 3 rd level (b) MEGACLUSTERS M. 2. CLUSTERS C. 2. 1 SUBCLUSTERS Groups of Countries G 7 S. C. 2. 1. 2 Malaysia + Malta G 8 S. C. 2. 1. 3 Latvia + Estonia + Lithuania + Slovak R. + Ukraine C. 2. 2 S. C. 2. 1. 1 Portugal + Greece + Poland + Hungary + Czech R. + Slovenia G 9 G 10 S. C. 2. 2. 1 China + Brazil + South Africa + Thailand + Argentina + India + Mexico G 11 S. C. 2. 2. 3 Turkey + Colombia + Bulgaria + Indonesia + Philippines + Peru + Romania G 12 S. C. 2. 2. 4 Egypt + Cyprus + Chile + Venezuela C. 2. 3 S. C. 2. 2. 1 Russia G 13 S. C. 2. 3. 1 Algeria+Vietnam+Iran+ Morocco+Bangladesh G 14 S. C. 2. 3. 2 Pakistan+Kenya+Ethiopia+ Myanmar+Tanzania+Sudan+ Nigeria+ D. R. Congo G 15
3 rd level (b) MEGACLUSTERS M. 2. CLUSTERS C. 2. 1 SUBCLUSTERS Groups of Countries G 7 S. C. 2. 1. 2 Malaysia + Malta G 8 S. C. 2. 1. 3 Latvia + Estonia + Lithuania + Slovak R. + Ukraine C. 2. 2 S. C. 2. 1. 1 Portugal + Greece + Poland + Hungary + Czech R. + Slovenia G 9 G 10 S. C. 2. 2. 1 China + Brazil + South Africa + Thailand + Argentina + India + Mexico G 11 S. C. 2. 2. 3 Turkey + Colombia + Bulgaria + Indonesia + Philippines + Peru + Romania G 12 S. C. 2. 2. 4 Egypt + Cyprus + Chile + Venezuela C. 2. 3 S. C. 2. 2. 1 Russia G 13 S. C. 2. 3. 1 Algeria+Vietnam+Iran+ Morocco+Bangladesh G 14 S. C. 2. 3. 2 Pakistan+Kenya+Ethiopia+ Myanmar+Tanzania+Sudan+ Nigeria+ D. R. Congo G 15
 Sub-cluster 2. 2. 2
 NIS taxonomy Contingency factors • Innovation vs. diffusion • Country Size • Geography and natural endowments
 Critical dimensions (Innovation, Diffusion…) Absolute high values Absolute Low values Megaclusters") NIS taxonomy (1) Critical dimensions (Innovation, Diffusion…) Absolute high values Absolute Low values Megaclusters M. 1 M. 2 Clusters and subclusters Relatively Relatively Relativel y High in y Low in Low both High in Low in y Low Innovati in Innovation both in on and Innovatio n and High Innovatio Low in High in n and Low in in n and Diffusion Diffusion Count ry Critic Size al Large/ /Very large Small/ /medium contin gency Good natural facto rs resources endowment C. 1. 2 C. 2. 2. C. 1. 1 C. 1. 3 ↓(DK) Subclu st. 1. 2. 3 C. 2. 1 C. 2. 3 ↑ (Nigeri a,
NIS taxonomy (1) Critical dimensions (Innovation, Diffusion…) Absolute high values Absolute Low values Megaclusters M. 1 M. 2 Clusters and subclusters Relatively Relatively Relativel y High in y Low in Low both High in Low in y Low Innovati in Innovation both in on and Innovatio n and High Innovatio Low in High in n and Low in in n and Diffusion Diffusion Count ry Critic Size al Large/ /Very large Small/ /medium contin gency Good natural facto rs resources endowment C. 1. 2 C. 2. 2. C. 1. 1 C. 1. 3 ↓(DK) Subclu st. 1. 2. 3 C. 2. 1 C. 2. 3 ↑ (Nigeri a,
 Critical dimensions (Innovation, Diffusion…) Absolute high values Absolute Low values Megaclusters") NIS taxonomy (2) Critical dimensions (Innovation, Diffusion…) Absolute high values Absolute Low values Megaclusters M. 1 M. 2 Clusters and subclusters Relatively y High in y Low in Low both High in Innovatio n and Innovatio n and Low in High in n and Low in Diffusion Critic al contin -gency Large/ Countr /Very y Size large Small/ /medium factor Good natural s resources endowment C. 1. 2 Relatively Low in Innovation and High in Diffusion Relativel y Low both in Innovatio n and Diffusion C. 2. 1 C. 2. 3 C. 2. 2. C. 1. 1 C. 1. 3 ↓(DK) Subclus t. 1. 2. 3 ↑ (Nigeria, others?
NIS taxonomy (2) Critical dimensions (Innovation, Diffusion…) Absolute high values Absolute Low values Megaclusters M. 1 M. 2 Clusters and subclusters Relatively y High in y Low in Low both High in Innovatio n and Innovatio n and Low in High in n and Low in Diffusion Critic al contin -gency Large/ Countr /Very y Size large Small/ /medium factor Good natural s resources endowment C. 1. 2 Relatively Low in Innovation and High in Diffusion Relativel y Low both in Innovatio n and Diffusion C. 2. 1 C. 2. 3 C. 2. 2. C. 1. 1 C. 1. 3 ↓(DK) Subclus t. 1. 2. 3 ↑ (Nigeria, others?
 4. The Portuguese NIS. . . …somewhere in-between 1. Market 2. Institutio ns 3. Investme nt 4. Knowled ge 5. Structure 6. Opennes s 7. Diffusion 8. Innovatio
 …and NIS neighbours
 Evolution of the Portuguese NIS 1996 -2000 -2004 1. Market 2. Institutio ns 3. Investme nt 4. Knowled ge 5. Structure 6. Opennes s 7. Diffusion
") Portuguese NIS: Recent evolution of the “Knowledge” dimension (#4)
Portuguese NIS: Recent evolution of the “Knowledge” dimension (#4)
") Portuguese NIS: Recent evolution of the “Diffusion” dimension (#7)
Portuguese NIS: Recent evolution of the “Diffusion” dimension (#7)
 Investment (+) Diffusion (+) Knowledge") Concluding Remarks • NIS Dualism • Stronger aspects (+) Investment (+) Diffusion (+) Knowledge
Concluding Remarks • NIS Dualism • Stronger aspects (+) Investment (+) Diffusion (+) Knowledge
 Structure (-) Openness (-) Institutions") Concluding Remarks Weaker aspects (-) Structure (-) Openness (-) Institutions
Concluding Remarks Weaker aspects (-) Structure (-) Openness (-) Institutions
 Concluding Remarks “Frontier” sub-cluster Further catching up? Or falling behind? Need of adaptation: Economic structure FDI, links abroad Innovation (IPR…)