8d438306acd82ad40912b8c13b819ef3.ppt
- Количество слайдов: 115

MZA GSB Drivers of the Global Economy Marvin Zonis, Professor Graduate School of Business University of Chicago zonis@mza-inc. com

The Global Drivers MZA Ø Ø Ø Ø Ø Globalization Technology Consolidation of Market Economies: The Spread of Market-Friendly Reforms The Reduction of Strategic Challenges Terrorism The Diminishing Power of the State Demography Failed States The Miracle of Economic Growth Global Warming 1

MZA The Global Drivers Globalization 2

MZA Globalization entails the increasing volume and variety of cross-border flows of goods and services and capital flows and people and the relentless rise of similar standards across the globe. The flows are driven by the diffusion and acceleration of technology and the diffusion of American popular culture and by the dictates of industrial and commercial economic organizations. Globalization is driven by companies in their relentless search for market share and profits. Companies are at the heart of globalization. 3

The Boom in Cultural Exports MZA Source: UNESCO “Cultural goods are the result of individual or collective creativity, include printed matter and literature, music, visual arts, cinema and photography, radio and television, games and sporting goods. ” 4

MZA Globalization – How much? Capital flows to emerging markets $21 billion in 1970 $190 billion in 2000 Foreign direct investment flows $44 billion in 1970 ~$ 1 trillion in 2000 World trade $311 billion in 1950 $7. 5 trillion in 2000 985 in 1956 40, 000 in 2000 International NGOs and Non-Profits 5 Sources: UN World Investment Report, Institute for International Finance, UNCTAD, IMF World Economic Outlo Union of International Assoc. , World Health Org

MZA Integration of the World Economy in the 1990 s Monthly Growth Rates 6

Average Tariffs on Imported Manufactured Goods MZA (Per cent) 1875 1913 1931 1950 Pre. Uruguay Round France 12 -15 20 30 18 -- Germany 4 -6 17 21 26 Italy 8 -10 18 46 25 UK 0 0 n. a. 23 -- -- 40 -50 44 48 14 EU US 7 Post. Uruguay Round -- -- 5. 7 3. 6 4. 6 3. 0

Total Trade to GDP (current prices, %) MZA 1870 1910 1950 1995 UK 41 44 30 57 France 33 35 23 43 Germany 37 38 27 46 Italy 21 28 21 49 Denmark 52 69 53 64 US 14 11 9 24 Canada 30 30 37 71 Japan 10 30 19 17 8

MZA Total Corporate Foreign Assets Relative to World GDP (percent) Year Percentage 1870 6. 9 1900 18. 6 1914 17. 5 1930 8. 4 1945 4. 9 1960 6. 4 1980 17. 7 1995 56. 8 9 Source: Crafts, 2000

MZA Rise and Rise of Multi-national Companies ($billions) 1982 1990 1999 594 1, 761 4, 772 2, 462 5, 503 13, 564 Gross product of foreign affiliates 565 1, 419 3, 045 Exports of foreign affiliates 637 1, 165 3, 167 GDP at factor cost 10, 611 21, 473 30, 061 2, 041 4, 173 6, 892 FDI inward stock Sales of foreign affiliates Exports of goods and non-factor services Source: UN 2000 10

The World’s top 25 TNCs MZA ranked by foreign assets 1998 ($US billions) Ranking Assets source: UNCTAD Sales Employment Foreign Assets Corporation Country Foreign Total 1 General Electric United States 128. 6 355. 9 28. 7 100. 5 130, 000 293, 000 2 General Motors United States 73. 1 246. 7 49. 9 155. 5 … 396, 000 3 Royal Dutch/Shell Group Netherlands/UK 67. 0 110. 0 50. 0 94. 0 61, 000 102, 000 4 Ford Motor Cmpany United States … 237. 5 43. 8 144. 4 171, 276 345, 175 5 Exxon Corp United States 50. 1 70. 0 92. 7 115. 4 … 79, 000 6 Toyota Japan 44. 9 131. 5 55. 2 101. 0 113, 216 183, 879 7 IBM United States 43. 6 86. 1 46. 4 81. 7 149, 934 291, 067 8 BP Amoco United Kingdom 40. 5 54. 9 48. 6 68. 3 78, 950 98, 900 9 Daimler. Chrysler Germany 36. 7 159. 7 125. 4 154. 6 208, 502 441, 502 10 Nestle SA Switzerland 35. 6 41. 1 51. 2 52. 0 225, 665 231, 881 11 Volkswagen Group Germany … 70. 1 52. 3 80. 2 142, 481 297, 916 12 Unilever Netherlands/UK 32. 9 35. 8 39. 4 44. 9 240, 845 265, 103 13 Suez Lyonnaise Des Eaux France … 84. 6 12. 9 34. 8 126, 500 201, 000 14 Wal-Mart Stores United States 30. 2 50. 0 19. 4 137. 6 … 910, 000 15 ABB Switzerland … 32. 9 23. 1 27. 7 154, 263 162, 793 16 Mobil Corporation United States … 42. 8 29. 7 53. 5 22, 100 41, 500 17 Diageo Plc United Kingdom 27. 9 46. 3 10. 5 12. 4 65, 393 77, 029 18 Honda Motor Co Ltd Japan 26. 3 41. 8 29. 7 51. 7 … 112, 200 19 Siemens AG Germany … 66. 8 45. 7 66. 0 222, 000 416, 000 20 Sony Corporation Japan … 52. 5 40. 7 56. 6 102, 468 173, 000 21 Renault SA France 23. 6 43. 2 25. 4 39. 8 92, 854 138, 321 22 News Corporation Australia 22. 9 33. 6 10. 5 11. 7 … 50, 000 23 BMW AG Germany 22. 9 35. 7 26. 8 37. 7 53, 107 119, 913 24 Mitsubishi Corporation Japan 21. 7 74. 9 435. 116. 1 3, 668 11, 650 25 Nissan Motor Co Ltd Japan 21. 6 57. 2 25. 8 54. 4 … 131, 260 11

The top 25 TNCs from developing economies MZA ranked by foreign assets, 1998 ($US millions) Ranking Assets source: UNCTAD Sales Employment Foreign Assets Corporation Economy Foreign Total 1 Petroleos de Venezuela S. A. Venezuela 7, 926 48, 816 11, 003 25, 659 6, 026 50, 821 2 Daewoo Corporation Republic of Korea … 22, 135 … 30, 547 … 15, 000 3 Jardine Matheson Holdings Ltd Hong Kong (China)/Bermuda 5, 954 9, 565 7, 921 11, 230 … 160, 000 4 Cemex S. A. Mexico 5, 639 10, 460 2, 334 4, 315 9, 745 19, 761 5 PETRONAS – Petrolium Nasional Berhad Malaysia 5, 564 26, 184 3, 757 11, 133 2, 700 18, 578 6 Sappi Limited South Africa 4, 574 6, 475 3, 246 4, 308 10, 725 23, 640 7 Hutchison Whampoa Hong Kong (China) … 13, 389 2, 191 6, 639 20, 845 39, 860 8 First Pacific Company Ltd Hong Kong (China) 4, 086 7, 646 2, 527 2, 894 15, 063 30, 673 9 Sunkyong Group Republic of Korea 3, 851 36, 944 12, 029 38, 274 2, 400 29, 000 10 Petroleo Brasileiro S. A. - Petrobas Brazil 3, 700 33, 180 1, 300 15, 520 417 42, 137 11 New World Development Co. Hong Kong (China) 3, 414 13, 465 376 2, 628 30 16, 512 12 China State Construction Engineering Corp. China 3, 290 7, 300 1, 950 5, 890 5, 535 239, 102 13 YPF Sociedad Anonima Argentina 3, 278 13, 146 880 5, 500 1, 754 9, 486 14 LG Electronics, Inc Republic of Korea 3, 127 12, 824 4, 841 12, 213 27, 819 60, 753 15 China National Chemicals Import & Export Corp. China 3, 000 4, 950 7, 920 13, 800 510 8, 415 16 Keppel Corp. Ltd. Singapore 2, 598 17, 321 376 2, 127 1, 700 119, 000 17 Companhia Vale do Rio Doce Brazil 1, 947 13, 539 3, 025 4, 321 7, 076 40, 334 18 Hyundai Engineering & Construction Co. Republic of Korea … 7, 094 … 3, 815 … 22, 787 19 Citic Pacific, Ltd Hong Kong (China) 1, 842 8, 771 908 1, 755 7, 639 11, 871 20 Enersis, S. A. Chile 1697 16117 306 3406 9342 14336 21 Guangdong Investment Ltd. Hong Kong (China) 1695 2577 614 812 16015 17330 22 San Miguel Corporation Philippines 1676 3552 287 1811 4338 15923 23 Samsung Electronics Co. , Ltd Republic of Korea … 17213 … 16640 … 42154 12

MZA Globalization: How Much? Capital Flows to US 13

MZA Globalization: How Much? Portfolio Flows to US 14

FDI in the US MZA In Millions of dollars; not seasonally adjusted; outflows(-) 2000 1998 1999 2000 I All countries 181, 764 271, 169 47, 946 99, 968 72, 357 91, 628 311, 899 European Union 153, 572 228, 079 34, 339 73, 219 57, 966 55, 174 220, 697 7, 563 9, 529 -546 1, 328 6, 970 4, 959 12, 710 Japan 2000 III 2000 IV Total Source: US Dept of Commerce, Bureau of Economic Analysis 15

MZA U. S. Current Account & Saving Rate 01 16 Source: Deutsche Bank

U. S. Real Economic Growth MZA % ‘ 01 Source: US Dept of Commerce 17

MZA Growth in USA IT Investment Source: Leto Research 18

MZA Labor Productivity and GDP per capita Growth Sources: Federal Reserve Bank of Texas, US Depts. of Commerce, and Labor 19

MZA Global Oil Supply Source: The Pterolium Finance Company 20

MZA OPEC Crude Oil Export Revenues 1972 – 2001 Source: EIA 21

MZA OPEC – Per Capita Crude Oil Export Revenues (Constant $2000) Source: EIA 22

The Disruptions from Globalization MZA Globalization is everywhere disruptive • • Globalization disrupts ideologies Globalization disrupts economies Globalization diminishes national sovereignty Globalization disrupts ways of living 23

MZA The Backlash to Globalization 1900 – China The Boxer Rebellion, “Support the Ch’ing; Destroy the foreigner!” 24

MZA The Global Drivers Technology 25

MZA The Rise of Technology Source: Robert Fogel 26

MZA Exponential Growth: Technology Source: Robert Fogel 27

MZA Plunging Costs: 1920 -1990 Source: World Bank 28

Technology Evolution MZA In 1959, a single transistor cost about $6. 00. Today, a 16 megabit DRAM chip, containing 16 million transistors, costs the same $6. 00. 29

MZA Evolution of Semiconductors 30

MZA Moore’s Law 31

MZA The Global Drivers Consolidation of Market Reforms 32

MZA Improving the Market Oriented Regulatory Environment 1991 -1999 33

MZA Number of days and procedures to start a business 34

MZA The Cost To Start a Business 35

Informal labor force in urban areas (selected countries) MZA Country Year Percentage of total employment Total Men Women Bolivia 1996 57 53 62 Chile 1997 30 32 27 Colombia 1996 53 54 53 Cote d’Ivoire 1996 53 37 73 Ecuador 1997 40 39 42 Ethiopia 1996 33 19 53 Gambia 1993 72 66 83 Madagascar 1994 43 43 43 Mexico 1996 35 36 34 Peru 1996 51 50 52 Philippines 1995 17 16 19 South Africa 1995 17 11 26 Tanzania 1995 67 60 85 Uganda 1993 84 68 81 36 Source: International Labor Organization

MZA Average Size of the Shadow Economy Countries 1990 -1993 Nigeria and Egypt Tunisia and Morocco Chile, Costa Rica, Venezuela, Brazil, Paraguay and Colombia 25 -35% 70% Philippines, Sri Lanka, Malaysia, South Korea 38 -50% Hong Kong and Singapore 13% Georgia, Azerbaijan, Ukraine, Belarus 28 -43% Russia, Lithuania, Latvia, Estonia 20 -27% Hungary, Bulgaria, Poland 20 -28% Romania, Slovakia, Czech Republic 7 -16% Greece, Italy, Spain, Portugal and Belgium Developed Countries 40 -60% Thailand Transition Countries 39 -45% Guatemala, Mexico, Peru and Panama Developing Countries 68 -76% 24 -30% Sweden, Norway, Denmark, Ireland, France, the Netherlands, Germany, Great Britain 13 -23% Japan, United States, Austria, Switzerland 8 -10% 37 Source: Schneider and Enste

Implications of an Informal Economy MZA Undemocratic Decision-making and Misguided Policies Distorts resource Allocation and lowers Productivity Erodes Competitiveness Lack of Access To and Higher Costs For Essential Public Services Less Government Revenue for Public Services Lack of Information and Lack of Transparency Invite Corruption Weakens the Credibility of Political Institutions and Democracy Wastes Resources and Hinders Growth Increases and Reinforces Poverty and Inequality Weakens Trade Union Power and Erodes Workers’ Benefits Inaccurate Contributions to International and Regional Organizations 38 Source: Center for International Private Enterprise

MZA Dead Capital in Real Estate Worldwide (1997) 39 Source: Hernando de Soto, The Mystery of Capital

MZA Procedures to Formalize Informal Urban Property--The Philippines 40

MZA Procedures to Gain Access to Desert Land for Building Purposes and to Register Property Rights in Egypt (6 -14 Years) 41

MZA The Global Drivers Reduction of Strategic Challenges 42

The 15 Major Military Spenders in 1999 MZA ($US billion, 1995 prices) 43

MZA The US Military in Decline? Source: The Economist, Feb. 17, 2001 44

MZA World Nuclear Arsenals 45

Major Conventional Weapons: 1999 MZA (constant 1990 dollars in millions) 46

MZA China 47

Russia MZA 48

MZA India, Pakistan and Kashmir 49

Israel MZA 50

Israel/Palestine Stats MZA GDP (PPP) 1999 ISRAEL: $105. 4 BILLION WEST BANK: $3. 3 BILLION GAZA: $1. 17 BILLION ISRAEL: WEST BANK: GAZA: GDP PER CAPITA (PPP) 1999 ISRAEL: WEST BANK: GAZA: INFANT MORTALITY RATE X DEATHS PER 1, 000 LIVE BIRTHS (2000 ESTIMATE) $18, 300 $2, 050 $1, 060 7. 9 DEATHS 22. 33 DEATHS 25. 97 DEATHS TELEPHONES: MAIN LINES IN USE (1999) ISRAEL: 2. 8 MILLION WEST BANK AND GAZA: 95, 729 INTERNET SERVICE PROVIDERS (ISPs) 1999 ISRAEL: 23 WEST BANK AND GAZA: 3 51

Israeli-developed Jerusalem MZA 52

West Bank MZA Israeli Settlements Palestinian Towns Areas jointly controlled by Israel and the Palestinians Palestinian controlled areas 53

Gaza Strip MZA 54

Israel Water Crisis MZA 55

MZA The Global Drivers Terrorism 56

MZA The Bush Administration Donald Rumsfeld Defense Secretary Condoleezza Rice National Security Advisor Colin Powell Secretary of State John Ashcroft General Paul O’Neill Treasury Secretary Gale Norton Interior Secretary 57 Spencer Abraham Energy Secretary At

MZA Terrorism: USS Cole Source: Reuters 58

MZA World Terrorist Attacks, 1980 -1999 Source: State Department, Patterns of Global Terrorism 1999 59

MZA Total International Attacks by Region, 94 -99 Source: State Department, Patterns of Global Terrorism 1999 60

MZA Total Facilities Struck by International Terrorist Attacks, 1994 -99 Source: State Department, Patterns of Global Terrorism 1999 61

Bashar al-Assad, President of Syria MZA We all know the suffering and agonies inflicted on Jesus by those who rejected the commandments of God and the human principles and values preached by Jesus – foremost along them, love, tolerance and equality among people. Jesus wanted his disciples to continue to spread these principles and to protect people from the suffering he had undergone. And there is no doubt, Your Holiness, that you, on the Papal throne in Rome, embody the responsibility for sustaining these values. This is enormously important because there are those who persist in keeping mankind on the path of the agony and torture [suffered by Jesus]. . . We see our brothers in Palestine killed and tortured, and we see justice violated by occupation of the lands of Lebanon, the Golan, and Palestine. . . We witness them [the Israelis] murdering the principle of equality by claiming that God singled them out and desecrating the holy places of Islam and Christianity in Palestine. . . They are trying to damage and destroy all the principles of the monotheistic religions with the same mentality that led them to betray and torture Jesus and with the same mentality that led them to try to kill the Prophet Muhammad. -Bashar al-Assad May 5, 2001 62

MZA Afghanistan 63

64 Y Source: New ork Times MZA Afghanistan

The Darunta Camp Complex MZA In eastern Afghanistan, where militants are taught terrorism New York Times, 1/16/01 65

MZA India, Pakistan and Kashmir 66

MZA The Global Drivers The Diminishing Power of the State 67

MZA The Diminishing Power of the State March 24 th, 1999: w The UK's highest court upholds Chilean ex-President Augusto Pinochet's arrest w NATO strikes against Serbian targets in Yugoslavia begin 68

MZA The Diminishing Power of the State Assault on state sovereignty from above – supranational organizations: w NATO w EU w WTO w IMF 69

MZA The Diminishing Power of the State Assault on state sovereignty from below – regionalism and ethnic identification: w Quebec and Canada w The Walloon and Flemish separatists and Belgium w Kurds and Turkey w East Timor and Indonesia w Corsica and France w Basques and Spain 70

MZA The Diminishing Power of the State Assaults to state sovereignty from business: Total sales of Largest TNCs versus GDP of selected countries (in billions of US$) 71

MZA The Global Drivers Demography 72

MZA World Population Chart Population mid-2000 (millions) Natural Increase (annual, %) Projected Population (millions), 2025 2050 WORLD 6, 067 1. 4 7, 810 9, 039 More Developed 1, 184 0. 1 1, 236 1, 232 Less Developed 4, 883 1. 7 6, 575 7, 808 Less Developed (excluding China) 3, 619 1. 9 5, 144 6, 439 Source: Population Reference Bureau 73

Population, by Country MZA Natural Increase (millions) (annual, %) Projected Population (millions) 2025 Projected Population (millions) 2050 Brazil 170. 115 1. 540 221. 241 244. 230 China 1, 264. 536 0. 877 1, 431. 000 1, 369. 000 Congo, Dem. Rep. Of 51. 965 3. 190 105. 301 181. 923 Egypt 68. 344 1. 980 97. 431 117. 121 Germany 82. 141 -0. 098 80. 238 73. 303 India 1, 002. 142 1. 800 1, 363. 000 1, 628. 000 Indonesia 212. 207 1. 570 273. 442 311. 857 Iran 67. 411 1. 430 90. 822 102. 934 Iraq 23. 115 2. 800 41. 014 54. 916 Italy 57. 820 -0. 070 52. 437 41. 945 Japan 126. 876 0. 150 120. 913 100. 496 Mexico 99. 639 1. 950 132. 505 152. 077 Nigeria 123. 338 2. 840 204. 453 303. 587 Pakistan 150. 648 2. 800 227. 044 285. 019 Philippines 80. 298 2. 250 117. 283 139. 556 Russia 145. 231 -0. 626 136. 948 127. 703 Saudi Arabia 21. 607 3. 040 39. 965 54. 461 South Africa 43. 421 1. 270 35. 109 32. 539 Turkey 65. 311 1. 500 88. 000 100. 664 United States 275. 600 0. 580 337. 815 403. 687 74 Source: Population Reference Bureau Population mid-2000

MZA Decline in Fertility Rates Ø Fertility rates 1985, 2000 and 2015 (births per woman) Source: World Bank and US Census Bureau 75

Life Expectancy at Birth (years), 1999 MZA Top 10 countries Bottom 10 countries 1 Japan 80. 9 1 Sierra Leone 34. 3 2 Australia 79. 5 2 Malawi 37. 9 3 Sweden 79. 5 3 Zambia 38. 5 4 Switzerland 79. 3 4 Niger 38. 9 5 France 79. 3 5 Botswana 39. 4 6 Monaco 79. 1 6 Zimbabwe 40. 5 7 Canada 79. 1 7 Rwanda 41. 8 8 Andorra 78. 8 8 Uganda 42. 2 9 Italy 78. 7 9 Ethiopia 42. 3 10 Spain 78. 7 10 Mali 42. 7 Source: World Health Organization 76

MZA Rise in Median Age Ø Median Age 1985, 2000 and 2015 Source: UN Population Division 77

MZA Healthy Life Expectancy Source: World Health Report 78

MZA Health Expenditure/Person ($) Source: World Health Report 79

MZA Healthcare Expenditure in the USA Health Care Expenditures 1999 dollars per capita per year 80

MZA Healthcare Expenditures in Africa $10 to $20 person 81

MZA The Global Drivers Failed States 82

MZA Globalization As Beauty Pageant We are in an era of big losers and big winners: 83

MZA Global Economic Outlook (%/year) 84

MZA The Growth of the United Nations 85

Failed States MZA Ø The losers: • Countries whose average annual population growth is above their average annual change in GDP (1987 -1997): 86

MZA Which Are the Heavily Indebted Poor Countries? A group of 40 developing countries are classified as being the heavily indebted poor countries. This includes 32 countries with a 1993 GNP per capita of US$695 or less and 1993 present value of debt to exports higher than 220 percent or present value of debt to GNP higher than 80 percent. Also included are nine countries that received, or were eligible for, concessional rescheduling from Paris Club creditors. However, any other country meeting the requirements of the Initiative could be considered for HIPC Initiative assistance. Source: IMF 87

The 40 HIPCs MZA Angola, Benin, Bolivia, Burkina Faso, Burundi, Cameroon, Central African Republic, Chad, Congo, Côte d'Ivoire, Democratic Republic of the Congo, Ethiopia, Ghana, Guinea-Bissau, Guyana, Honduras, Kenya, Lao PDR, Liberia, Madagascar, Malawi, Mali, Mauritania, Mozambique, Myanmar, Nicaragua, Niger, Rwanda, São Tomé and Príncipe, Senegal, Sierra Leone, Somalia, Sudan, Tanzania, Togo, Uganda, Vietnam, Yemen, and Zambia. Source: IMF 88

MZA External Debt As a % of GDP Source: OECD 89

The “Least Developed Countries” Source: UNCTAD MZA 90

Source: UNCTAD MZA The Least Developed Countries 91

The Least Developed Countries Source: UNCTAD MZA 92

MZA Least Developed Countries 93 Source: UNCTAD

MZA Failed States Ø Imports from failed states – people: Estimated US Illegal Immigrant Population for Top Twenty Countries of Origin Source: INS 94

MZA Failed States Ø Imports from failed states – Disease: 95

MZA Failed States Ø Imports from failed states – Disease: 96

MZA Failed States Ø Imports from failed states – Weapons of Mass Destruction (WMD): 97

MZA Failed States – The CIA on Organized Crime “While organized crime is not a new phenomenon today, some governments find their authority besieged at home and their foreign policy interests imperiled abroad. Drug trafficking, links between drug traffickers and terrorists, smuggling of illegal aliens, massive financial and bank fraud, arms smuggling, potential involvement in theft and sale of nuclear material, political intimidation, and corruption all constitute a poisonous brew—a mixture potentially as deadly as what we faced during the cold war. ” – R. James Woolsey, Former Director of US Central Intelligence 98

Annual Revenues from Global Criminal Activities MZA • • $100 -300 billion from narcotics trafficking $10 -20 billion from toxic and other hazardous waste dumping $7 billion from alien smuggling $1 billion from theft of intellectual property through pirating of videos, software, etc. • The IMF has stated that the aggregate size of money laundering in the world is between two and five percent of the world’s GDP. Using 1996 statistics, this would indicate that money laundering ranged between 590 billion and 1. 5 trillion US Dollars. 99

MZA The Global Drivers The Miracle of Economic Growth 100

MZA OECD Countries 101

MZA Growth in The OECD Countries (Average annual rates of change) Actual growth of GDP per capita 1980199098 1999 OECD 24 0. 7 1. 5 1. 8 0. 7 1. 3 1. 5 EU 15* 1. 3 2. 4 0. 7 1. 2 2. 4 0. 9 *Excluding Czech Republic, Hungary, Korea, Mexico and Poland 102

MZA The Miracle of Economic Growth Ø High Growth – • Average GDP growth above 4 percent per year, 1987 -1997: 103

MZA Growth is Good for the Poor 104

MZA What Are the Emerging Markets? Ø Leading Growth Countries Since 1950: Sources: OECD, UN, Euromonitor 105

MZA Factors of Growth Ø Stable governments Ø No Rental Income Ø Export led growth Ø Emphasis on education Ø Small territories Ø Mono-ethnic Societies Ø “Losers” Ø UK-US occupation 106

MZA The Global Drivers Global Warming 107

Global Warming MZA STATISTICS • 1998, 1999 and 2000 had the three warmest winters on record. • 1998 and 1999 were the warmest years on record according to Federal data. • Since the end of the last ice age, about 20, 000 years ago, earth has warmed 5 to 9 degrees. • In 1999, the average temperature in the 48 contiguous states was 55. 7 degrees. • Scientists predict the planet will warm by 2 to 6 degrees over the next 100 years, if emissions are not cut. Source: NYT 108
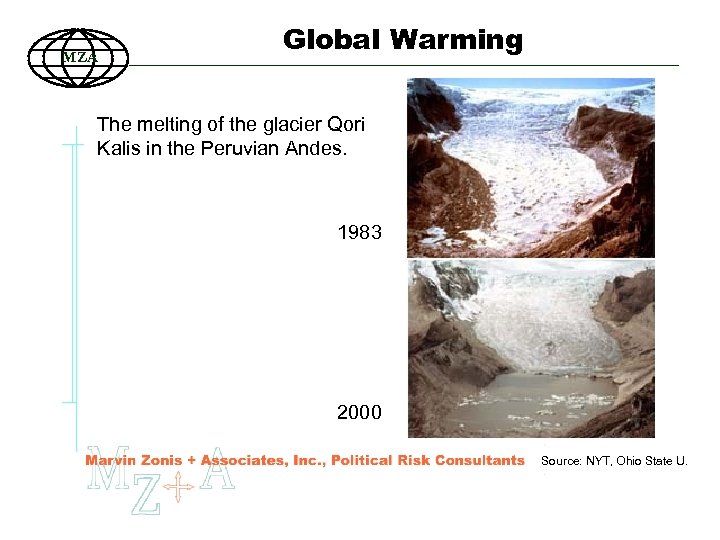
MZA Global Warming The melting of the glacier Qori Kalis in the Peruvian Andes. 1983 2000 Source: NYT, Ohio State U. 109
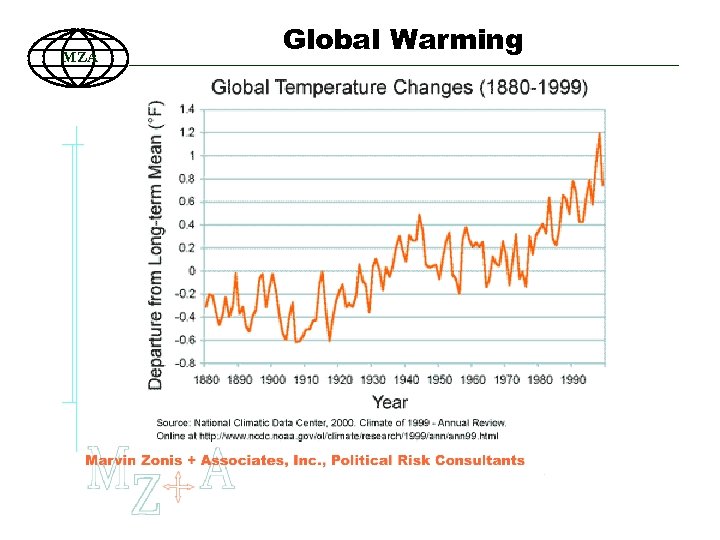
MZA Global Warming 110
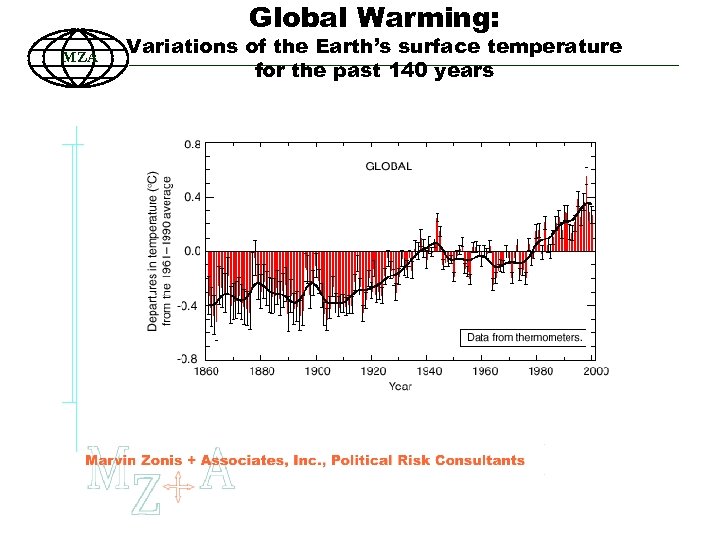
Global Warming: MZA Variations of the Earth’s surface temperature for the past 140 years 111
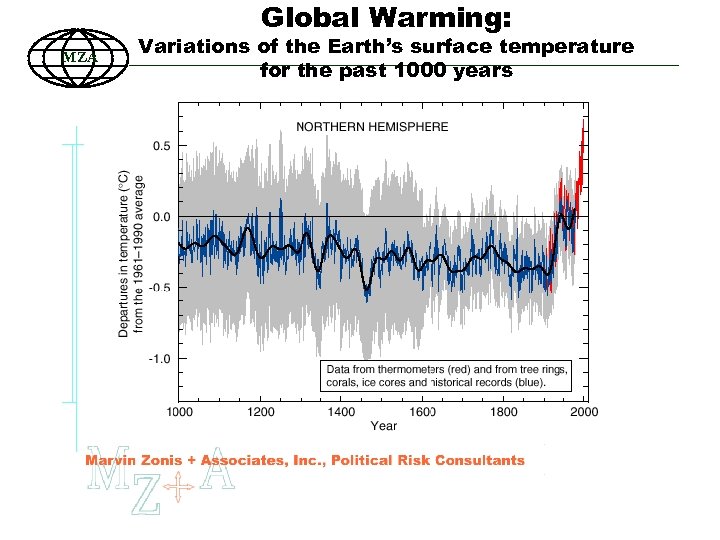
Global Warming: MZA Variations of the Earth’s surface temperature for the past 1000 years 112
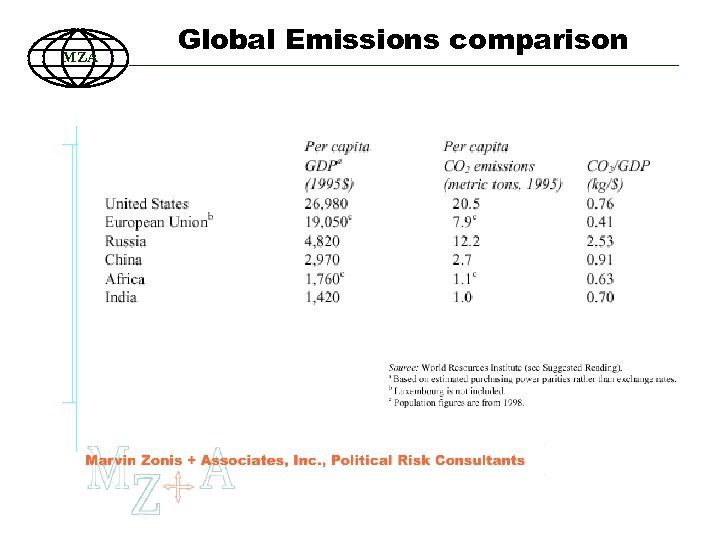
MZA Global Emissions comparison 113
MZA GSB Drivers of the Global Economy Marvin Zonis, Professor Graduate School of Business University of Chicago zonis@mza-inc. com
8d438306acd82ad40912b8c13b819ef3.ppt