Myocardial infarctions.ppt
- Количество слайдов: 70
 Myocardial infarctions
 T wave • ST segment –") Initial period • High-amplitude positive tall peaked (hyperacute) T wave • ST segment – elevated (3 -4 up to 10 -15 mm elevation). • Elevated ST segment with peaked T-wave form typical monophase curve (“cat’s back”) • Reciprocal changes - ST depression in leads, opposite the infarction zone • Transient sign: inraventricular block: increase of QRS duration to 0. 12; slow R increase; QRS voltage rise, increase of VAT to 0. 045 sec in leads, directed towards infarction zone. Disappear with Q appearance and T invertion.
Initial period • High-amplitude positive tall peaked (hyperacute) T wave • ST segment – elevated (3 -4 up to 10 -15 mm elevation). • Elevated ST segment with peaked T-wave form typical monophase curve (“cat’s back”) • Reciprocal changes - ST depression in leads, opposite the infarction zone • Transient sign: inraventricular block: increase of QRS duration to 0. 12; slow R increase; QRS voltage rise, increase of VAT to 0. 045 sec in leads, directed towards infarction zone. Disappear with Q appearance and T invertion.
 Acute period • Inverted symmetric T wave • ST segment – arch-formed elevation; decrease of the elevation to the middle of the 1 st week, small ST rise may persist during the whole phase • Pathologic Q (duration 0. 04 sec and more; height ¼ R and more): QR; Qr, QS • Three-phase curve: elevation of ST with inverted T complexes • Reciprocal changes (in leads, opposite the infarction zone) reveal: ST depression and upright or isoelecric T
 Subacute • QR, Qr, QS complexes • Isoelectric ST (horizontal or a little bit convex) • Inversed symmetrical T, wide, deep (maximal depth – end of the 4 rth week) • Prolonged QT (prolonged electric systole) • Later – gradual decrease of T depth, beginning from the peripheric sites of the infarction zone
 Post-infarction period • scar changes in one or more leads (QR, QS, low-amplitude flattered r, negative but not deep T) • Possible signs of chronic coronary insufficience • Chronic LV aneurism – convex or elevated ST
 Localization ECG leads artery affected Anteriorseptal V 1 -V 2 Left descendent branch (septal branches) Anteriorseptal V 2 -V 4 Left descendent or its branches Anteriorlateral V 4 -V 6, I, a. VL Left descendent or circumflex Wide-spread anterior V 1 -V 6, I, a. VL Left descendent Inferior II, III, a. VF Right, more rare left circumflex Dorsal V 1 and V 2 reciprocal changes Circumflex or right coronary Right ventricle V 1 and r. V 3 -r. V 4 (right leads, respecting V 3 -V 4) Right coronary
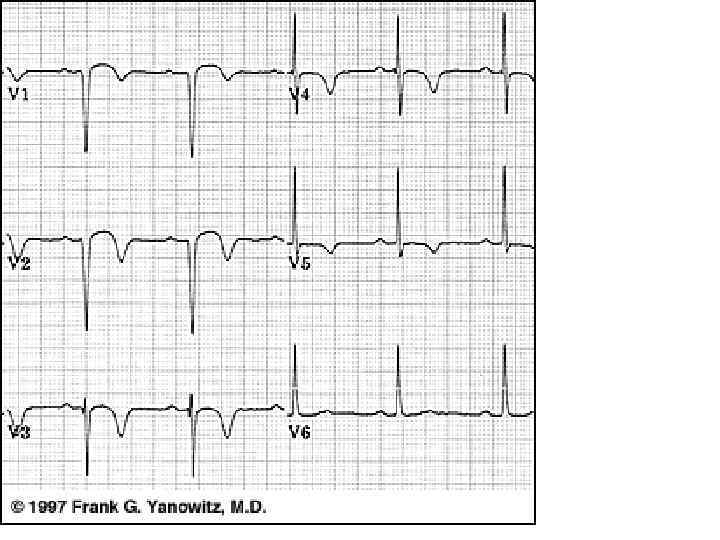
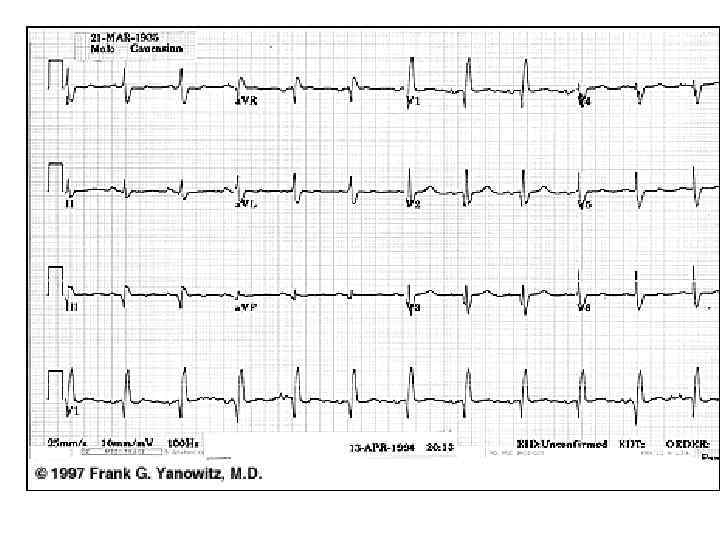
 Anteroseptal MI with spreading to lateral wall
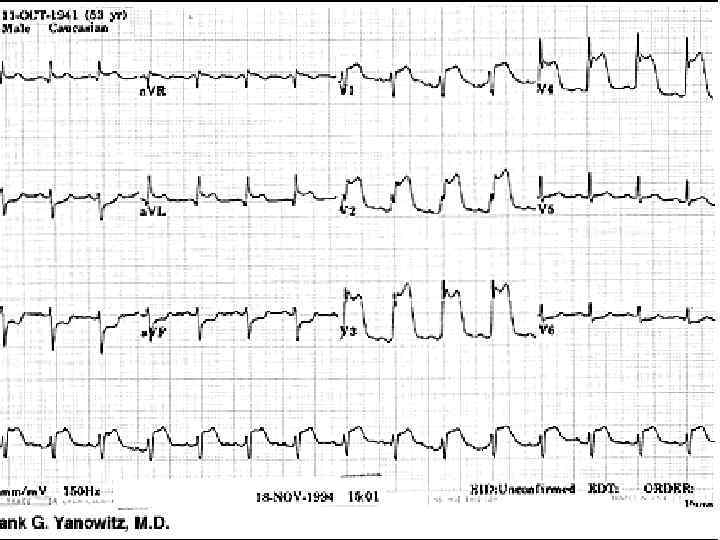
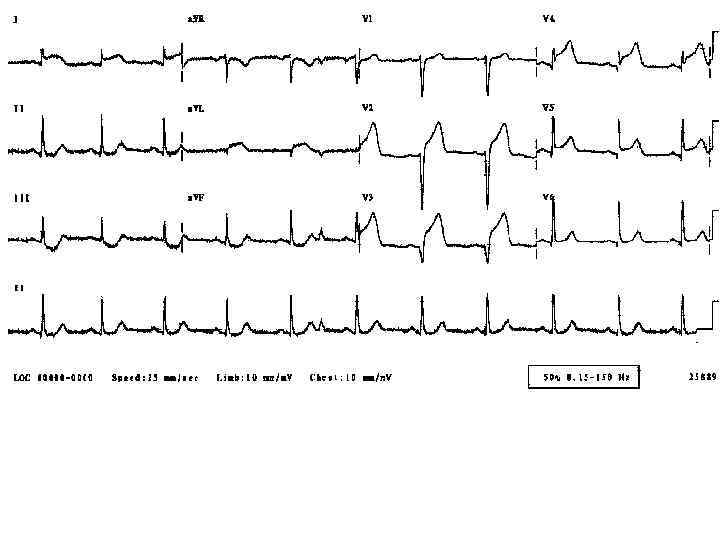
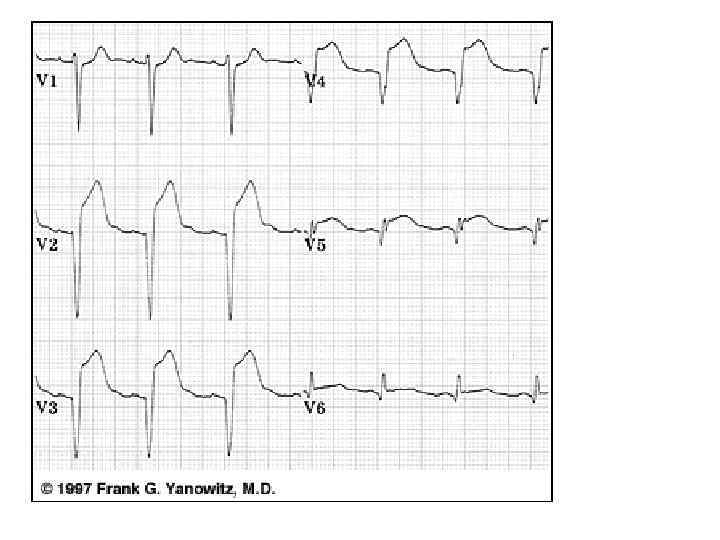
 Extensive Anterior/Anterolateral MI
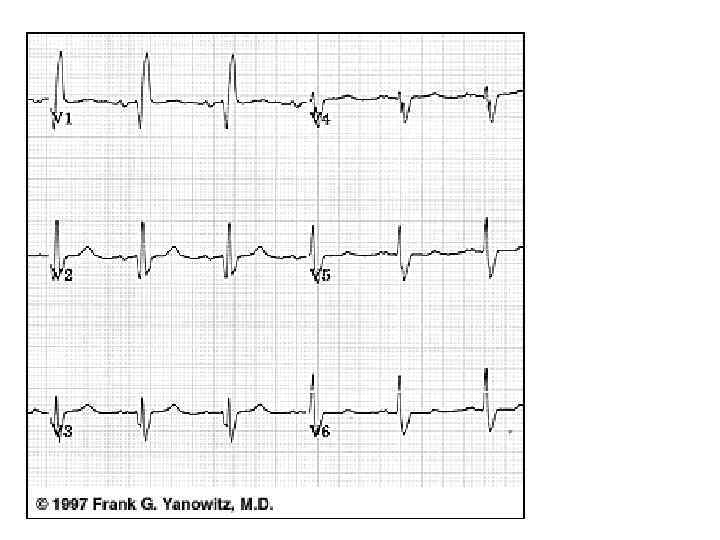
 Anteroseptal/lateral
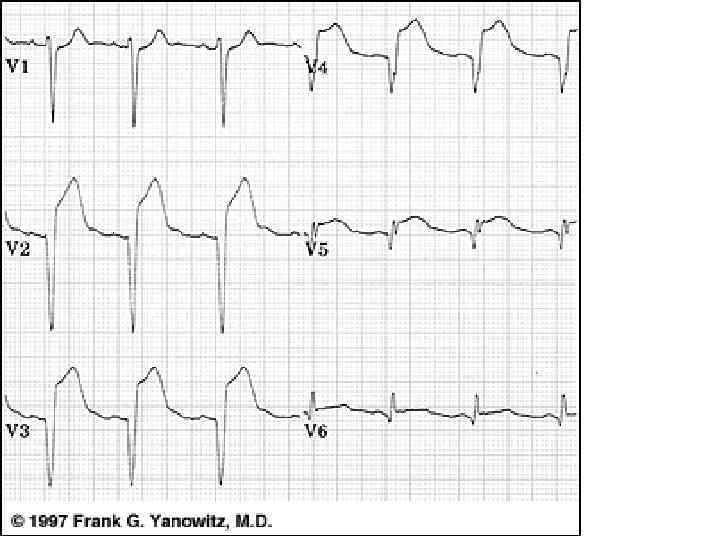
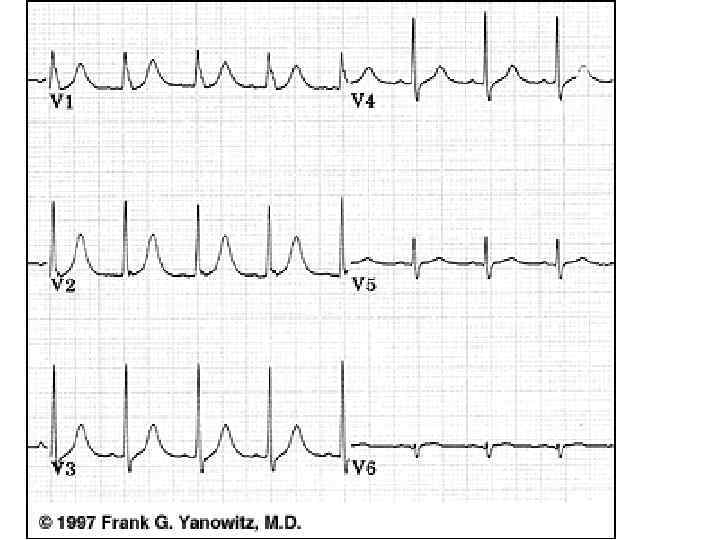
 Anterolateral
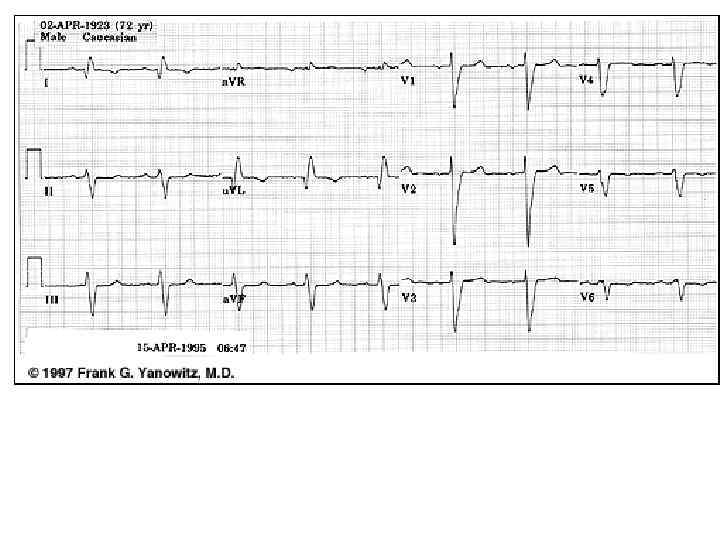
") Anterolateral (without Q)
Anterolateral (without Q)
") High Lateral Wall MI (seen in a. VL)
High Lateral Wall MI (seen in a. VL)
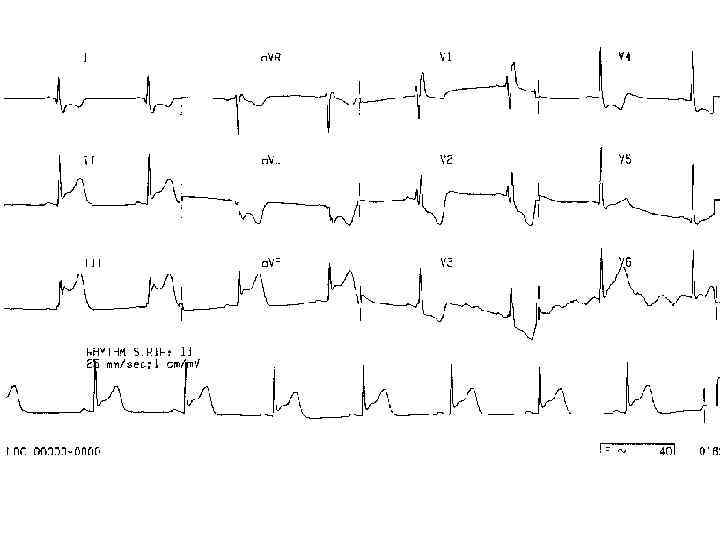
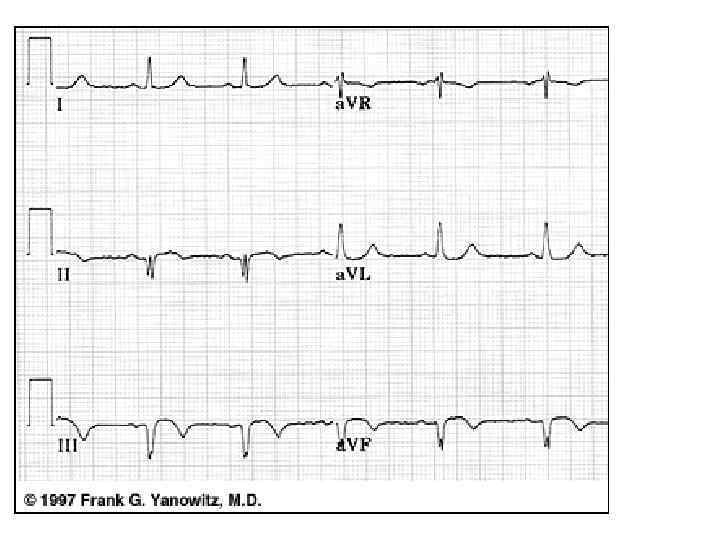
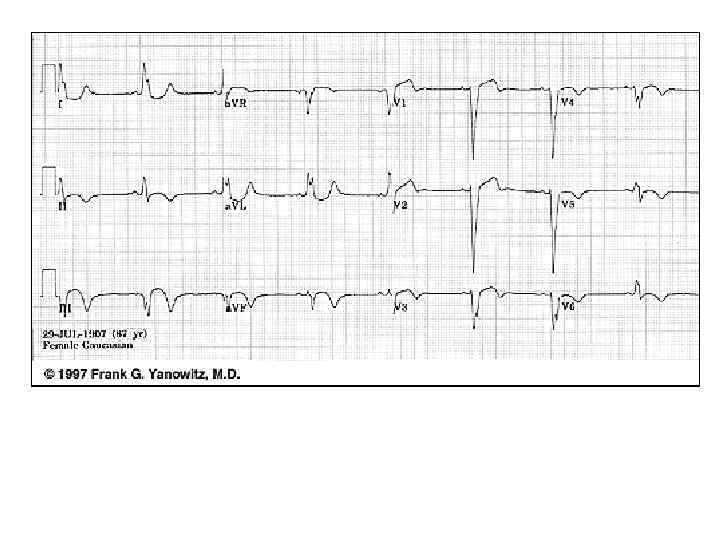
 Inferior
 Infero-posterior MI
 Inferior
 Old inferior
 Acute Inferoposterior MI
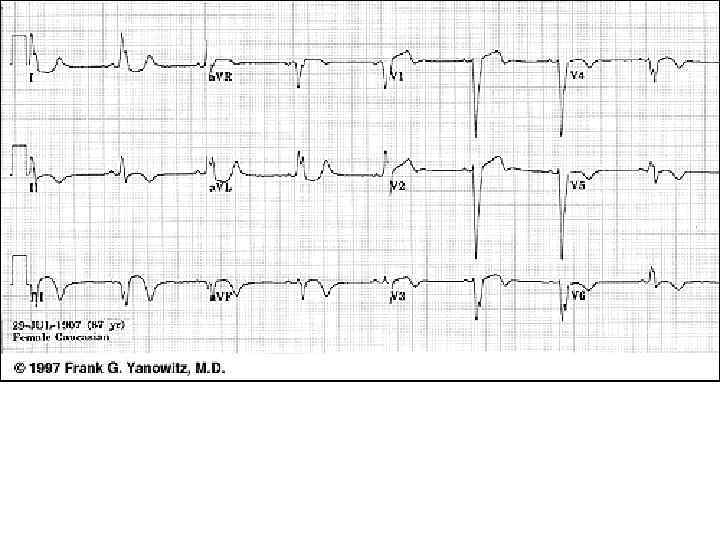
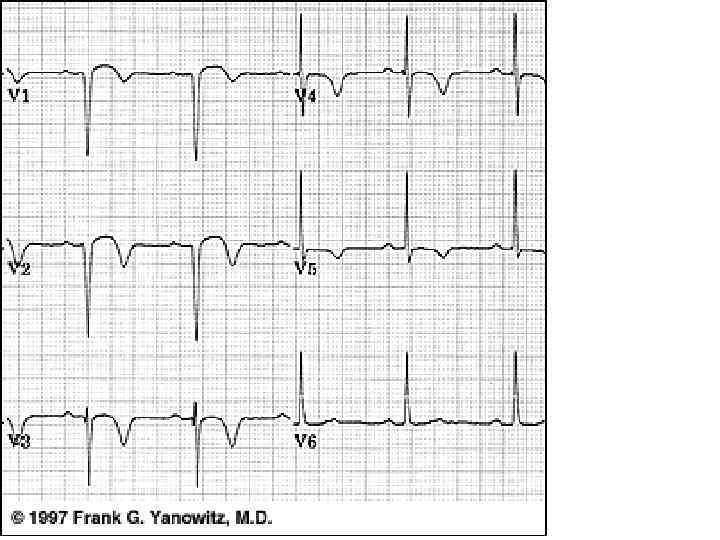
 Posterior • pathologic R waves in leads V 1 -2 (equivalent of pathologic Q waves seen from the perspective of the anterior leads) • Tall T waves in V 1 -V 2 - posterior equivalent of inverted T waves
 Postero-lateral MI
 Posterior-lateral
 Inferoposterior MI
 Old Infero-posterior MI
 Old Inferior MI
 Old Inferior MI, PVCs, and Atrial Fibrillation
 Old Inferior MI
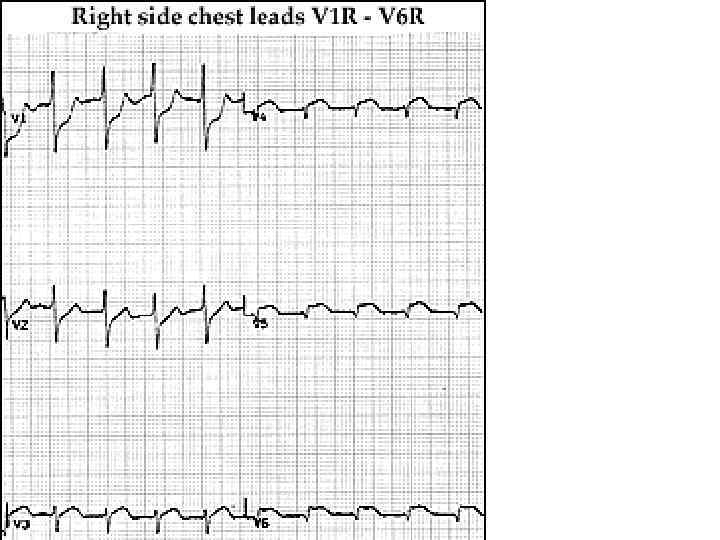
 Right ventricle MI • Right precordial leads V 1 R - V 6 R • Reciprocal ST segment depression in leads I and a. VL. Sometimes posterior wall changes may be • Hyperacute ST segment elevation in leads II, III, a. VF (inferior location) • ST depression is seen in leads V 1 -2 (an expression of posterior wall injury).
 Inferoposterior with Right Ventricular MI
 True Posterior MI and Right Ventricular MI • V 1 R - V 6 R • True posterior MI: marked ST segment elevation in V 1 R (actual V 2) and V 2 R (actual V 1). • The RV MI: ST elevation in V 3 R to V 6 R.
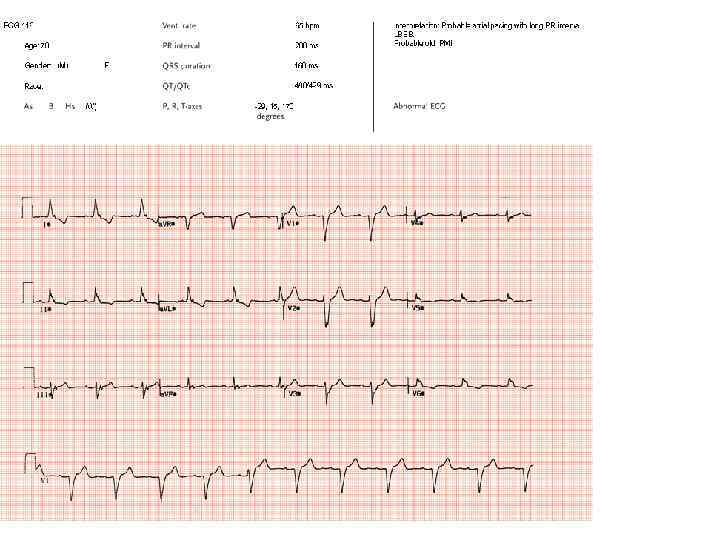
 Infero-posterior MI & RBBB • • - MI: Deep Q waves in II, III, a. VF tall R waves in V 1 -2 Q in V 5 -6 - apical lateral wall extension RBB wide QRS (>0. 12 s) Rs. R in V 1 RBBB with initial R in V 1 equal or greater than the R', true posterior MI must be considered.
 Infero-posterior MI with RBBB • initial R is taller than R' in V 1. - true posterior MI. • tall initial R wave in V 1 is a "pathologic R" wave analagous to the "pathologic Q" wave of an anterior MI.
 Inferior MI and RBBB
 Inferior & Anteroseptal MI + RBBB • Pathologic Q waves in II, III, a. VF (inferior MI) and in leads V 1 -3 (anteroseptal MI) • RBBB - wide QRS (>0. 12 s) + anterior/rightwards orientation of terminal QRS forces. • When anteroseptal MI complicates RBBB (or visa versa) r. SR' complex in V 1 (typical of RBBB) becomes q. R
 Atypical LBBB with Q Waves in Leads I and a. VL • In typical LBBB, there are no initial Q waves in leads I, a. VL, and V 6. If Q waves are present in 2 or more of these leads, myocardial infarction is present.
 Atypical LBBB with Primary T Wave Abnormalities • T waves in the same direction as the major deflection of the QRS • seen in leads I, III, a. VL, V 2 -4. • Most likely - myocardial infarction.
 MI +LBBB
 MI +LBBB
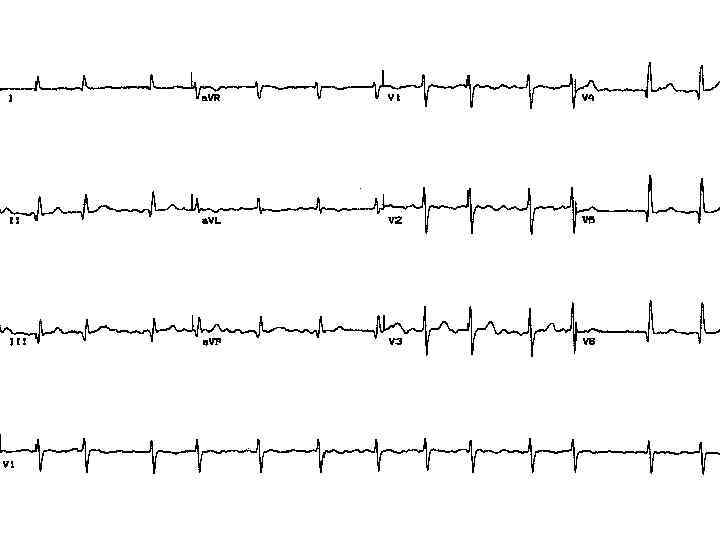
 Accelerated Junctional Rhythm and Inferior MI
 Old inferior-posterior MI with intraventricular conduction abnormalities
 • • PMIs frequently occur without the classical tall, broad R-waves in V 1 and V 2. Often there is a reduction of >50% in the R-wave between leads V 4 and V 6 with S-wave reduction and prominent notching in the anterior chest leads. In addition, the amplitude of the Twaves in the anterior chest leads may be increased and appear atypically symmetrical.
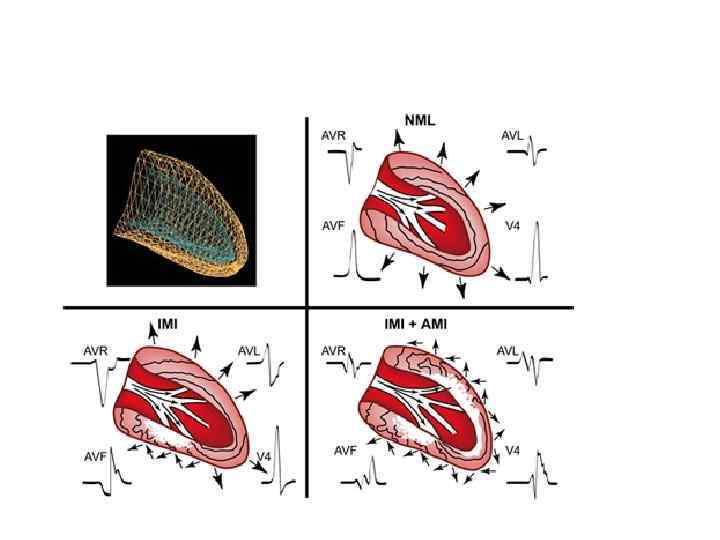
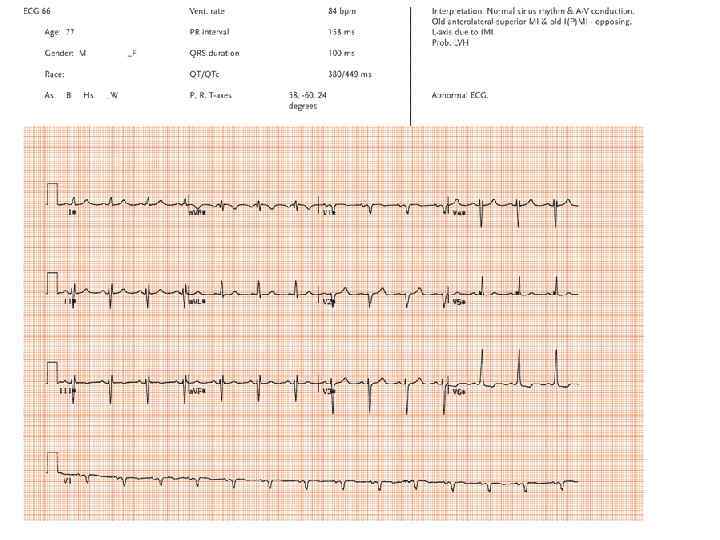
") • . An ECG from a patient with opposing inferior and anterolateral (superior) MIs. Note that although no Q-waves are present, there are complex QRS waveforms referred to as M and W complexes in both the inferior and anterolateral leads which are diagnostically equivalent to opposing Qwaves.
• . An ECG from a patient with opposing inferior and anterolateral (superior) MIs. Note that although no Q-waves are present, there are complex QRS waveforms referred to as M and W complexes in both the inferior and anterolateral leads which are diagnostically equivalent to opposing Qwaves.
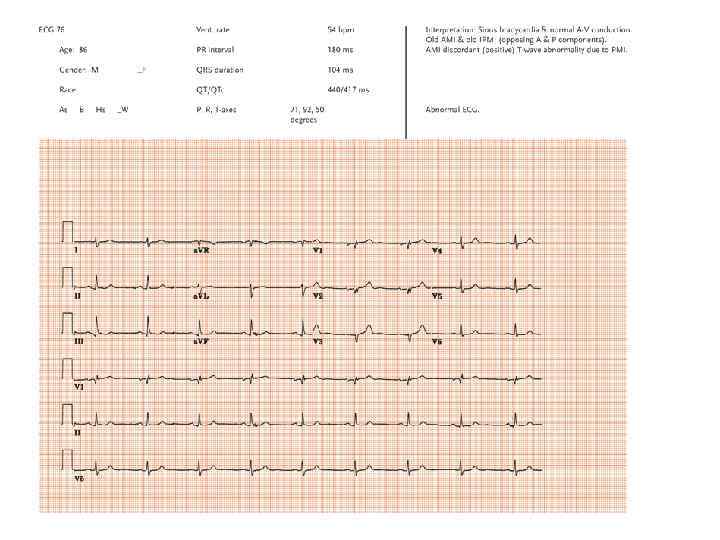
 • This ECG is from a patient with opposing anterior and posterior infarcts. Note the absence of initial r-waves V 1 -V 3 due to the ASMI. The PMI results in the reduced amplitude with prominent notchings of Swave in V 2 and the reduced S-wave and small terminal r-wave in V 1.
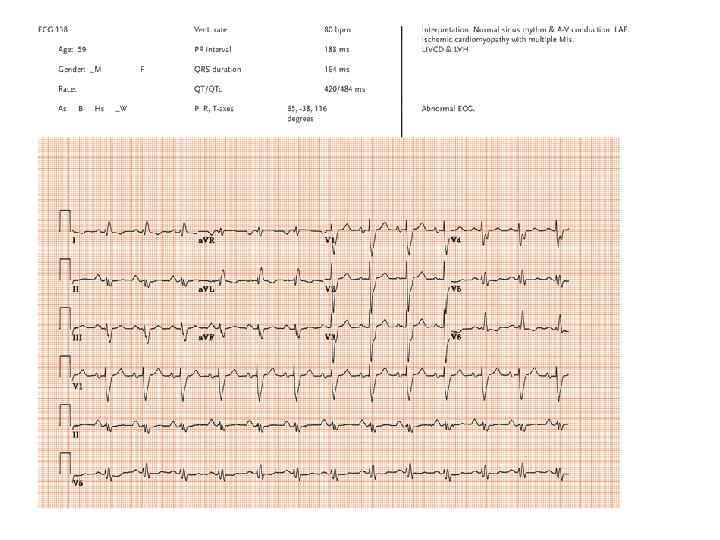
 • ECGs in patients with ischemic cardiomyopathy demonstrate an unusual repetition of this complex pattern characterized by prolonged QRS of the LV delay type, increased QRS voltage, tall narrow anterior R-waves, marked QRS notching, slurring and axis shifts.
 • An ECG from a patient with left bundle branch block and an old IMI. Note the marked notching of the mid-QRS which reflects the time and location of the wavefront as it passes by the irregular border zone in the surviving subepicardium overlying the infarct.