
MS Project Example Project Management Unit, Lecture 6


- Размер: 6 Mегабайта
- Количество слайдов: 19
Описание презентации MS Project Example Project Management Unit, Lecture 6 по слайдам
MS Project Example Project Management Unit, Lecture 6 a MS Project Example
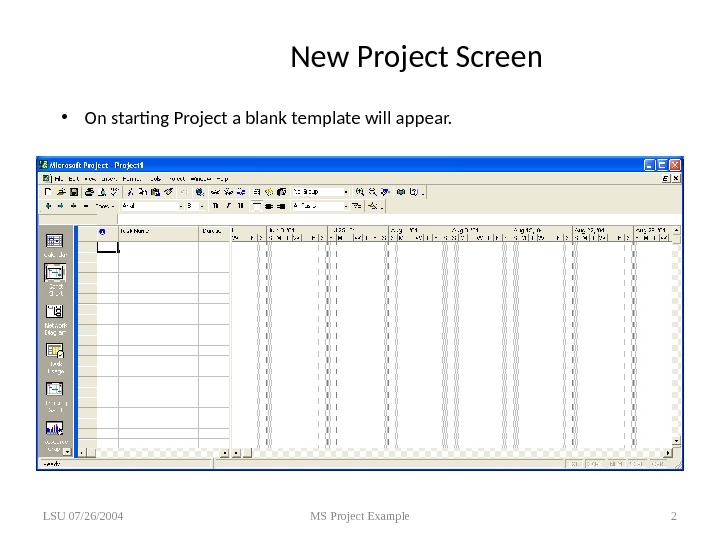
New Project Screen • On starting Project a blank template will appear. LSU 07/26/2004 MS Project Example
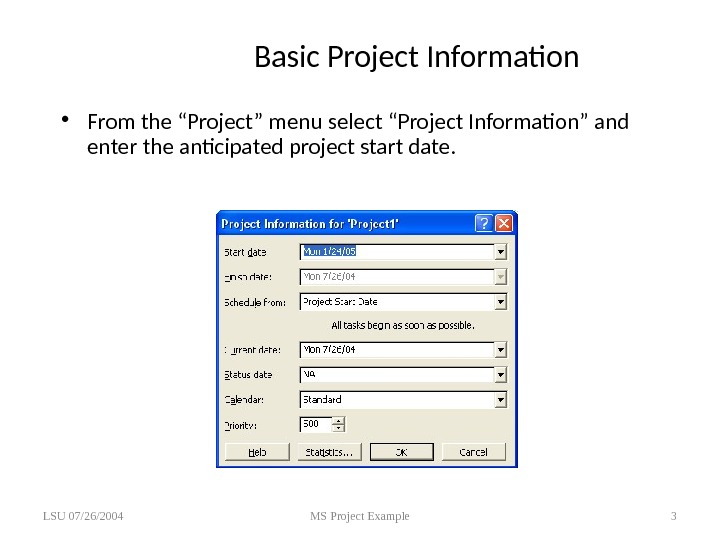
Basic Project Information • From the “Project” menu select “Project Information” and enter the anticipated project start date. LSU 07/26/2004 MS Project Example
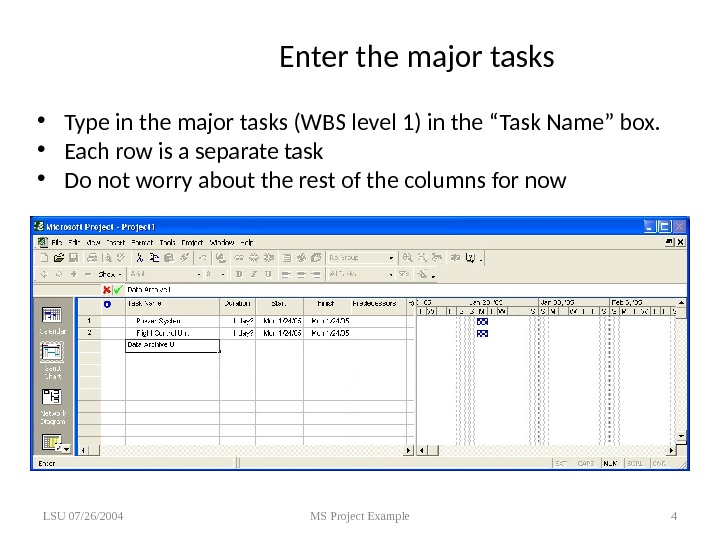
Enter the major tasks • Type in the major tasks (WBS level 1) in the “Task Name” box. • Each row is a separate task • Do not worry about the rest of the columns for now LSU 07/26/2004 MS Project Example
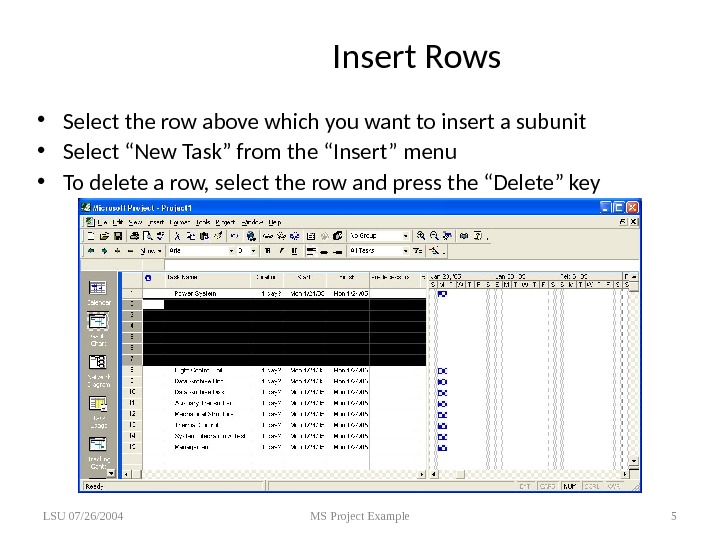
Insert Rows • Select the row above which you want to insert a subunit • Select “New Task” from the “Insert” menu • To delete a row, select the row and press the “Delete” key LSU 07/26/2004 MS Project Example
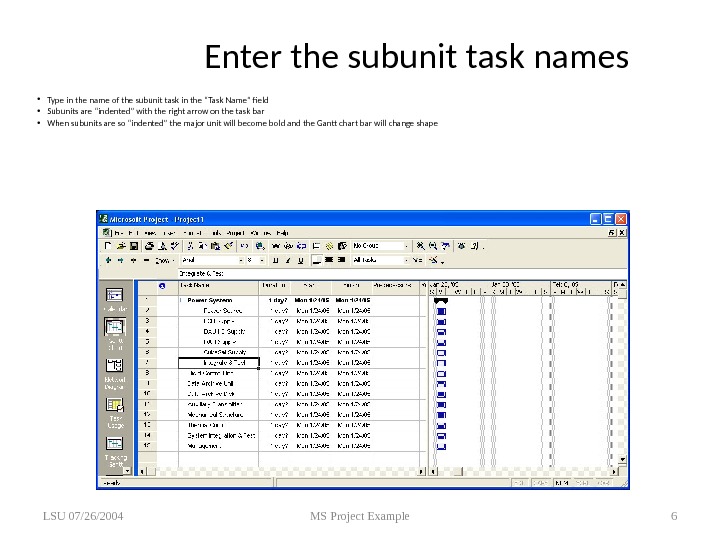
Enter the subunit task names • Type in the name of the subunit task in the “Task Name” field • Subunits are “indented” with the right arrow on the task bar • When subunits are so “indented” the major unit will become bold and the Gantt chart bar will change shape LSU 07/26/2004 MS Project Example
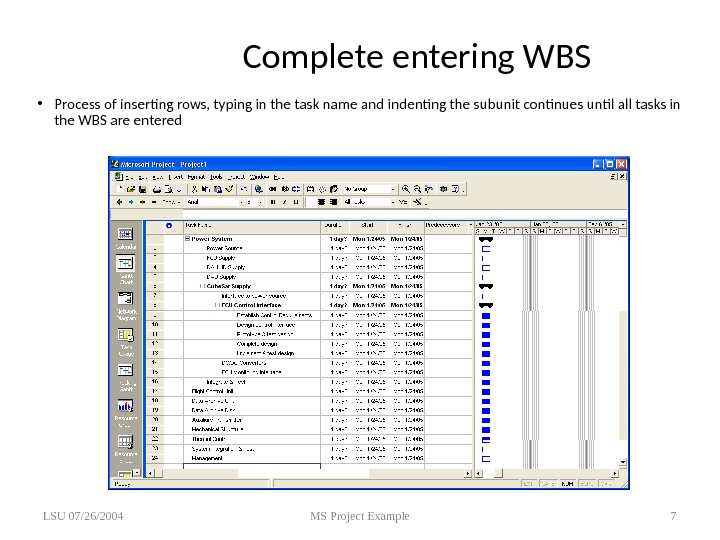
Complete entering WBS • Process of inserting rows, typing in the task name and indenting the subunit continues until all tasks in the WBS are entered LSU 07/26/2004 MS Project Example
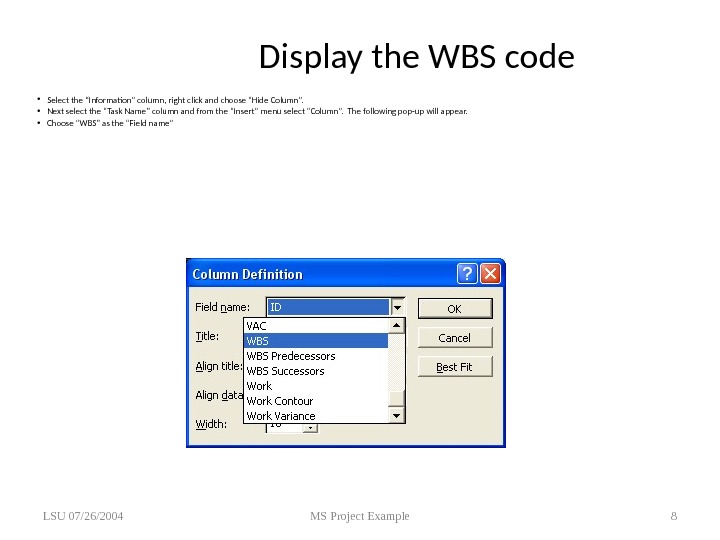
Display the WBS code • Select the “Information” column, right click and choose “Hide Column”. • Next select the “Task Name” column and from the “Insert” menu select “Column”. The following pop-up will appear. • Choose “WBS” as the “Field name” LSU 07/26/2004 MS Project Example
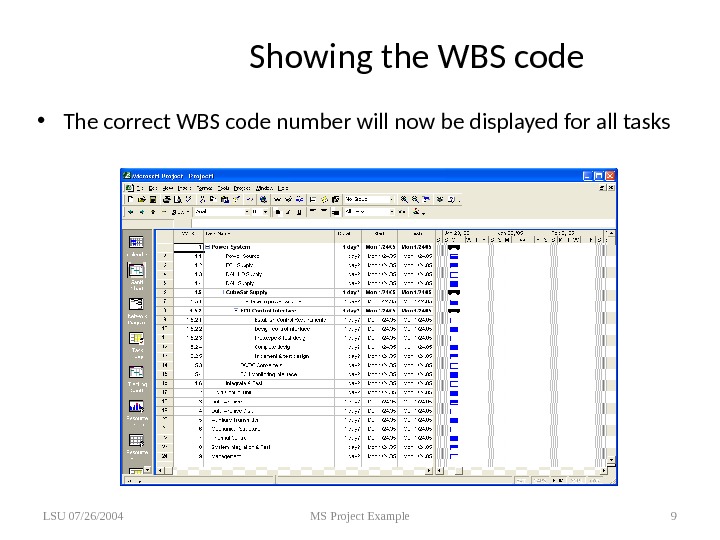
Showing the WBS code • The correct WBS code number will now be displayed for all tasks LSU 07/26/2004 MS Project Example
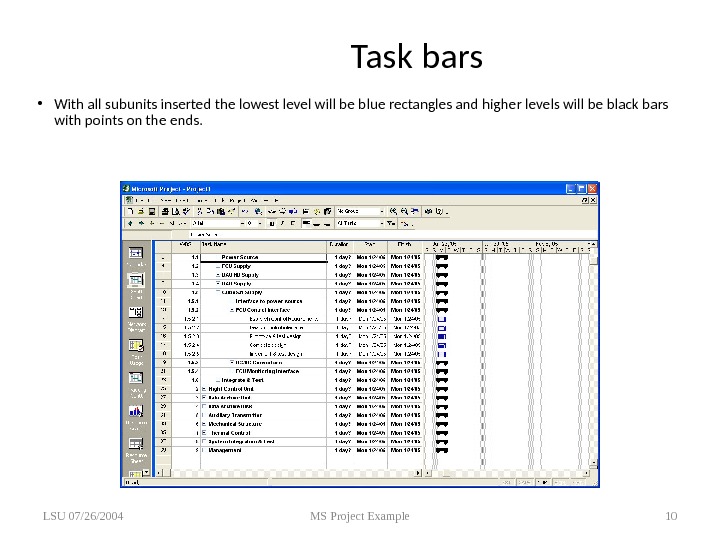
Task bars • With all subunits inserted the lowest level will be blue rectangles and higher levels will be black bars with points on the ends. LSU 07/26/2004 MS Project Example
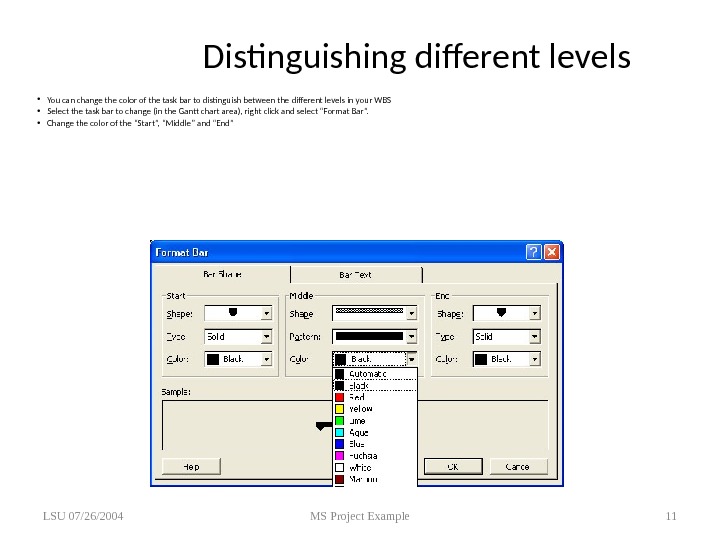
Distinguishing different levels • You can change the color of the task bar to distinguish between the different levels in your WBS • Select the task bar to change (in the Gantt chart area), right click and select “Format Bar”. • Change the color of the “Start”, “Middle” and “End” LSU 07/26/2004 MS Project Example
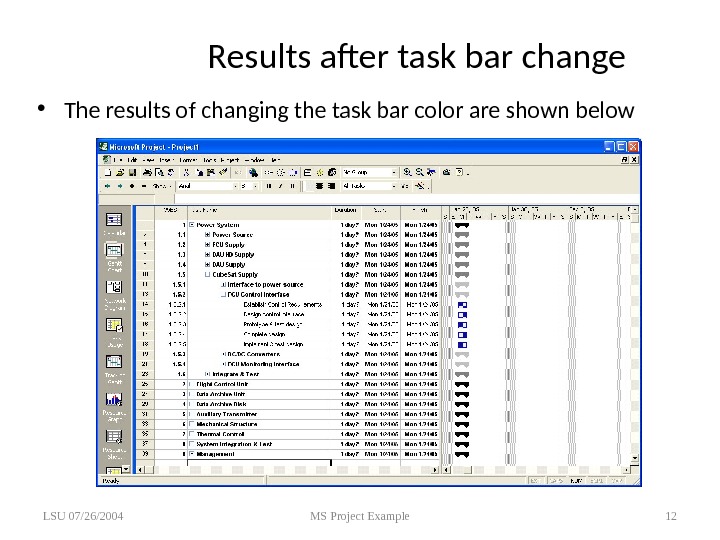
Results after task bar change • The results of changing the task bar color are shown below LSU 07/26/2004 MS Project Example
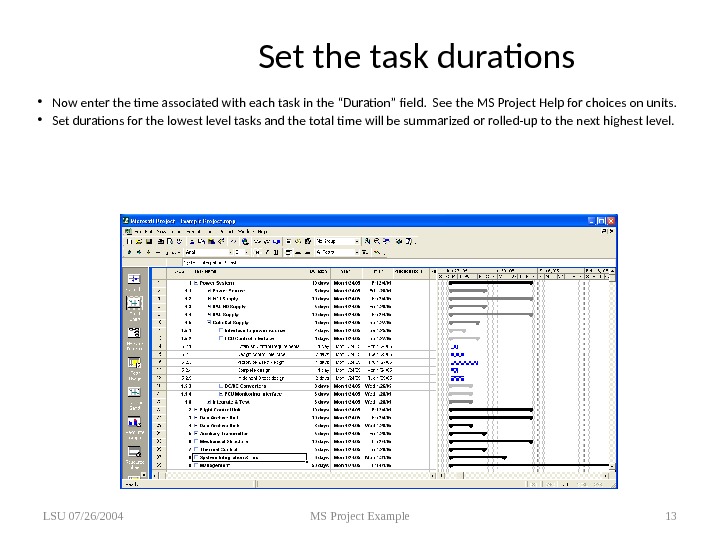
Set the task durations • Now enter the time associated with each task in the “Duration” field. See the MS Project Help for choices on units. • Set durations for the lowest level tasks and the total time will be summarized or rolled-up to the next highest level. LSU 07/26/2004 MS Project Example
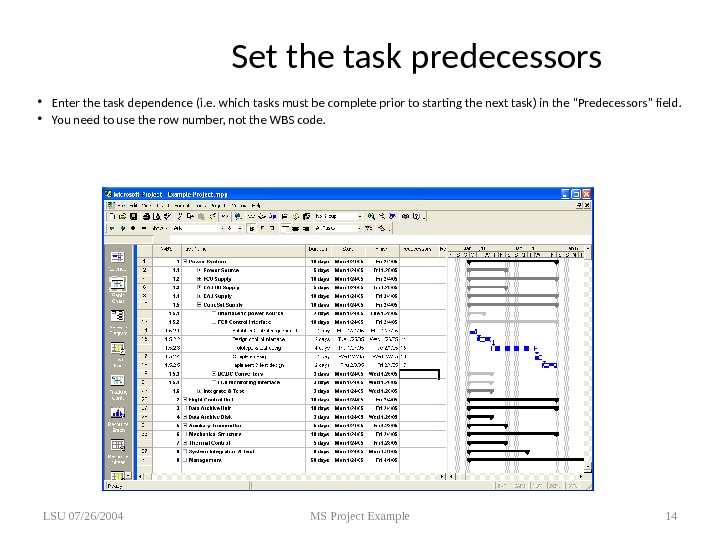
Set the task predecessors • Enter the task dependence (i. e. which tasks must be complete prior to starting the next task) in the “Predecessors” field. • You need to use the row number, not the WBS code. LSU 07/26/2004 MS Project Example
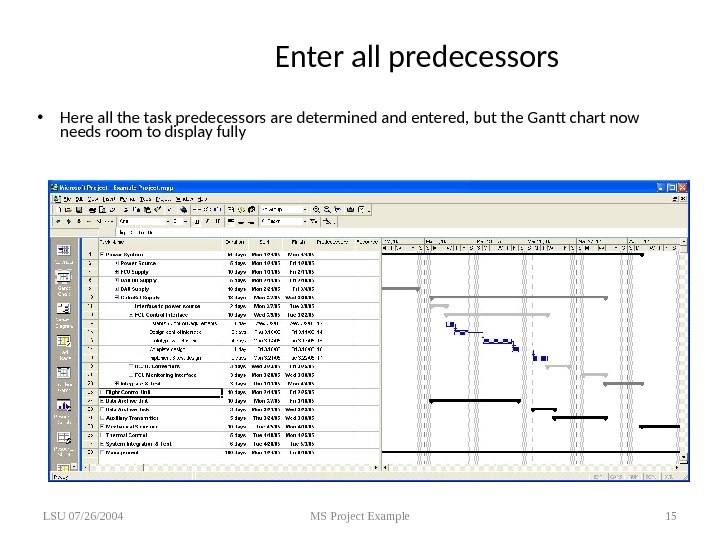
Enter all predecessors • Here all the task predecessors are determined and entered, but the Gantt chart now needs room to display fully LSU 07/26/2004 MS Project Example
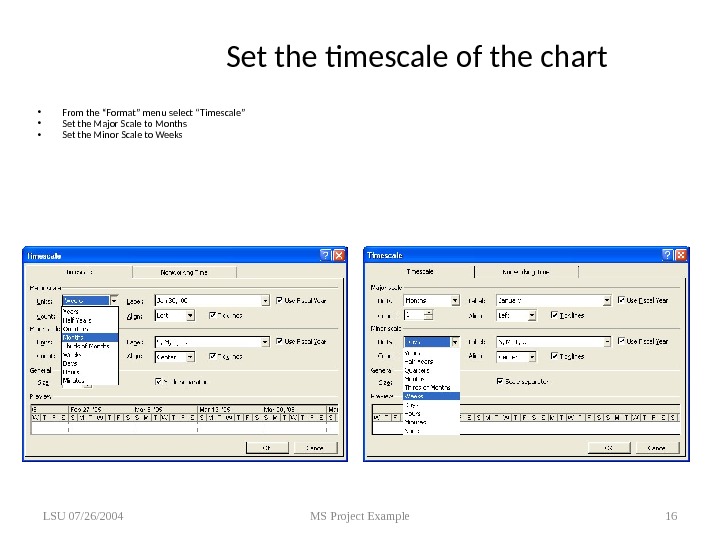
Set the timescale of the chart • From the “Format” menu select “Timescale” • Set the Major Scale to Months • Set the Minor Scale to Weeks LSU 07/26/2004 MS Project Example
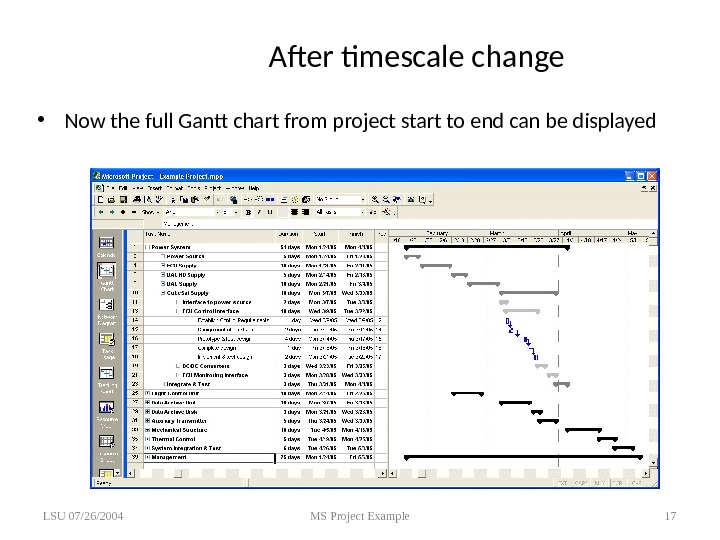
After timescale change • Now the full Gantt chart from project start to end can be displayed LSU 07/26/2004 MS Project Example
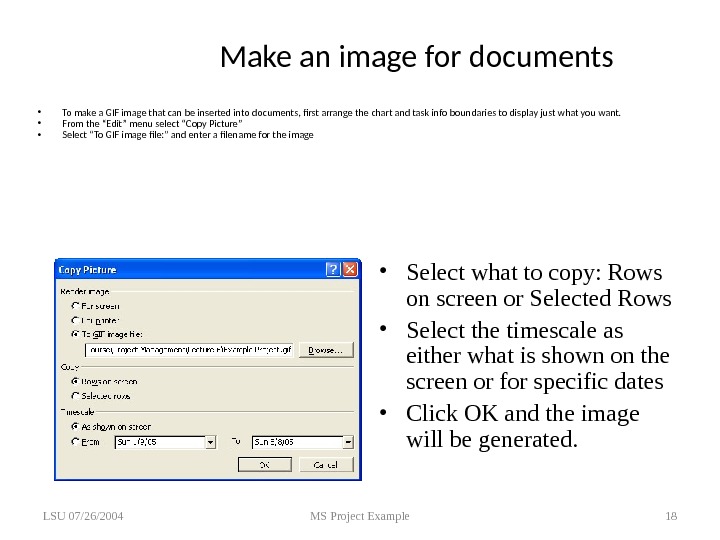
Make an image for documents • To make a GIF image that can be inserted into documents, first arrange the chart and task info boundaries to display just what you want. • From the “Edit” menu select “Copy Picture” • Select “To GIF image file: ” and enter a filename for the image LSU 07/26/2004 MS Project Example 18 • Select what to copy: Rows on screen or Selected Rows • Select the timescale as either what is shown on the screen or for specific dates • Click OK and the image will be generated.
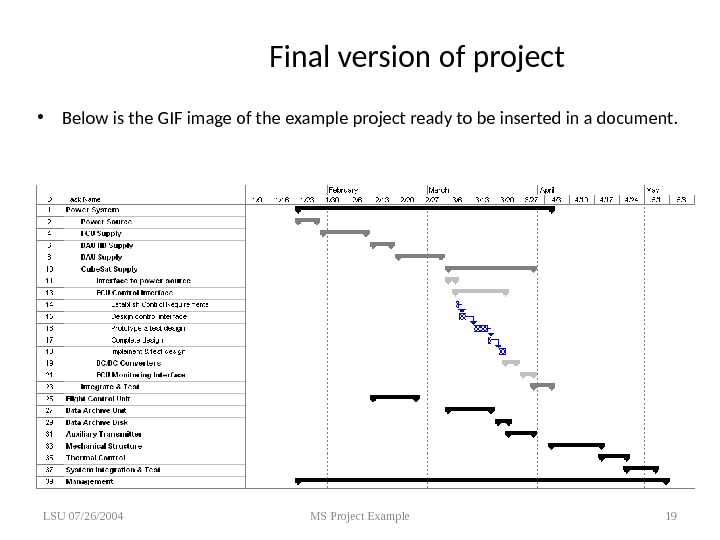
Final version of project • Below is the GIF image of the example project ready to be inserted in a document. LSU 07/26/2004 MS Project Example