ee9e5167a30dff400acffce138d852b8.ppt
- Количество слайдов: 122
More Examples of Interpreting Wait Events To Boost System Performance Roger Schrag and Terry Sutton Database Specialists, Inc. www. dbspecialists. com No. COUG Summer Conference August 21, 2003 3/17/2018 1
Session Objectives § Briefly introduce wait events: – Define wait events – Discuss how to use the wait event interface § Walk through five examples of how wait event information was used to troubleshoot production problems 3/17/2018 2
“Wait Event” Defined § We say an Oracle process is “busy” when it wants CPU time. § When an Oracle process is not busy, it is waiting for something to happen. § There are only so many things an Oracle process could be waiting for, and the kernel developers at Oracle have attached names to them all. § These are wait events. 3/17/2018 3
Wait Event Examples § An Oracle process waiting for the client application to submit a SQL statement waits on a “SQL*Net message from client” event. § An Oracle process waiting on another session to release a row-level lock waits on an “enqueue” event. 3/17/2018 4
Wait Event Interface § Each Oracle process identifies the event it is waiting for each time a wait begins. § The instance collects cumulative statistics about events waited upon since instance startup. § You can access this information through v$ views and a wait event tracing facility. § These make up the wait event interface. 3/17/2018 5
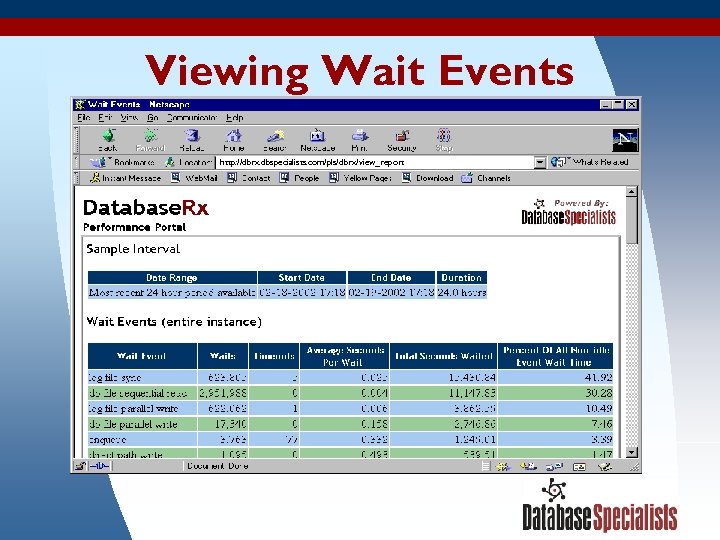
Viewing Wait Events http: //dbrx. dbspecialists. com/pls/dbrx/view_report 3/17/2018 6
Why Wait Event Information Is Useful § Wait events touch all areas of Oracle—from I/O to latches to parallelism to network traffic. § Wait event data can be remarkably detailed. “Waited 0. 02 seconds to read 8 blocks from file 42 starting at block 18042. ” § Analyzing wait event data will yield a path toward a solution for almost any problem. 3/17/2018 7
Important Wait Events § There were 158 wait events in Oracle 8. 0. § There are 363 wait events in Oracle 9 i Release 2 (9. 2. 0). § Most come up infrequently or are rarely significant for troubleshooting performance. § Different wait events are significant in different environments, depending on which Oracle features have been deployed. 3/17/2018 8
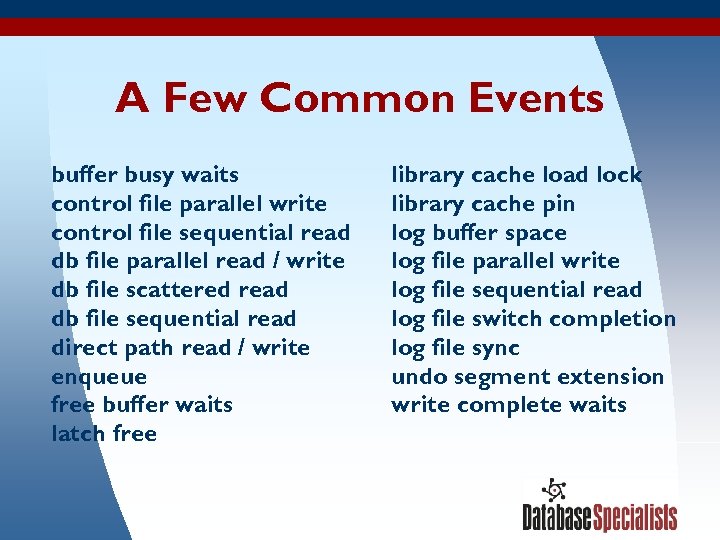
A Few Common Events buffer busy waits control file parallel write control file sequential read db file parallel read / write db file scattered read db file sequential read direct path read / write enqueue free buffer waits latch free 3/17/2018 library cache load lock library cache pin log buffer space log file parallel write log file sequential read log file switch completion log file sync undo segment extension write complete waits 9
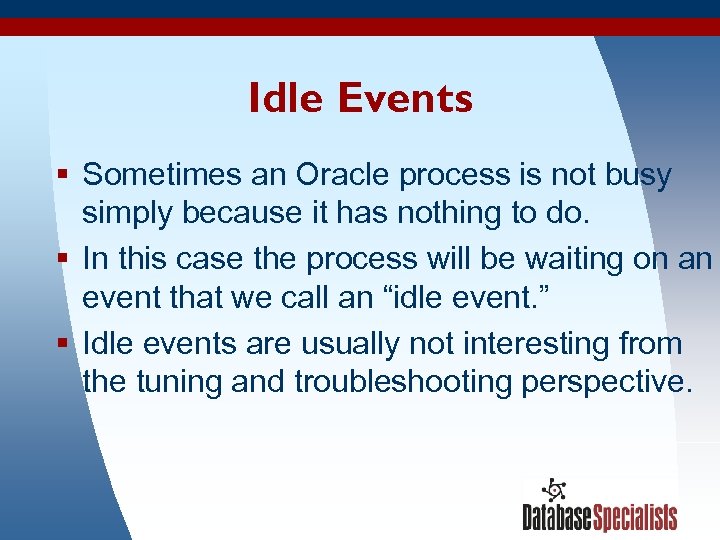
Idle Events § Sometimes an Oracle process is not busy simply because it has nothing to do. § In this case the process will be waiting on an event that we call an “idle event. ” § Idle events are usually not interesting from the tuning and troubleshooting perspective. 3/17/2018 10
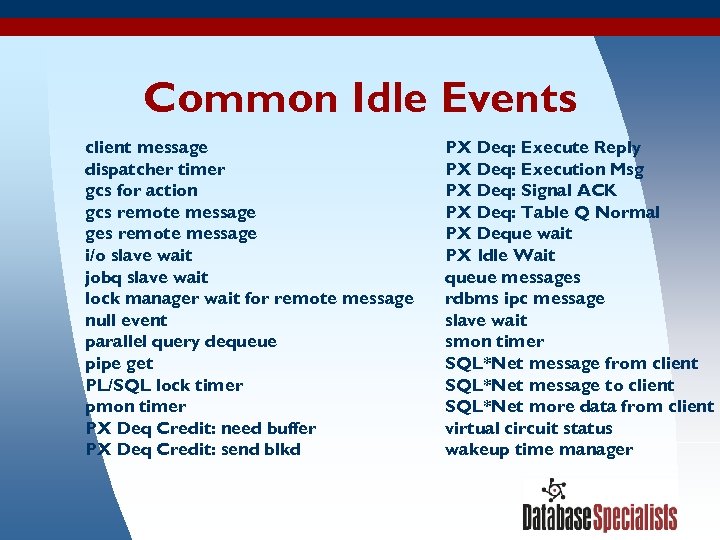
Common Idle Events client message dispatcher timer gcs for action gcs remote message ges remote message i/o slave wait jobq slave wait lock manager wait for remote message null event parallel query dequeue pipe get PL/SQL lock timer pmon timer PX Deq Credit: need buffer PX Deq Credit: send blkd 3/17/2018 PX Deq: Execute Reply PX Deq: Execution Msg PX Deq: Signal ACK PX Deq: Table Q Normal PX Deque wait PX Idle Wait queue messages rdbms ipc message slave wait smon timer SQL*Net message from client SQL*Net message to client SQL*Net more data from client virtual circuit status wakeup time manager 11
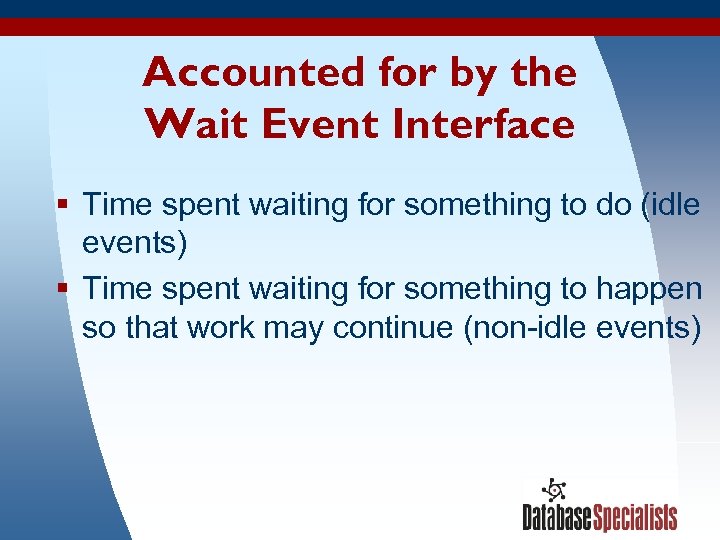
Accounted for by the Wait Event Interface § Time spent waiting for something to do (idle events) § Time spent waiting for something to happen so that work may continue (non-idle events) 3/17/2018 12
Not Accounted for by the Wait Event Interface § Time spent using a CPU § Time spent waiting for virtual memory to be swapped back into physical memory § Time spent on CPU-intensive activities: – Logical reads – Spinning while waiting for latches – Statement parsing 3/17/2018 13
Timed Statistics The wait event interface will not collect timing information unless timed statistics are enabled. § Enable timed statistics dynamically at the instance or session level: ALTER SYSTEM SET timed_statistics = TRUE; ALTER SESSION SET timed_statistics = TRUE; § Enable timed statistics at instance startup by setting the instance parameter: timed_statistics = true 3/17/2018 14
The Wait Event Interface § Dynamic performance views – v$system_event – v$session_event – v$event_name – v$session_wait § Wait event tracing 3/17/2018 15
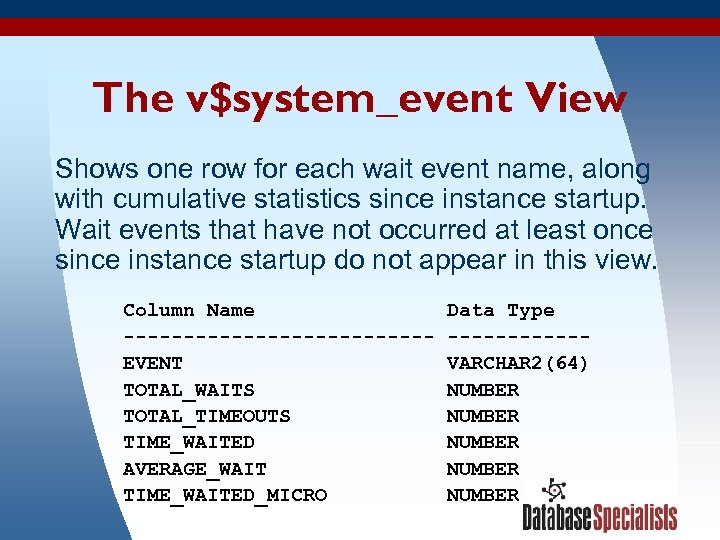
The v$system_event View Shows one row for each wait event name, along with cumulative statistics since instance startup. Wait events that have not occurred at least once since instance startup do not appear in this view. Column Name Data Type -------------EVENT VARCHAR 2(64) TOTAL_WAITS NUMBER TOTAL_TIMEOUTS NUMBER TIME_WAITED NUMBER AVERAGE_WAIT NUMBER TIME_WAITED_MICRO NUMBER 3/17/2018 16
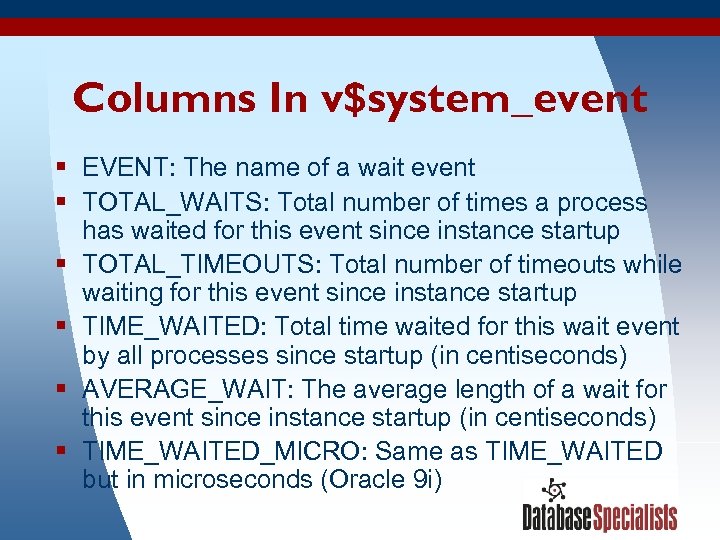
Columns In v$system_event § EVENT: The name of a wait event § TOTAL_WAITS: Total number of times a process has waited for this event since instance startup § TOTAL_TIMEOUTS: Total number of timeouts while waiting for this event since instance startup § TIME_WAITED: Total time waited for this wait event by all processes since startup (in centiseconds) § AVERAGE_WAIT: The average length of a wait for this event since instance startup (in centiseconds) § TIME_WAITED_MICRO: Same as TIME_WAITED but in microseconds (Oracle 9 i) 3/17/2018 17
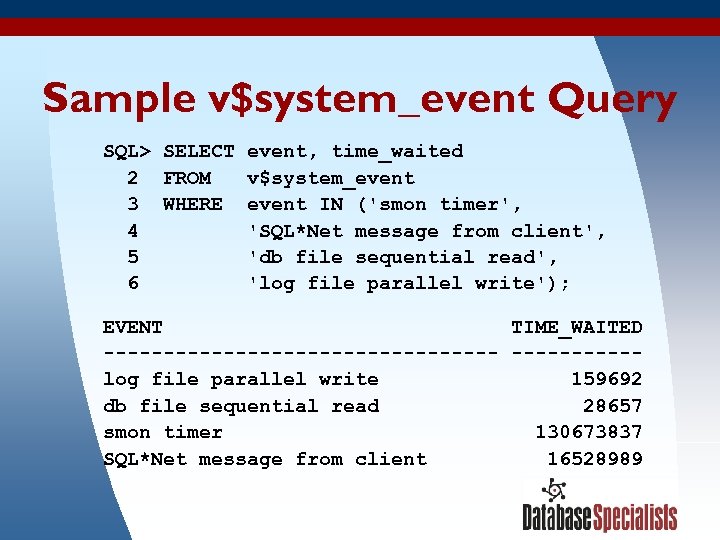
Sample v$system_event Query SQL> SELECT event, time_waited 2 FROM v$system_event 3 WHERE event IN ('smon timer', 4 'SQL*Net message from client', 5 'db file sequential read', 6 'log file parallel write'); EVENT TIME_WAITED -----------------log file parallel write 159692 db file sequential read 28657 smon timer 130673837 SQL*Net message from client 16528989 3/17/2018 18
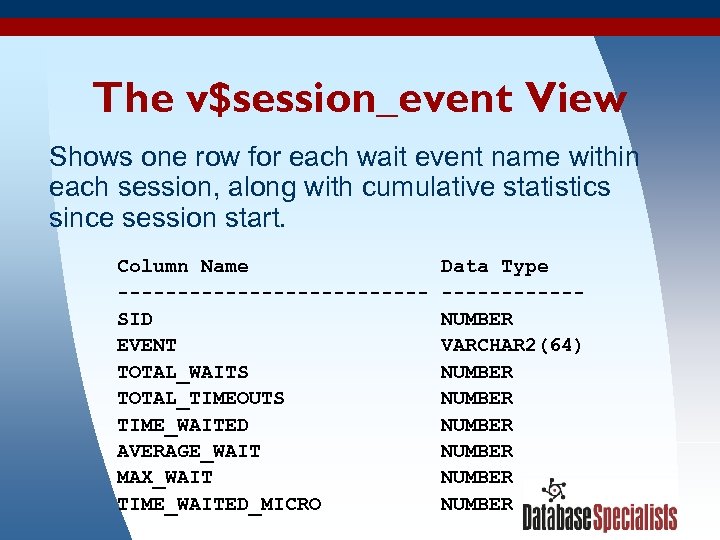
The v$session_event View Shows one row for each wait event name within each session, along with cumulative statistics since session start. Column Name Data Type -------------SID NUMBER EVENT VARCHAR 2(64) TOTAL_WAITS NUMBER TOTAL_TIMEOUTS NUMBER TIME_WAITED NUMBER AVERAGE_WAIT NUMBER MAX_WAIT NUMBER 3/17/2018 TIME_WAITED_MICRO NUMBER 19
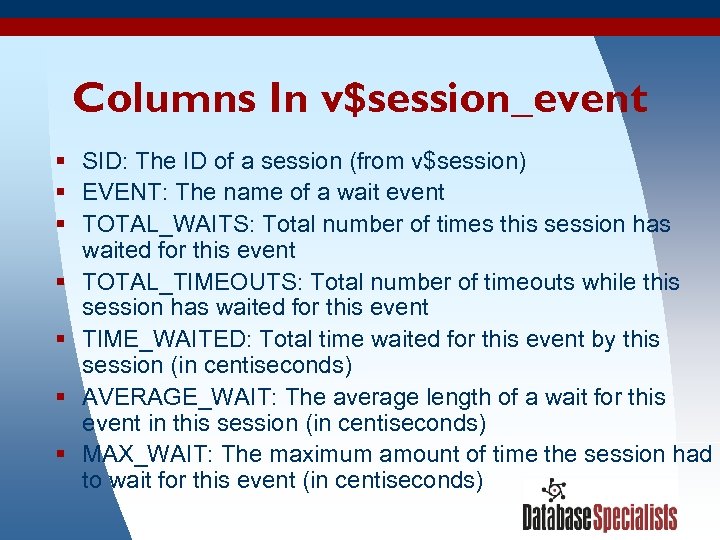
Columns In v$session_event § SID: The ID of a session (from v$session) § EVENT: The name of a wait event § TOTAL_WAITS: Total number of times this session has waited for this event § TOTAL_TIMEOUTS: Total number of timeouts while this session has waited for this event § TIME_WAITED: Total time waited for this event by this session (in centiseconds) § AVERAGE_WAIT: The average length of a wait for this event in this session (in centiseconds) § MAX_WAIT: The maximum amount of time the session had to wait for this event (in centiseconds) 3/17/2018 20
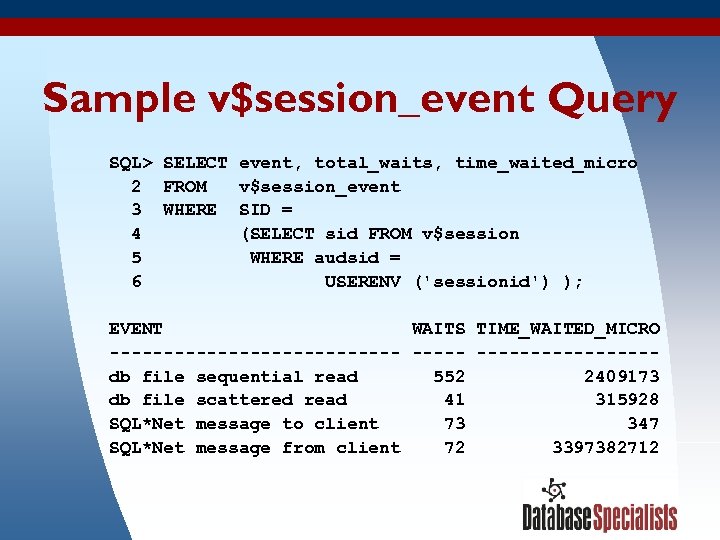
Sample v$session_event Query SQL> SELECT event, total_waits, time_waited_micro 2 FROM v$session_event 3 WHERE SID = 4 (SELECT sid FROM v$session 5 WHERE audsid = 6 USERENV ('sessionid') ); EVENT WAITS TIME_WAITED_MICRO --------------db file sequential read 552 2409173 db file scattered read 41 315928 SQL*Net message to client 73 347 SQL*Net message from client 72 3397382712 3/17/2018 21
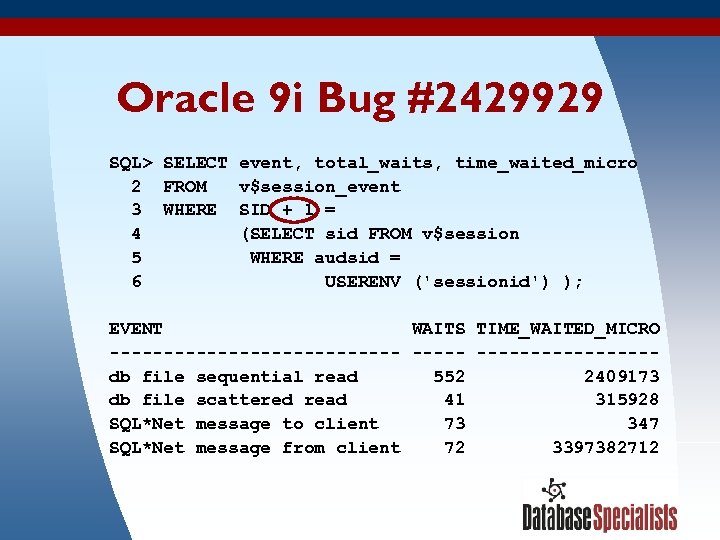
Oracle 9 i Bug #2429929 SQL> SELECT event, total_waits, time_waited_micro 2 FROM v$session_event 3 WHERE SID + 1 = 4 (SELECT sid FROM v$session 5 WHERE audsid = 6 USERENV ('sessionid') ); EVENT WAITS TIME_WAITED_MICRO --------------db file sequential read 552 2409173 db file scattered read 41 315928 SQL*Net message to client 73 347 SQL*Net message from client 72 3397382712 3/17/2018 22
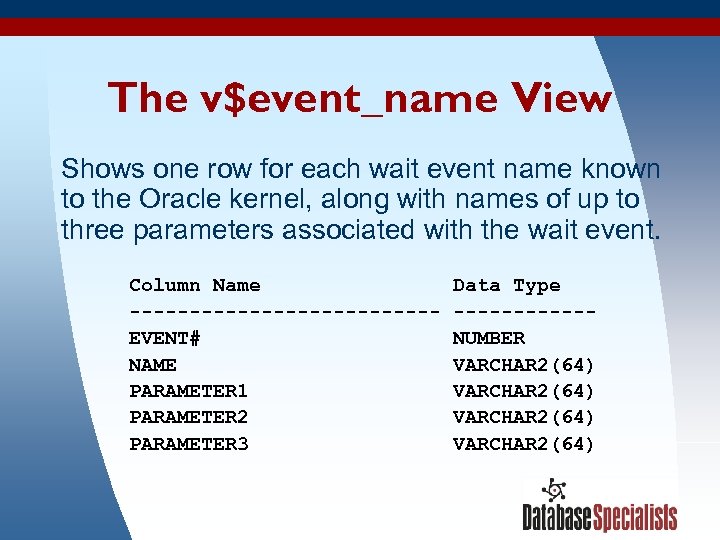
The v$event_name View Shows one row for each wait event name known to the Oracle kernel, along with names of up to three parameters associated with the wait event. Column Name Data Type -------------EVENT# NUMBER NAME VARCHAR 2(64) PARAMETER 1 VARCHAR 2(64) PARAMETER 2 VARCHAR 2(64) PARAMETER 3 VARCHAR 2(64) 3/17/2018 23
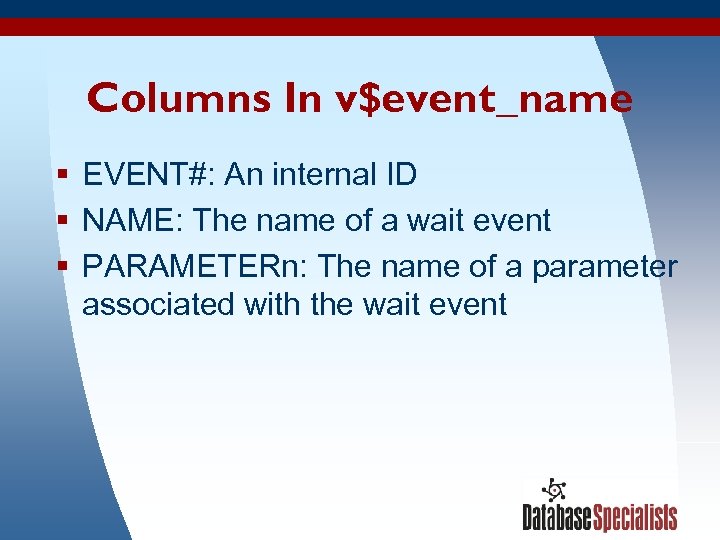
Columns In v$event_name § EVENT#: An internal ID § NAME: The name of a wait event § PARAMETERn: The name of a parameter associated with the wait event 3/17/2018 24
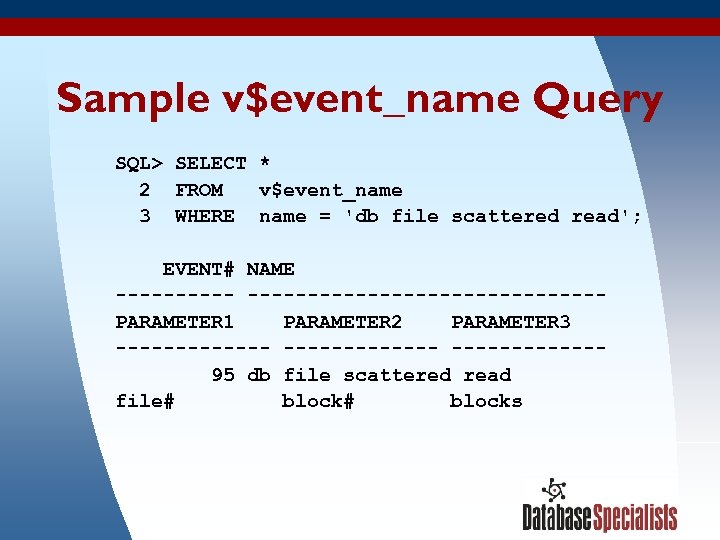
Sample v$event_name Query SQL> SELECT * 2 FROM v$event_name 3 WHERE name = 'db file scattered read'; EVENT# NAME --------------------PARAMETER 1 PARAMETER 2 PARAMETER 3 ------------- 95 db file scattered read file# block# blocks 3/17/2018 25
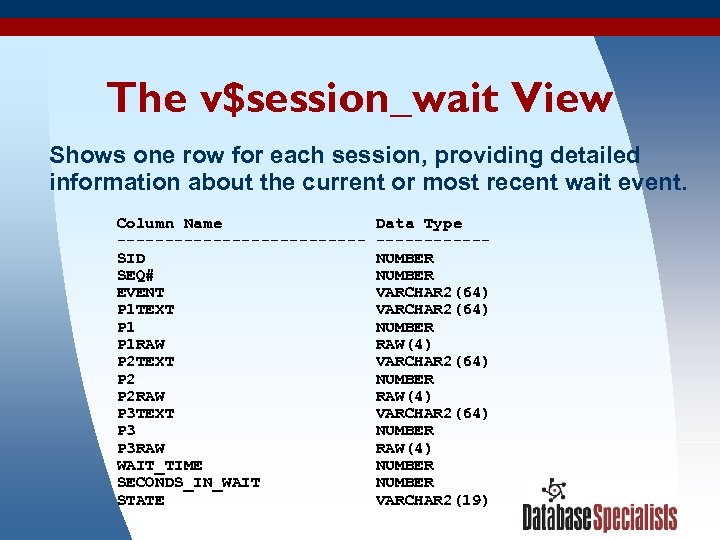
The v$session_wait View Shows one row for each session, providing detailed information about the current or most recent wait event. Column Name Data Type -------------SID NUMBER SEQ# NUMBER EVENT VARCHAR 2(64) P 1 TEXT VARCHAR 2(64) P 1 NUMBER P 1 RAW RAW(4) P 2 TEXT VARCHAR 2(64) P 2 NUMBER P 2 RAW RAW(4) P 3 TEXT VARCHAR 2(64) P 3 NUMBER P 3 RAW RAW(4) WAIT_TIME NUMBER SECONDS_IN_WAIT NUMBER 3/17/2018 STATE VARCHAR 2(19) 26
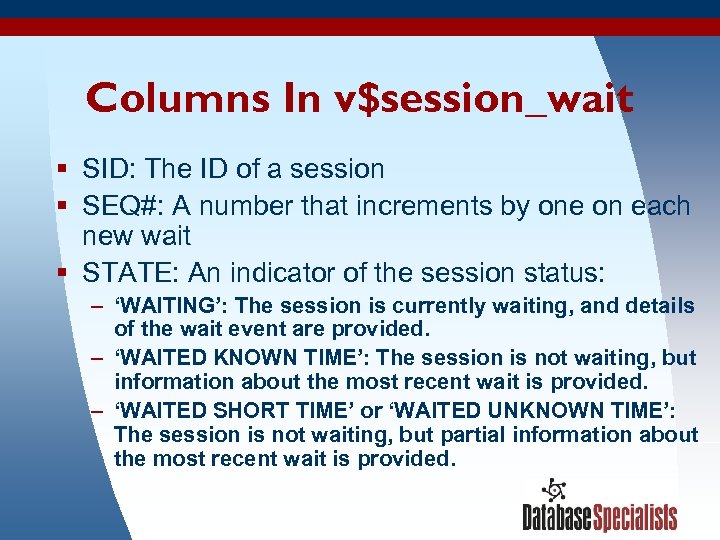
Columns In v$session_wait § SID: The ID of a session § SEQ#: A number that increments by one on each new wait § STATE: An indicator of the session status: – ‘WAITING’: The session is currently waiting, and details of the wait event are provided. – ‘WAITED KNOWN TIME’: The session is not waiting, but information about the most recent wait is provided. – ‘WAITED SHORT TIME’ or ‘WAITED UNKNOWN TIME’: The session is not waiting, but partial information about the most recent wait is provided. 3/17/2018 27
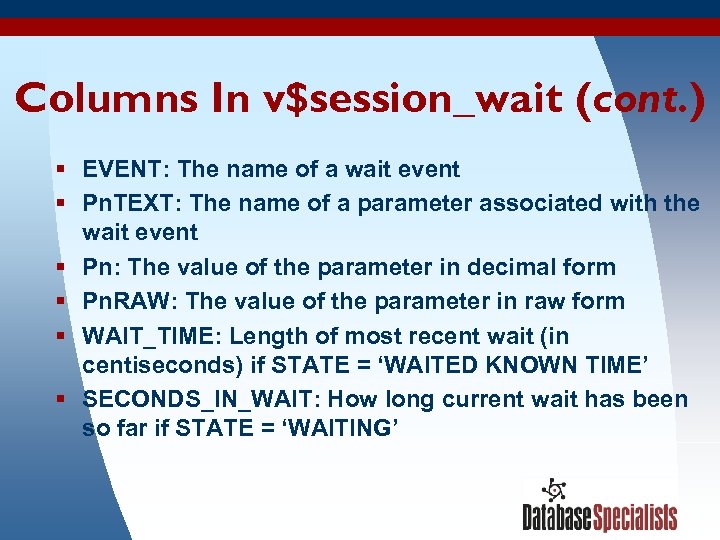
Columns In v$session_wait (cont. ) § EVENT: The name of a wait event § Pn. TEXT: The name of a parameter associated with the wait event § Pn: The value of the parameter in decimal form § Pn. RAW: The value of the parameter in raw form § WAIT_TIME: Length of most recent wait (in centiseconds) if STATE = ‘WAITED KNOWN TIME’ § SECONDS_IN_WAIT: How long current wait has been so far if STATE = ‘WAITING’ 3/17/2018 28
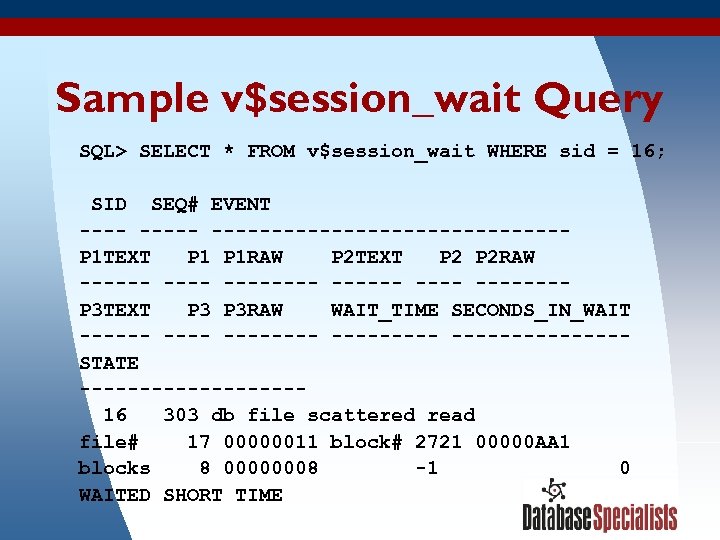
Sample v$session_wait Query SQL> SELECT * FROM v$session_wait WHERE sid = 16; SID SEQ# EVENT ---------------P 1 TEXT P 1 RAW P 2 TEXT P 2 RAW ------ -------P 3 TEXT P 3 RAW WAIT_TIME SECONDS_IN_WAIT -------- --------STATE --------- 16 303 db file scattered read file# 17 00000011 block# 2721 00000 AA 1 blocks 8 00000008 -1 0 WAITED SHORT TIME 3/17/2018 29
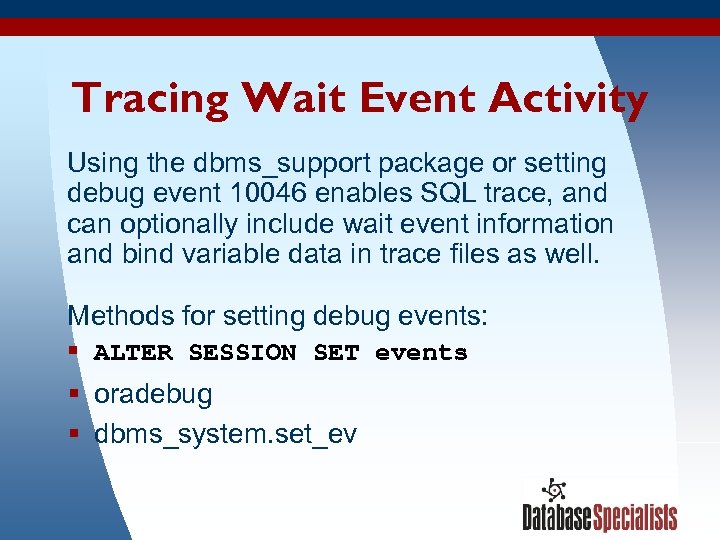
Tracing Wait Event Activity Using the dbms_support package or setting debug event 10046 enables SQL trace, and can optionally include wait event information and bind variable data in trace files as well. Methods for setting debug events: § ALTER SESSION SET events § oradebug § dbms_system. set_ev 3/17/2018 30
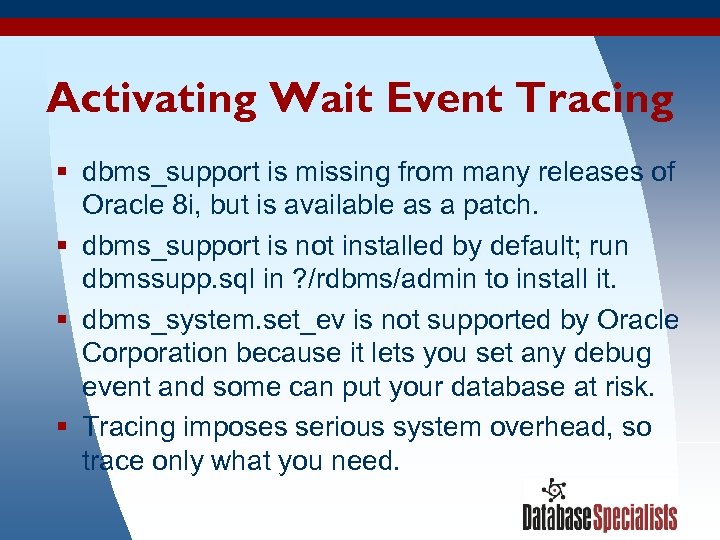
Activating Wait Event Tracing § dbms_support is missing from many releases of Oracle 8 i, but is available as a patch. § dbms_support is not installed by default; run dbmssupp. sql in ? /rdbms/admin to install it. § dbms_system. set_ev is not supported by Oracle Corporation because it lets you set any debug event and some can put your database at risk. § Tracing imposes serious system overhead, so trace only what you need. 3/17/2018 31
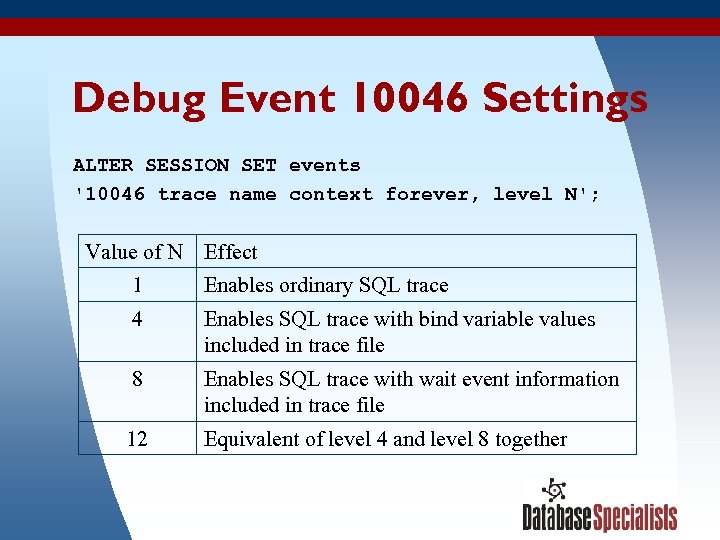
Debug Event 10046 Settings ALTER SESSION SET events '10046 trace name context forever, level N'; Value of N Effect 1 4 Enables SQL trace with bind variable values included in trace file 8 Enables SQL trace with wait event information included in trace file 12 3/17/2018 Enables ordinary SQL trace Equivalent of level 4 and level 8 together 32
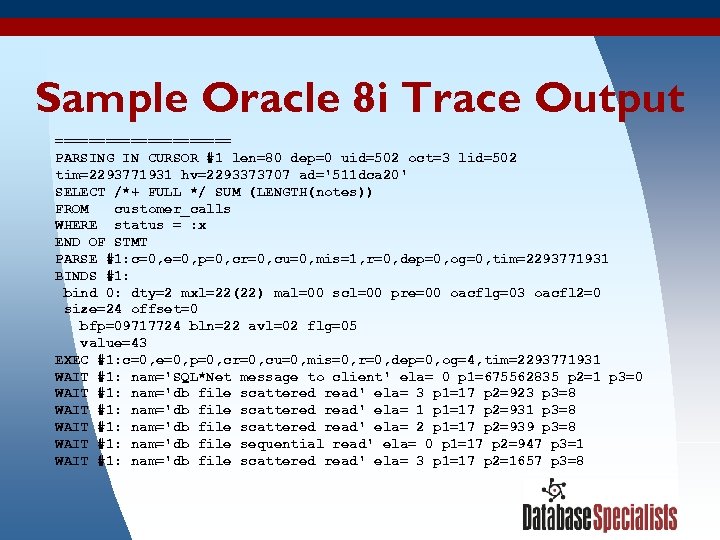
Sample Oracle 8 i Trace Output =========== PARSING IN CURSOR #1 len=80 dep=0 uid=502 oct=3 lid=502 tim=2293771931 hv=2293373707 ad='511 dca 20' SELECT /*+ FULL */ SUM (LENGTH(notes)) FROM customer_calls WHERE status = : x END OF STMT PARSE #1: c=0, e=0, p=0, cr=0, cu=0, mis=1, r=0, dep=0, og=0, tim=2293771931 BINDS #1: bind 0: dty=2 mxl=22(22) mal=00 scl=00 pre=00 oacflg=03 oacfl 2=0 size=24 offset=0 bfp=09717724 bln=22 avl=02 flg=05 value=43 EXEC #1: c=0, e=0, p=0, cr=0, cu=0, mis=0, r=0, dep=0, og=4, tim=2293771931 WAIT #1: nam='SQL*Net message to client' ela= 0 p 1=675562835 p 2=1 p 3=0 WAIT #1: nam='db file scattered read' ela= 3 p 1=17 p 2=923 p 3=8 WAIT #1: nam='db file scattered read' ela= 1 p 1=17 p 2=931 p 3=8 WAIT #1: nam='db file scattered read' ela= 2 p 1=17 p 2=939 p 3=8 WAIT #1: nam='db file sequential read' ela= 0 p 1=17 p 2=947 p 3=1 WAIT #1: nam='db file scattered read' ela= 3 p 1=17 p 2=1657 p 3=8 3/17/2018 33
Wait Event Tracing Enhancements In Oracle 9 i § The dbms_support package is provided for easier trace activation. § Elapsed times in the trace file are shown in microseconds instead of centiseconds. § A “waits=yes” option has been added to TKPROF to include wait event statistics in the TKPROF report. 3/17/2018 34
Using Wait Event Information Five examples of how wait event information was used to diagnose production problems 3/17/2018 35
Example #1: Buffer Busy Waits A magazine publisher has a website that displays content stored in a database. At times the website would get bogged down— response time would become poor and the database server would become extremely busy (near-zero idle time). 3/17/2018 36
Viewing Wait Events Statistics With Statspack § Collect Statspack snapshots at regular intervals. § Statspack report shows top wait events for entire instance during snapshot interval. § Oracle 9 i Statspack also shows CPU time used during the interval. 3/17/2018 37
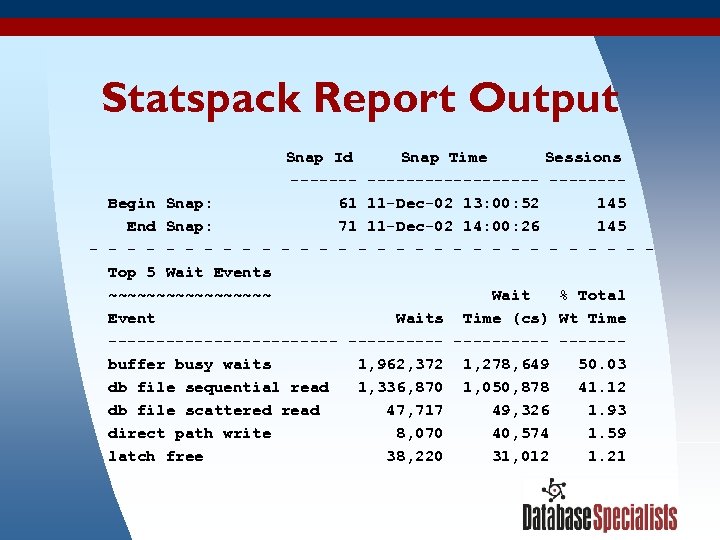
Statspack Report Output Snap Id Snap Time Sessions ------------- Begin Snap: 61 11 -Dec-02 13: 00: 52 145 End Snap: 71 11 -Dec-02 14: 00: 26 145 - - - - - - - - Top 5 Wait Events ~~~~~~~~~ Wait % Total Event Waits Time (cs) Wt Time ------------ ------ buffer busy waits 1, 962, 372 1, 278, 649 50. 03 db file sequential read 1, 336, 870 1, 050, 878 41. 12 db file scattered read 47, 717 49, 326 1. 93 direct path write 8, 070 40, 574 1. 59 latch free 38, 220 31, 012 1. 21 3/17/2018 38
What We See in the Statspack Report § Dominant wait events: – buffer busy waits – db file sequential read § Over 23, 000 seconds of wait time on these two events in a one hour period (over 6 seconds of waiting per elapsed second) 3/17/2018 39
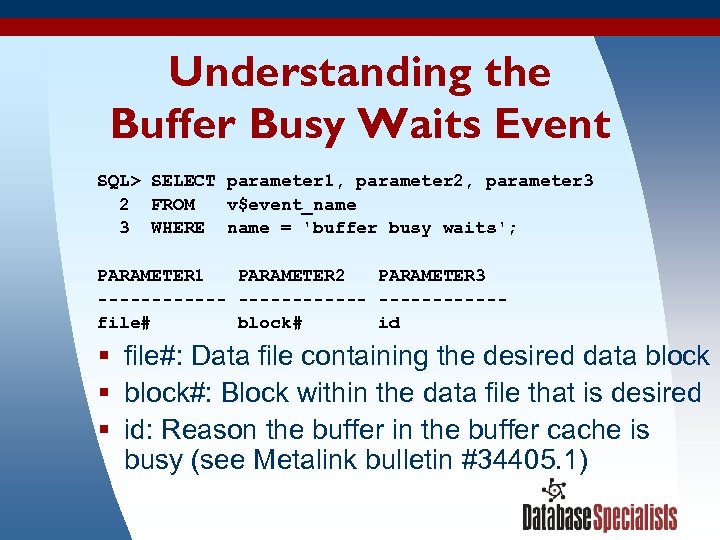
Understanding the Buffer Busy Waits Event SQL> SELECT parameter 1, parameter 2, parameter 3 2 FROM v$event_name 3 WHERE name = 'buffer busy waits'; PARAMETER 1 PARAMETER 2 PARAMETER 3 ------------file# block# id § file#: Data file containing the desired data block § block#: Block within the data file that is desired § id: Reason the buffer in the buffer cache is busy (see Metalink bulletin #34405. 1) 3/17/2018 40
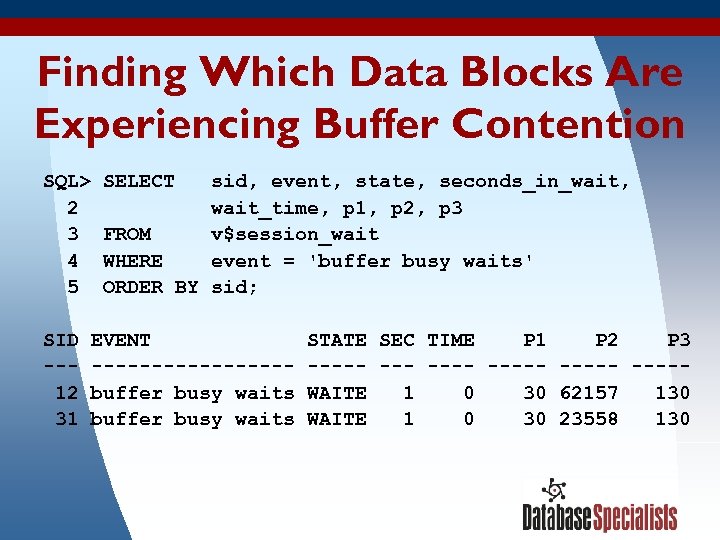
Finding Which Data Blocks Are Experiencing Buffer Contention SQL> SELECT sid, event, state, seconds_in_wait, 2 wait_time, p 1, p 2, p 3 3 FROM v$session_wait 4 WHERE event = 'buffer busy waits' 5 ORDER BY sid; SID EVENT STATE SEC TIME P 1 P 2 P 3 ---------- ----- 12 buffer busy waits WAITE 1 0 30 62157 130 31 buffer busy waits WAITE 1 0 30 23558 130 3/17/2018 41
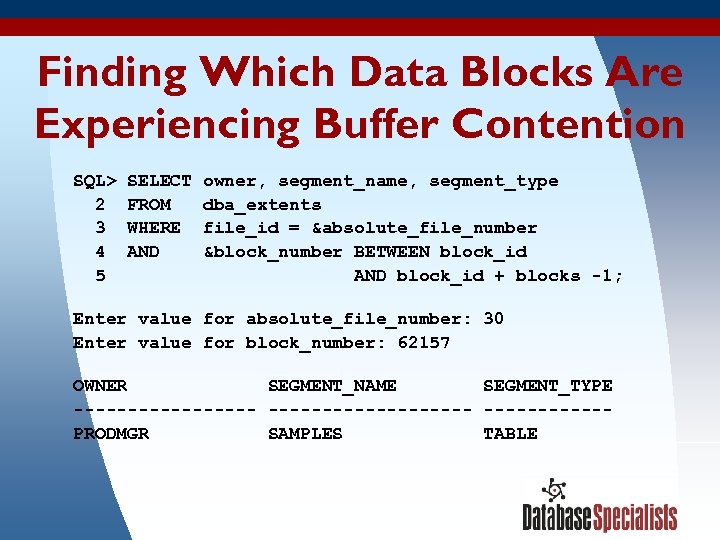
Finding Which Data Blocks Are Experiencing Buffer Contention SQL> SELECT owner, segment_name, segment_type 2 FROM dba_extents 3 WHERE file_id = &absolute_file_number 4 AND &block_number BETWEEN block_id 5 AND block_id + blocks -1; Enter value for absolute_file_number: 30 Enter value for block_number: 62157 OWNER SEGMENT_NAME SEGMENT_TYPE ------------------- PRODMGR SAMPLES TABLE 3/17/2018 42
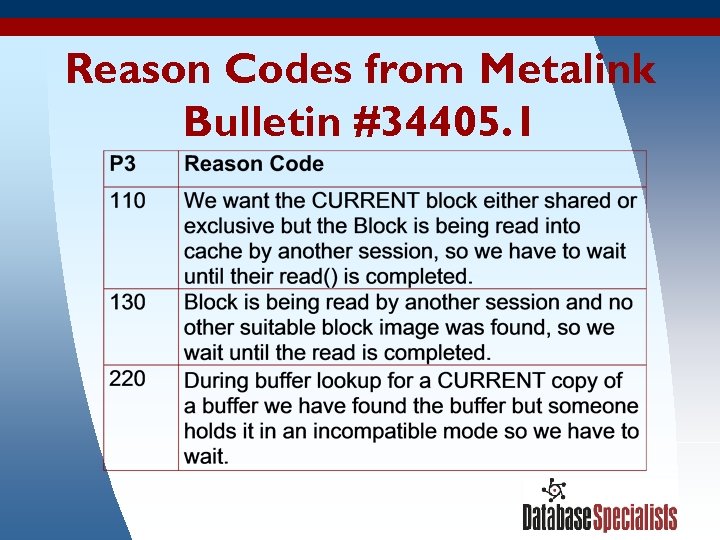
Reason Codes from Metalink Bulletin #34405. 1 3/17/2018 43
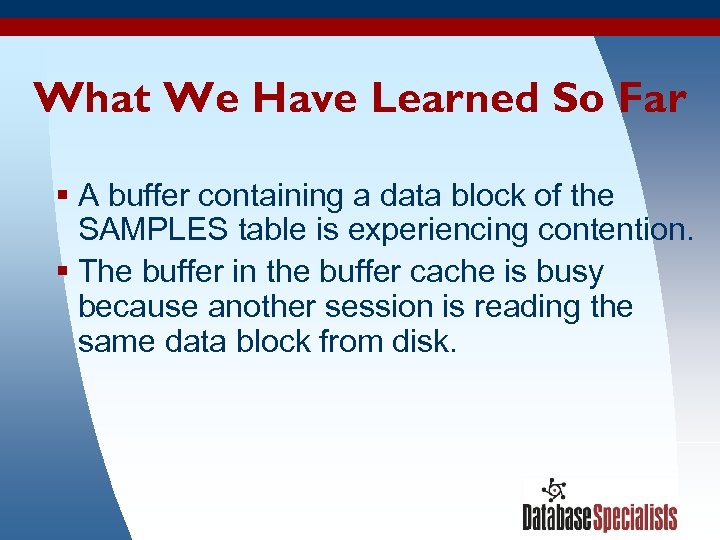
What We Have Learned So Far § A buffer containing a data block of the SAMPLES table is experiencing contention. § The buffer in the buffer cache is busy because another session is reading the same data block from disk. 3/17/2018 44
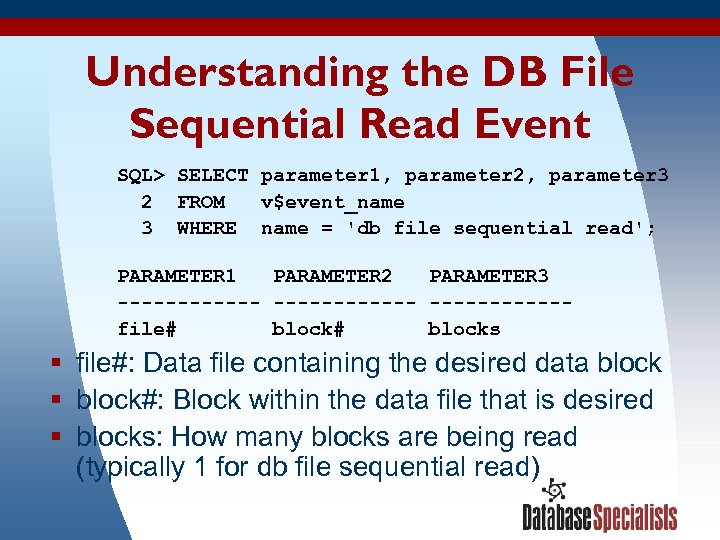
Understanding the DB File Sequential Read Event SQL> SELECT parameter 1, parameter 2, parameter 3 2 FROM v$event_name 3 WHERE name = 'db file sequential read'; PARAMETER 1 PARAMETER 2 PARAMETER 3 ------------file# blocks § file#: Data file containing the desired data block § block#: Block within the data file that is desired § blocks: How many blocks are being read (typically 1 for db file sequential read) 3/17/2018 45
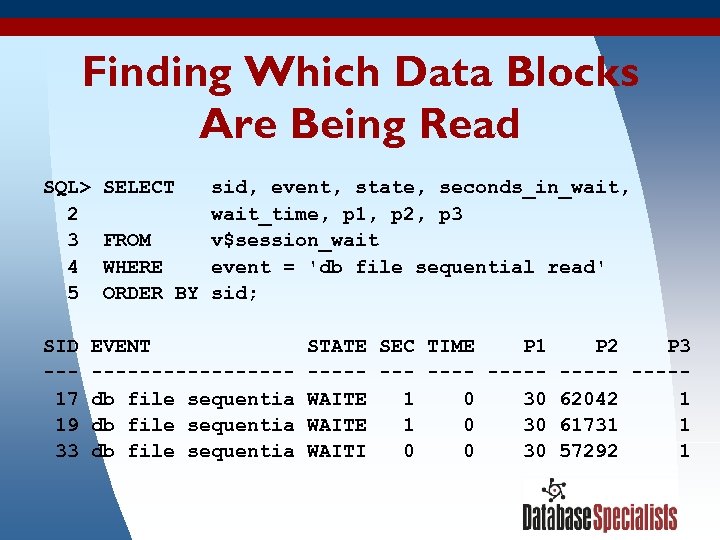
Finding Which Data Blocks Are Being Read SQL> SELECT sid, event, state, seconds_in_wait, 2 wait_time, p 1, p 2, p 3 3 FROM v$session_wait 4 WHERE event = 'db file sequential read' 5 ORDER BY sid; SID EVENT STATE SEC TIME P 1 P 2 P 3 ---------- ----- 17 db file sequentia WAITE 1 0 30 62042 1 19 db file sequentia WAITE 1 0 30 61731 1 33 db file sequentia WAITI 0 0 30 57292 1 3/17/2018 46
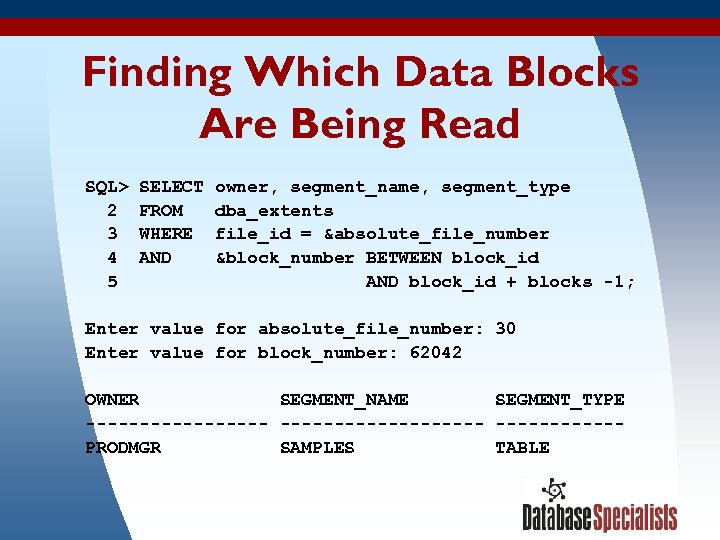
Finding Which Data Blocks Are Being Read SQL> SELECT owner, segment_name, segment_type 2 FROM dba_extents 3 WHERE file_id = &absolute_file_number 4 AND &block_number BETWEEN block_id 5 AND block_id + blocks -1; Enter value for absolute_file_number: 30 Enter value for block_number: 62042 OWNER SEGMENT_NAME SEGMENT_TYPE ------------------- PRODMGR SAMPLES TABLE 3/17/2018 47
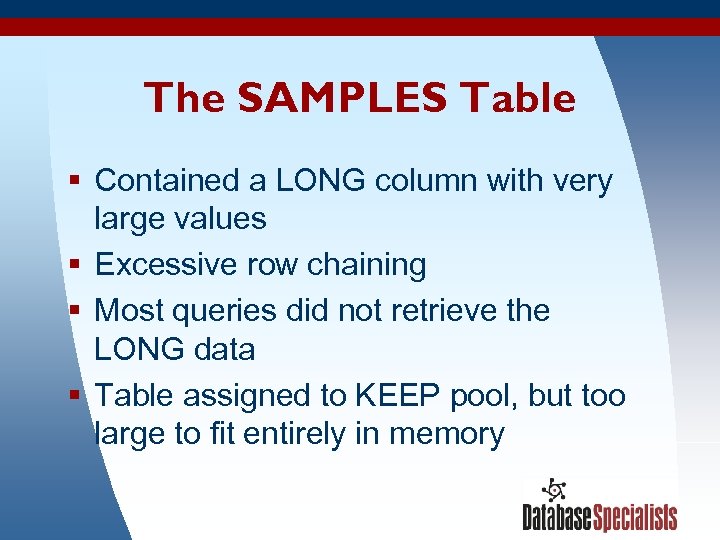
The SAMPLES Table § Contained a LONG column with very large values § Excessive row chaining § Most queries did not retrieve the LONG data § Table assigned to KEEP pool, but too large to fit entirely in memory 3/17/2018 48
Long-Term Problem Resolution § Convert the LONG column to a CLOB. § Large CLOB data will be stored in a separate LOB segment. § Row chaining will be reduced or eliminated. § The table segment will be much smaller and more likely to fit in memory. 3/17/2018 49
Short-Term Problem Resolution § Added index on most columns of SAMPLES table – Allowed most queries to avoid table segment § Enlarged KEEP pool – Allowed index segment to fit in memory 3/17/2018 50
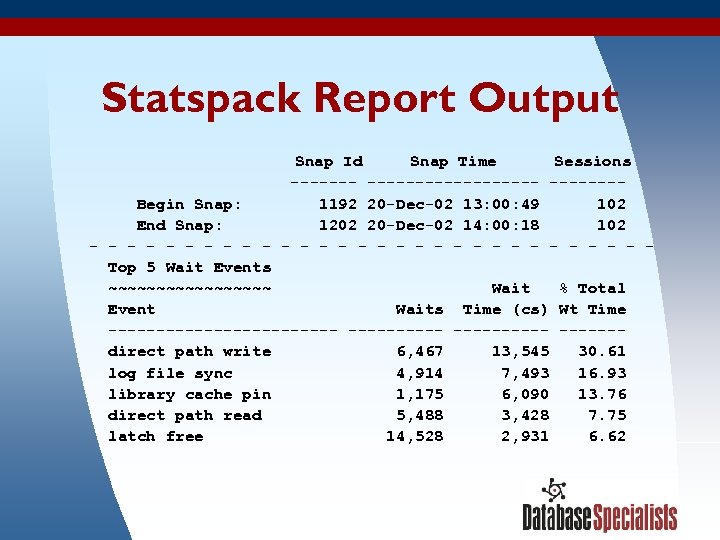
Statspack Report Output Snap Id Snap Time Sessions ------------- Begin Snap: 1192 20 -Dec-02 13: 00: 49 102 End Snap: 1202 20 -Dec-02 14: 00: 18 102 - - - - - - - - Top 5 Wait Events ~~~~~~~~~ Wait % Total Event Waits Time (cs) Wt Time ------------ ------ direct path write 6, 467 13, 545 30. 61 log file sync 4, 914 7, 493 16. 93 library cache pin 1, 175 6, 090 13. 76 direct path read 5, 488 3, 428 7. 75 latch free 14, 528 2, 931 6. 62 3/17/2018 51
What We See in the Statspack Report Now § No db file sequential read or buffer busy waits. – All data was already in the buffer cache. § Physical reads reduced by over 90%. § Total wait time on all non-idle events reduced by over 98%. – Before: 12, 786. 49 / 0. 5003 = 25, 557. 65 – After: 135. 45 / 0. 3061 = 442. 50 3/17/2018 52
What We Learned from Wait Event Information § Large amounts of time were being spent waiting on single block disk reads and buffer contention in the buffer cache. § Random samples showed the disk reads and contention involved the SAMPLES table. § The buffer contention was the result of multiple sessions needing the same block from disk. § Wait events pointed us directly to the problem segment. 3/17/2018 53
Example #2: More Buffer Busy Waits, Plus Latch Contention A genetic research company stored their data in Oracle. Applications running concurrently on many workstations would fetch raw data, process it, and put the data back in the database. But throughput bogged down as they added more workstations. 3/17/2018 54
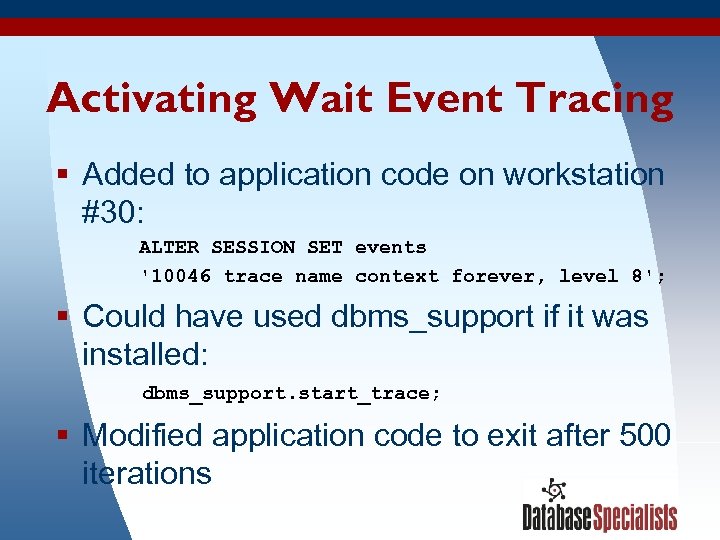
Activating Wait Event Tracing § Added to application code on workstation #30: ALTER SESSION SET events '10046 trace name context forever, level 8'; § Could have used dbms_support if it was installed: dbms_support. start_trace; § Modified application code to exit after 500 iterations 3/17/2018 55
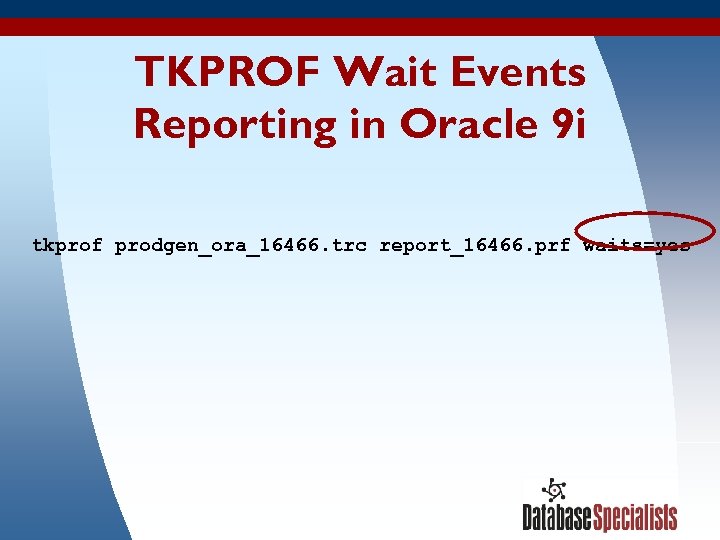
TKPROF Wait Events Reporting in Oracle 9 i tkprof prodgen_ora_16466. trc report_16466. prf waits=yes 3/17/2018 56
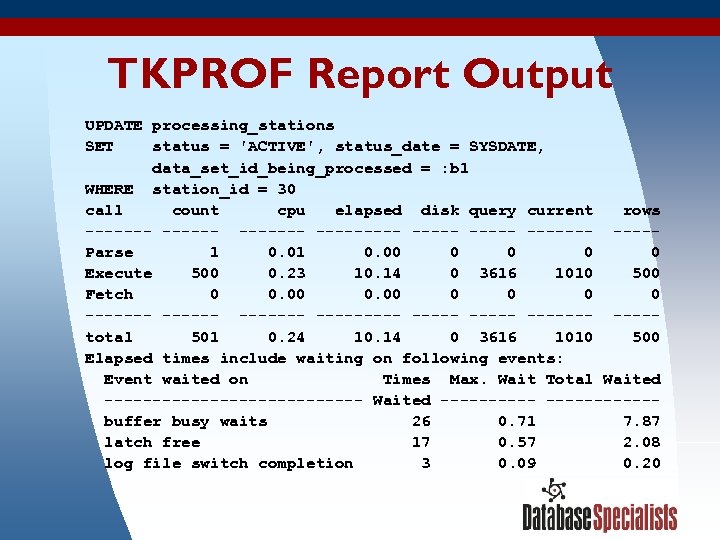
TKPROF Report Output UPDATE processing_stations SET status = 'ACTIVE', status_date = SYSDATE, data_set_id_being_processed = : b 1 WHERE station_id = 30 call count cpu elapsed disk query current rows --------- -----Parse 1 0. 00 0 0 Execute 500 0. 23 10. 14 0 3616 1010 500 Fetch 0 0. 00 0 0 ------- ------- ----total 501 0. 24 10. 14 0 3616 1010 500 Elapsed times include waiting on following events: Event waited on Times Max. Wait Total Waited -------------- Waited ----------- buffer busy waits 26 0. 71 7. 87 latch free 17 0. 57 2. 08 log file switch completion 3 0. 09 0. 20 3/17/2018 57
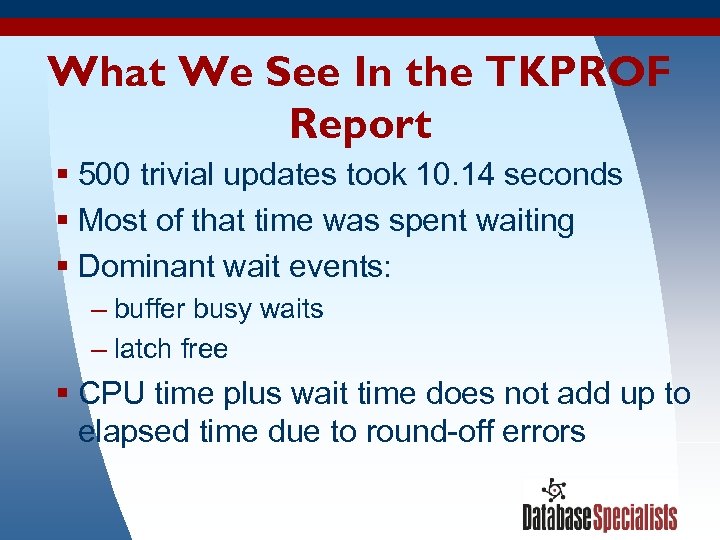
What We See In the TKPROF Report § 500 trivial updates took 10. 14 seconds § Most of that time was spent waiting § Dominant wait events: – buffer busy waits – latch free § CPU time plus wait time does not add up to elapsed time due to round-off errors 3/17/2018 58
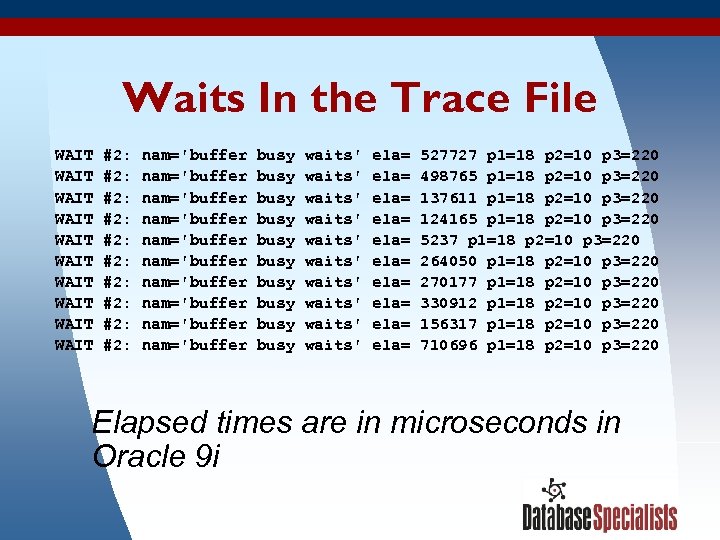
Waits In the Trace File WAIT #2: nam='buffer busy waits' ela= 527727 p 1=18 p 2=10 p 3=220 WAIT #2: nam='buffer busy waits' ela= 498765 p 1=18 p 2=10 p 3=220 WAIT #2: nam='buffer busy waits' ela= 137611 p 1=18 p 2=10 p 3=220 WAIT #2: nam='buffer busy waits' ela= 124165 p 1=18 p 2=10 p 3=220 WAIT #2: nam='buffer busy waits' ela= 5237 p 1=18 p 2=10 p 3=220 WAIT #2: nam='buffer busy waits' ela= 264050 p 1=18 p 2=10 p 3=220 WAIT #2: nam='buffer busy waits' ela= 270177 p 1=18 p 2=10 p 3=220 WAIT #2: nam='buffer busy waits' ela= 330912 p 1=18 p 2=10 p 3=220 WAIT #2: nam='buffer busy waits' ela= 156317 p 1=18 p 2=10 p 3=220 WAIT #2: nam='buffer busy waits' ela= 710696 p 1=18 p 2=10 p 3=220 Elapsed times are in microseconds in Oracle 9 i 3/17/2018 59
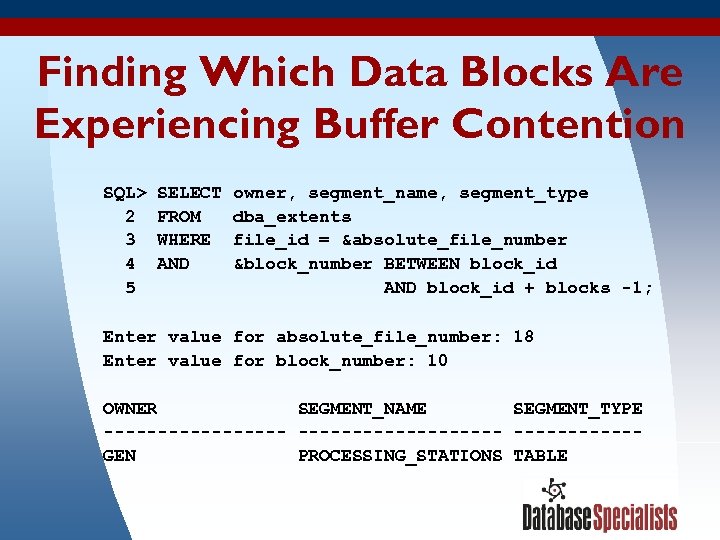
Finding Which Data Blocks Are Experiencing Buffer Contention SQL> SELECT owner, segment_name, segment_type 2 FROM dba_extents 3 WHERE file_id = &absolute_file_number 4 AND &block_number BETWEEN block_id 5 AND block_id + blocks -1; Enter value for absolute_file_number: 18 Enter value for block_number: 10 OWNER SEGMENT_NAME SEGMENT_TYPE ------------------- GEN PROCESSING_STATIONS TABLE 3/17/2018 60
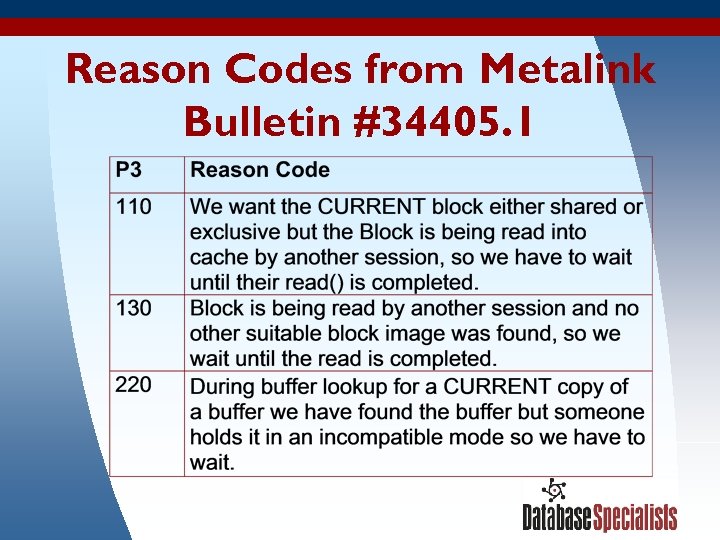
Reason Codes from Metalink Bulletin #34405. 1 3/17/2018 61
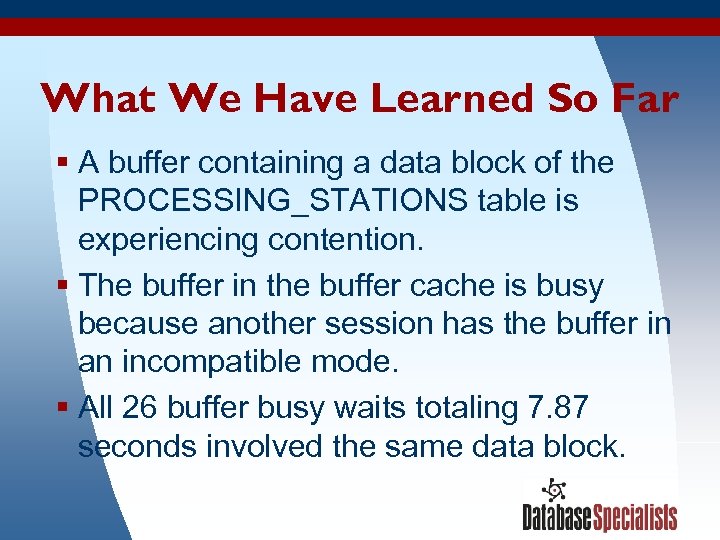
What We Have Learned So Far § A buffer containing a data block of the PROCESSING_STATIONS table is experiencing contention. § The buffer in the buffer cache is busy because another session has the buffer in an incompatible mode. § All 26 buffer busy waits totaling 7. 87 seconds involved the same data block. 3/17/2018 62
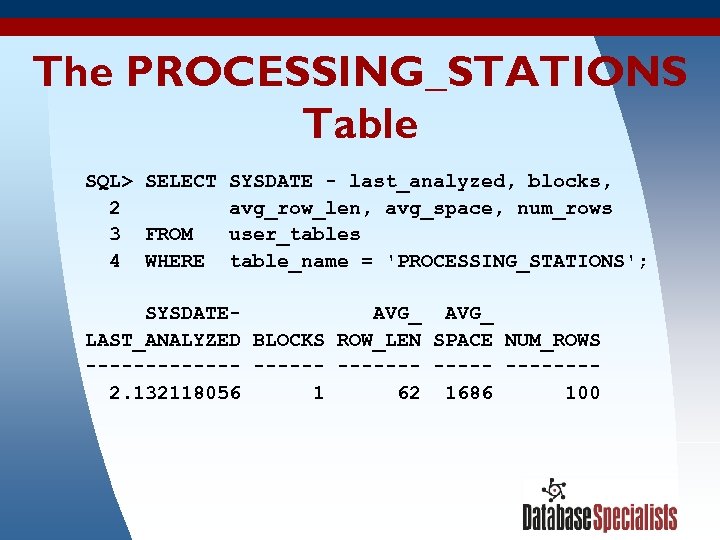
The PROCESSING_STATIONS Table SQL> SELECT SYSDATE - last_analyzed, blocks, 2 avg_row_len, avg_space, num_rows 3 FROM user_tables 4 WHERE table_name = 'PROCESSING_STATIONS'; SYSDATE- AVG_ LAST_ANALYZED BLOCKS ROW_LEN SPACE NUM_ROWS ------- ------- 2. 132118056 1 62 1686 100 3/17/2018 63
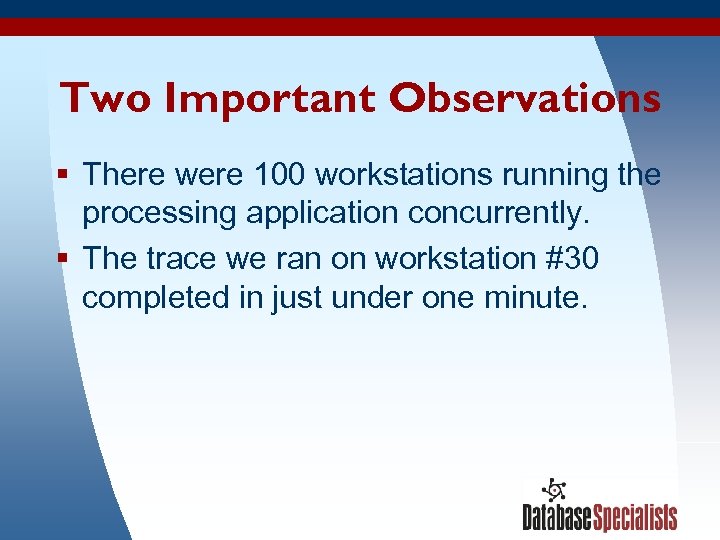
Two Important Observations § There were 100 workstations running the processing application concurrently. § The trace we ran on workstation #30 completed in just under one minute. 3/17/2018 64
Lots of Updates! § Workstation #30 updated the PROCESSING_STATIONS table 500 times in less than one minute. § If all 100 workstations do similar things: More than 50, 000 updates to one data block every minute by 100 concurrent sessions! 3/17/2018 65
Why So Many Updates? § Workstations use the PROCESSING_STATIONS table to track which workstation is processing which data set. § Processing one data set takes between 0. 1 second and 20 minutes. § Workstations update the table frequently to keep the timestamp current. This would be helpful in the event of a workstation crash. 3/17/2018 66
Long-Term Problem Resolution § Modify the application to update the PROCESSING_STATIONS table less frequently—once per data set or once per second for larger data sets: – Will reduce updates by over 80% – Buffer busy waits will disappear or dramatically decrease 3/17/2018 67
Short-Term Problem Resolution § Rebuilt the PROCESSING_STATIONS table with PCTFREE set to 99: – Oracle reserved 99% of each data block for future row expansion. – Each row got its own data block. – Each workstation session now updates a separate data block. 3/17/2018 68
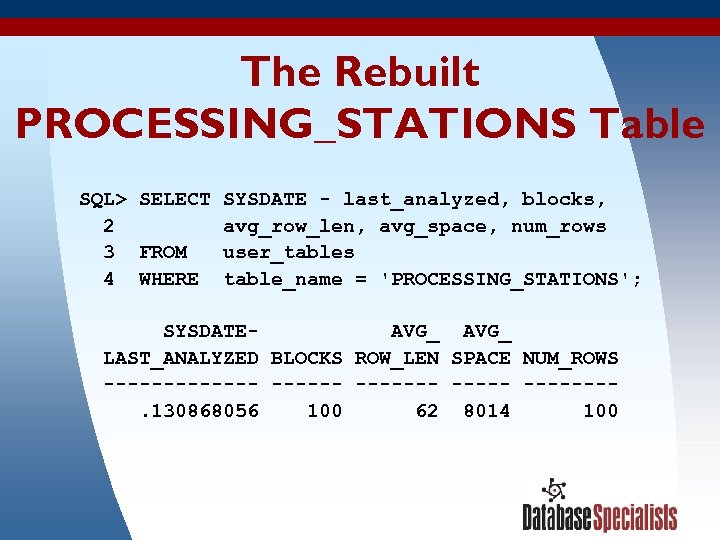
The Rebuilt PROCESSING_STATIONS Table SQL> SELECT SYSDATE - last_analyzed, blocks, 2 avg_row_len, avg_space, num_rows 3 FROM user_tables 4 WHERE table_name = 'PROCESSING_STATIONS'; SYSDATE- AVG_ LAST_ANALYZED BLOCKS ROW_LEN SPACE NUM_ROWS ------- ------- . 130868056 100 62 8014 100 3/17/2018 69
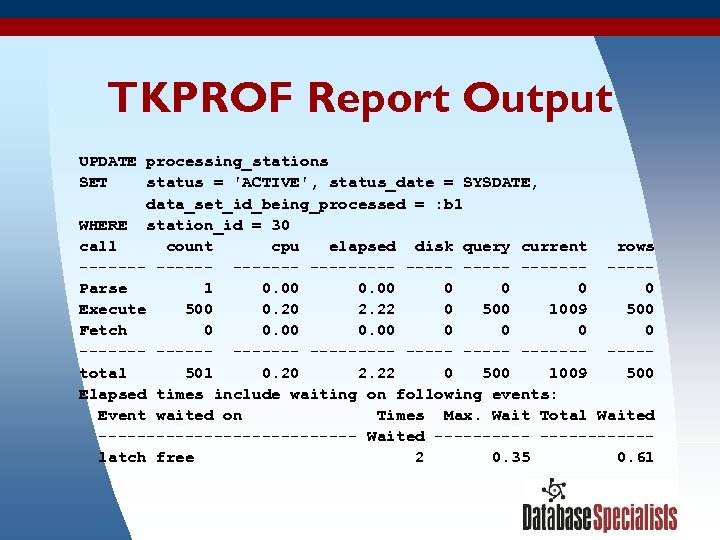
TKPROF Report Output UPDATE processing_stations SET status = 'ACTIVE', status_date = SYSDATE, data_set_id_being_processed = : b 1 WHERE station_id = 30 call count cpu elapsed disk query current rows --------- -----Parse 1 0. 00 0 0 Execute 500 0. 20 2. 22 0 500 1009 500 Fetch 0 0. 00 0 0 ------- ------- ----total 501 0. 20 2. 22 0 500 1009 500 Elapsed times include waiting on following events: Event waited on Times Max. Wait Total Waited -------------- Waited ----------- latch free 2 0. 35 0. 61 3/17/2018 70
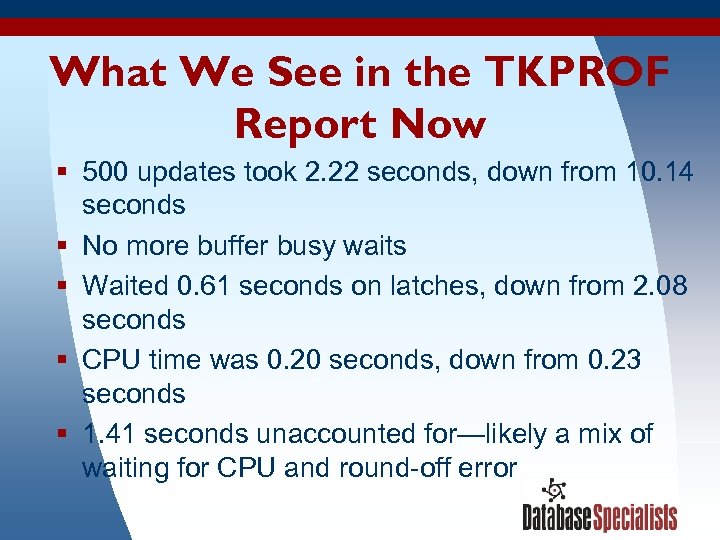
What We See in the TKPROF Report Now § 500 updates took 2. 22 seconds, down from 10. 14 seconds § No more buffer busy waits § Waited 0. 61 seconds on latches, down from 2. 08 seconds § CPU time was 0. 20 seconds, down from 0. 23 seconds § 1. 41 seconds unaccounted for—likely a mix of waiting for CPU and round-off error 3/17/2018 71
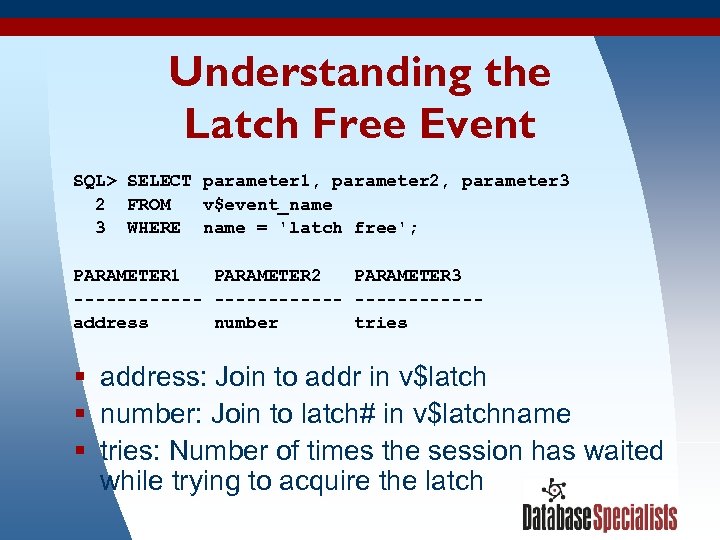
Understanding the Latch Free Event SQL> SELECT parameter 1, parameter 2, parameter 3 2 FROM v$event_name 3 WHERE name = 'latch free'; PARAMETER 1 PARAMETER 2 PARAMETER 3 ------------address number tries § address: Join to addr in v$latch § number: Join to latch# in v$latchname § tries: Number of times the session has waited while trying to acquire the latch 3/17/2018 72
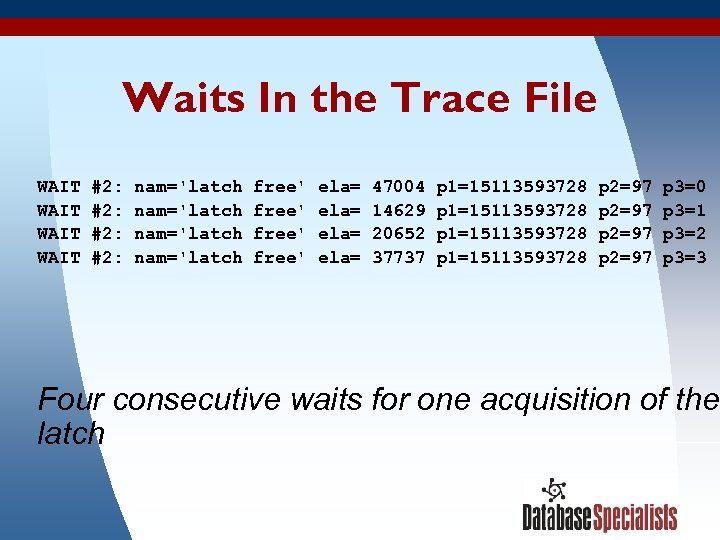
Waits In the Trace File WAIT #2: nam='latch free' ela= 47004 p 1=15113593728 p 2=97 p 3=0 WAIT #2: nam='latch free' ela= 14629 p 1=15113593728 p 2=97 p 3=1 WAIT #2: nam='latch free' ela= 20652 p 1=15113593728 p 2=97 p 3=2 WAIT #2: nam='latch free' ela= 37737 p 1=15113593728 p 2=97 p 3=3 Four consecutive waits for one acquisition of the latch 3/17/2018 73
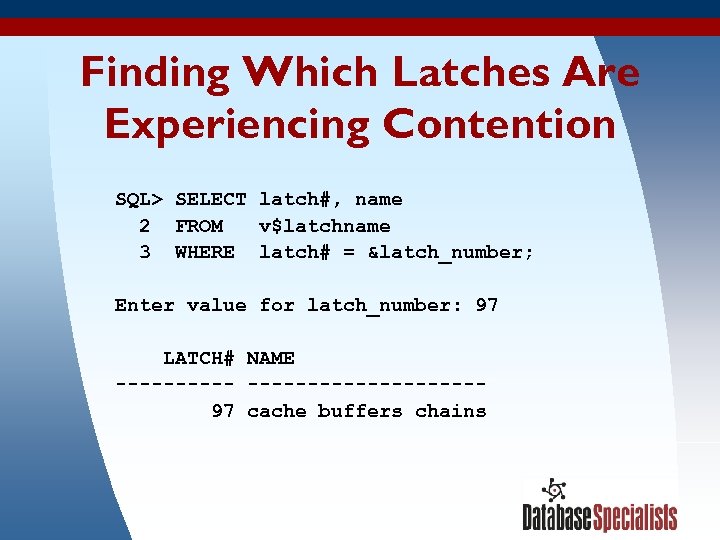
Finding Which Latches Are Experiencing Contention SQL> SELECT latch#, name 2 FROM v$latchname 3 WHERE latch# = &latch_number; Enter value for latch_number: 97 LATCH# NAME --------------- 97 cache buffers chains 3/17/2018 74
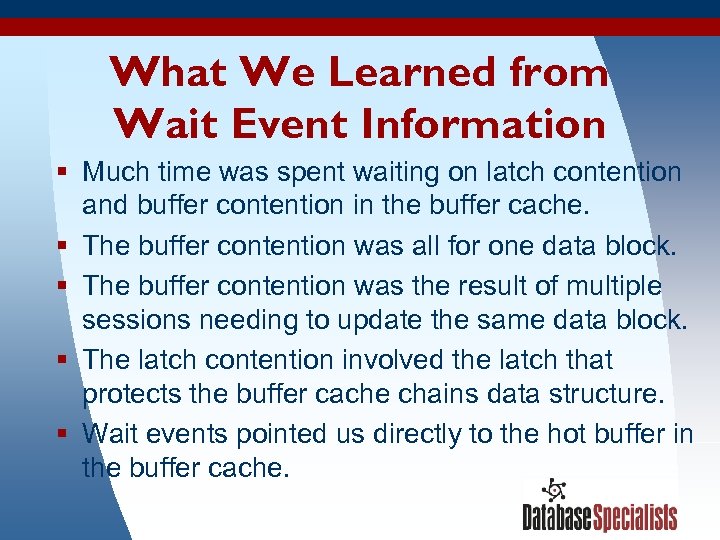
What We Learned from Wait Event Information § Much time was spent waiting on latch contention and buffer contention in the buffer cache. § The buffer contention was all for one data block. § The buffer contention was the result of multiple sessions needing to update the same data block. § The latch contention involved the latch that protects the buffer cache chains data structure. § Wait events pointed us directly to the hot buffer in the buffer cache. 3/17/2018 75
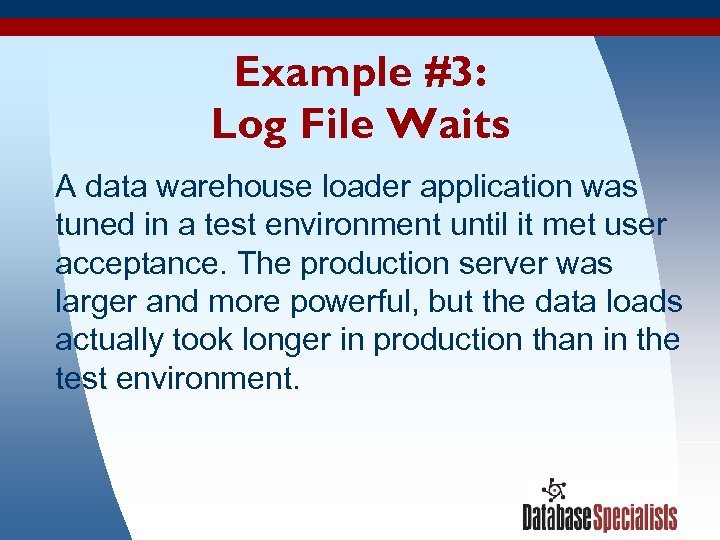
Example #3: Log File Waits A data warehouse loader application was tuned in a test environment until it met user acceptance. The production server was larger and more powerful, but the data loads actually took longer in production than in the test environment. 3/17/2018 76
Summarizing Wait Events During A Period of Time § v$system_event shows wait event totals since instance startup. § v$session_event shows wait event totals since the beginning of a session. § You can capture view contents at different points in time and compute the delta in order to get wait event information for a specific period of time. § Statspack and many third-party tools can do this, but a simple script has less overhead and can be quicker to deploy. 3/17/2018 77
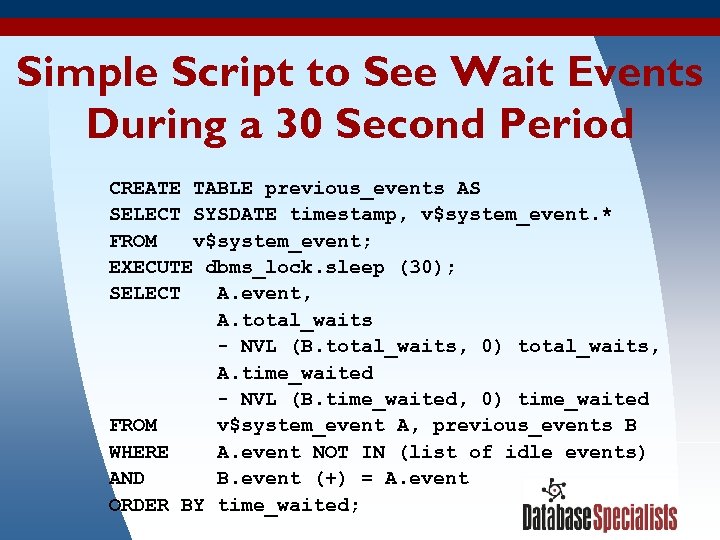
Simple Script to See Wait Events During a 30 Second Period CREATE TABLE previous_events AS SELECT SYSDATE timestamp, v$system_event. * FROM v$system_event; EXECUTE dbms_lock. sleep (30); SELECT A. event, A. total_waits - NVL (B. total_waits, 0) total_waits, A. time_waited - NVL (B. time_waited, 0) time_waited FROM v$system_event A, previous_events B WHERE A. event NOT IN (list of idle events) AND B. event (+) = A. event 3/17/2018 78 ORDER BY time_waited;
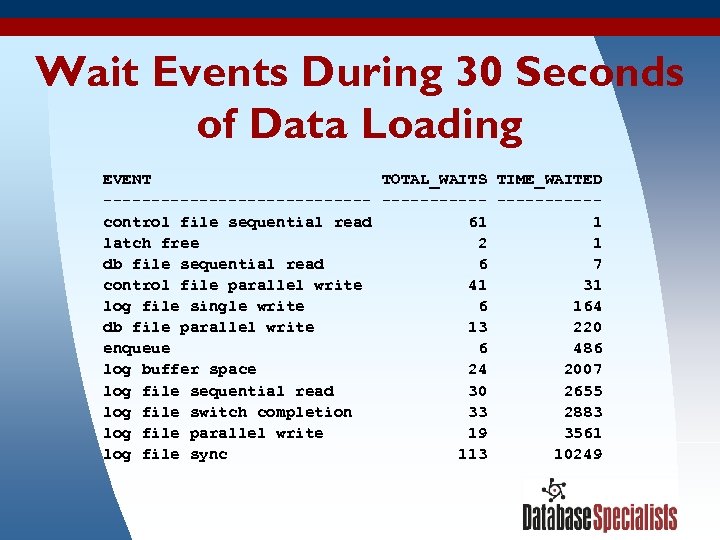
Wait Events During 30 Seconds of Data Loading EVENT TOTAL_WAITS TIME_WAITED -------------- -----control file sequential read 61 1 latch free 2 1 db file sequential read 6 7 control file parallel write 41 31 log file single write 6 164 db file parallel write 13 220 enqueue 6 486 log buffer space 24 2007 log file sequential read 30 2655 log file switch completion 33 2883 log file parallel write 19 3561 log file sync 113 10249 3/17/2018 79
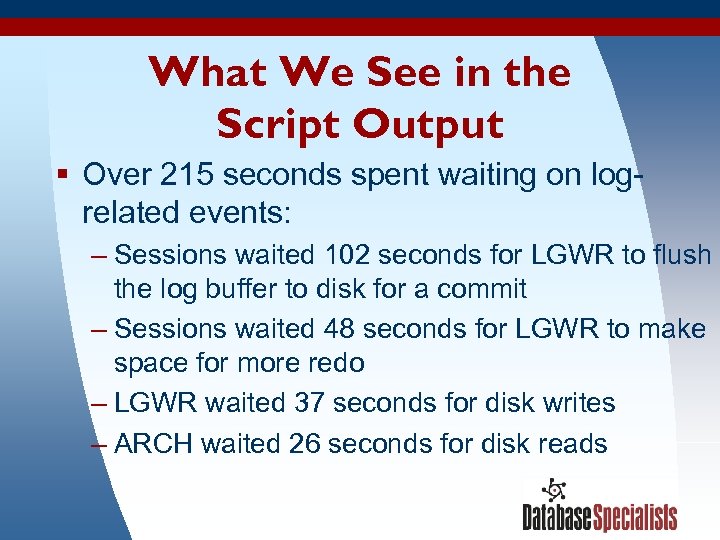
What We See in the Script Output § Over 215 seconds spent waiting on logrelated events: – Sessions waited 102 seconds for LGWR to flush the log buffer to disk for a commit – Sessions waited 48 seconds for LGWR to make space for more redo – LGWR waited 37 seconds for disk writes – ARCH waited 26 seconds for disk reads 3/17/2018 80
Investigate the Redo Log § Check production online redo log location for contention and slow hardware: – All log files located on one disk – Same disk held hot files for another database § Compare to test environment: – Log files located on a striped volume – Minimal other activity on the volume – Database in NOARCHIVELOG mode 3/17/2018 81
Problem Resolution § Sped up online redo log file performance: – Moved log files to dedicated disks – Spread log files over multiple disks 3/17/2018 82
What We Learned from Wait Event Information § The disk I/O speed writing and reading the online redo log files was the bottleneck slowing down the data warehouse load. § Wait events pointed us directly to the area within Oracle that was holding up the works. 3/17/2018 83
Example #4: Direct Path I/O Waits Analysts in a customer service unit were satisfied with the response time when they queried individual customer orders from their data warehouse. However, queries involving summarizations of multiple orders were unacceptably slow. 3/17/2018 84
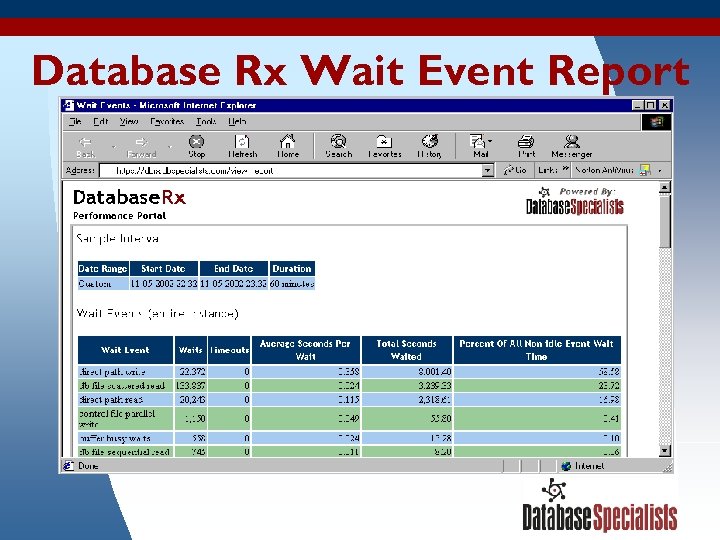
Database Rx Wait Event Report 3/17/2018 85
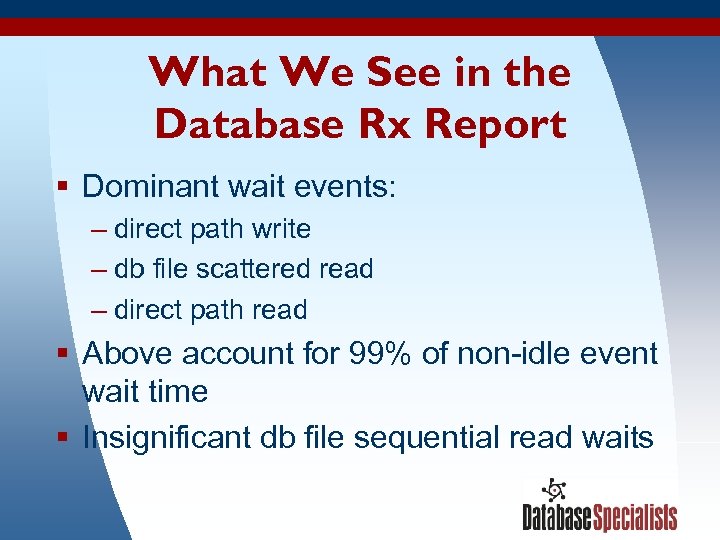
What We See in the Database Rx Report § Dominant wait events: – direct path write – db file scattered read – direct path read § Above account for 99% of non-idle event wait time § Insignificant db file sequential read waits 3/17/2018 86
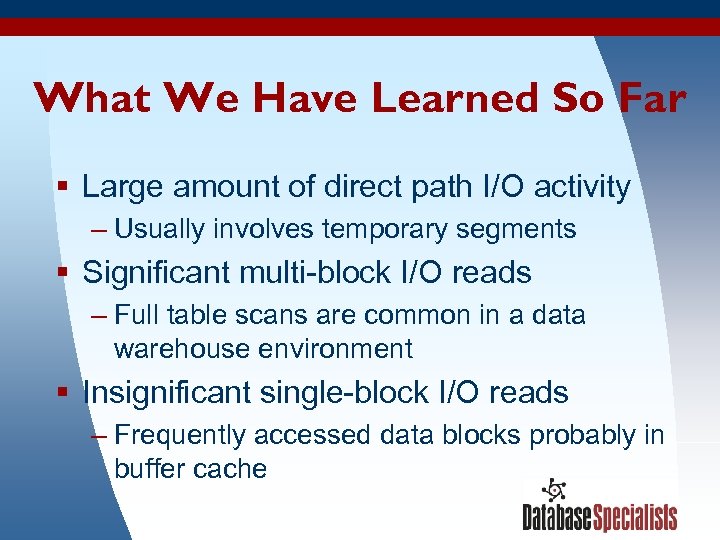
What We Have Learned So Far § Large amount of direct path I/O activity – Usually involves temporary segments § Significant multi-block I/O reads – Full table scans are common in a data warehouse environment § Insignificant single-block I/O reads – Frequently accessed data blocks probably in buffer cache 3/17/2018 87
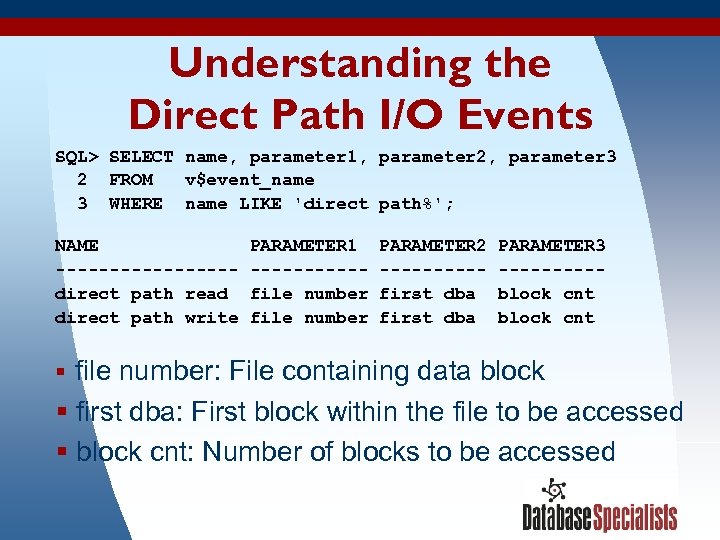
Understanding the Direct Path I/O Events SQL> SELECT name, parameter 1, parameter 2, parameter 3 2 FROM v$event_name 3 WHERE name LIKE 'direct path%'; NAME PARAMETER 1 PARAMETER 2 PARAMETER 3 ---------- -----direct path read file number first dba block cnt direct path write file number first dba block cnt § file number: File containing data block § first dba: First block within the file to be accessed § block cnt: Number of blocks to be accessed 3/17/2018 88
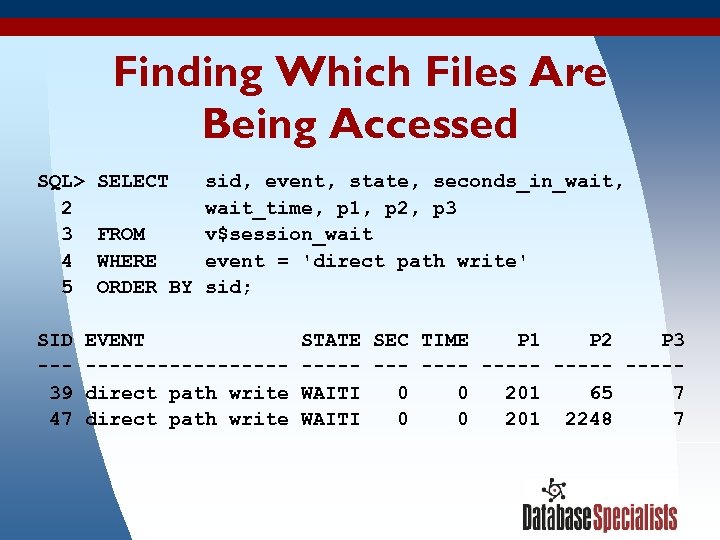
Finding Which Files Are Being Accessed SQL> SELECT sid, event, state, seconds_in_wait, 2 wait_time, p 1, p 2, p 3 3 FROM v$session_wait 4 WHERE event = 'direct path write' 5 ORDER BY sid; SID EVENT STATE SEC TIME P 1 P 2 P 3 ---------- ----- 39 direct path write WAITI 0 0 201 65 7 47 direct path write WAITI 0 0 201 2248 7 3/17/2018 89
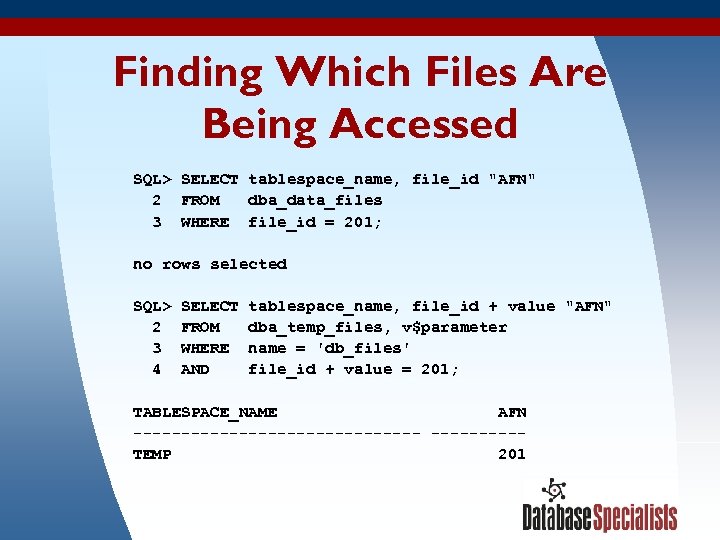
Finding Which Files Are Being Accessed SQL> SELECT tablespace_name, file_id "AFN" 2 FROM dba_data_files 3 WHERE file_id = 201; no rows selected SQL> SELECT tablespace_name, file_id + value "AFN" 2 FROM dba_temp_files, v$parameter 3 WHERE name = 'db_files' 4 AND file_id + value = 201; TABLESPACE_NAME AFN ---------------TEMP 201 3/17/2018 90
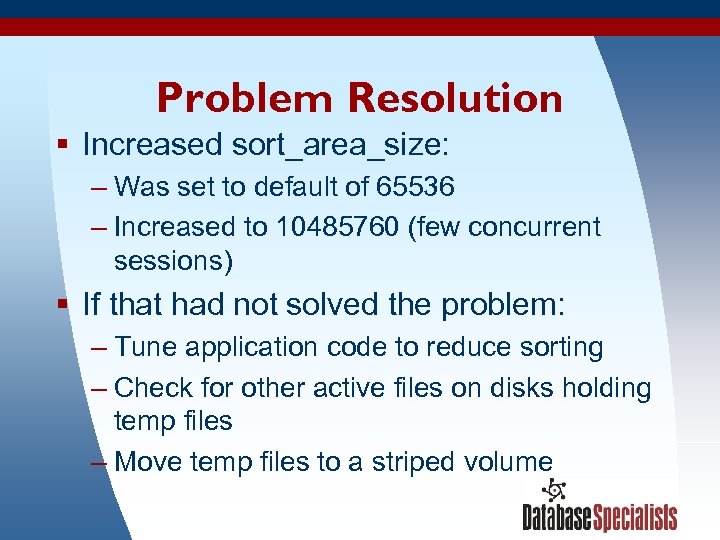
Problem Resolution § Increased sort_area_size: – Was set to default of 65536 – Increased to 10485760 (few concurrent sessions) § If that had not solved the problem: – Tune application code to reduce sorting – Check for other active files on disks holding temp files – Move temp files to a striped volume 3/17/2018 91
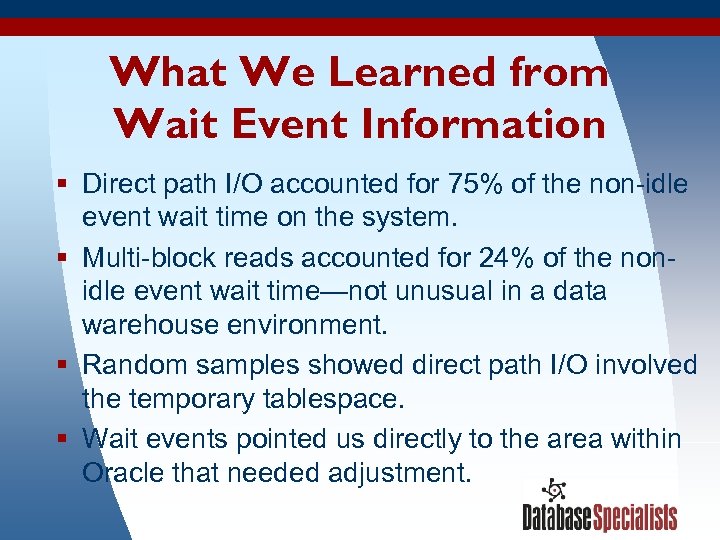
What We Learned from Wait Event Information § Direct path I/O accounted for 75% of the non-idle event wait time on the system. § Multi-block reads accounted for 24% of the nonidle event wait time—not unusual in a data warehouse environment. § Random samples showed direct path I/O involved the temporary tablespace. § Wait events pointed us directly to the area within Oracle that needed adjustment. 3/17/2018 92
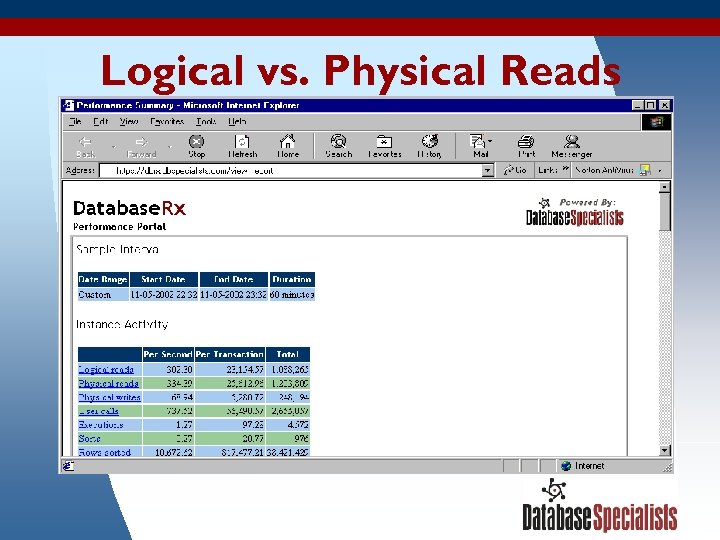
Logical vs. Physical Reads 3/17/2018 93
Logical vs. Physical Reads § During the Database Rx sample interval there were more physical reads than logical reads. § Direct path reads count as physical reads but not logical reads. § Be careful how you compute your buffer cache hit ratios—in this example you might come up with a negative figure! 3/17/2018 94
Example #5: Database Link Wait Events A company had five Oracle databases, one per region. Due to human error, the same customer transactions would sometimes get loaded into multiple databases. A report was built to identify these duplicates, but it took 30 minutes to run. 3/17/2018 95
Isolating a Query and Analyzing Its Wait Events § Start a new database session in SQL*Plus or a similar tool. § Run the query. § Monitor the session’s wait events and statistics from another session: – v$session_event – v$sesstat § This is a handy technique when you know which statement is the bottleneck. 3/17/2018 96
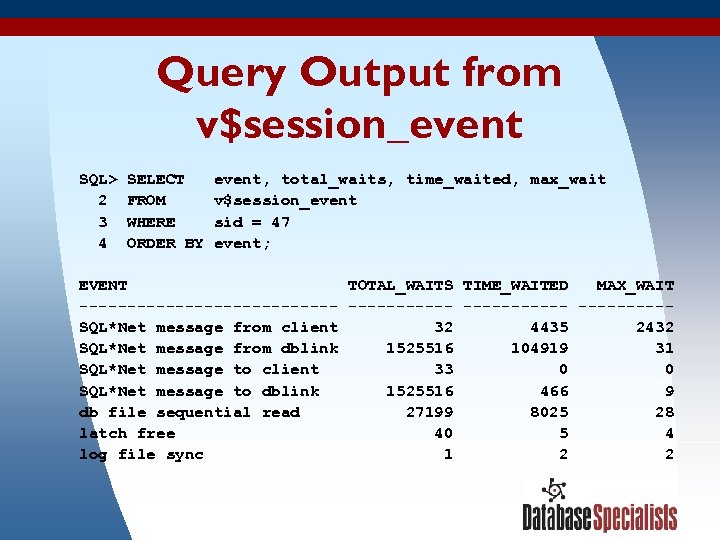
Query Output from v$session_event SQL> SELECT event, total_waits, time_waited, max_wait 2 FROM v$session_event 3 WHERE sid = 47 4 ORDER BY event; EVENT TOTAL_WAITS TIME_WAITED MAX_WAIT -------------- -----SQL*Net message from client 32 4435 2432 SQL*Net message from dblink 1525516 104919 31 SQL*Net message to client 33 0 SQL*Net message to dblink 1525516 466 9 db file sequential read 27199 8025 28 latch free 40 5 4 log file sync 1 2 3/17/2018 97

Query Output from v$sesstat SQL> SELECT A. name, B. value 2 FROM v$statname A, v$sesstat B 3 WHERE A. statistic# = 12 4 AND B. statistic# = A. statistic# 5 AND B. sid = 47; NAME VALUE --------------- CPU used by this session 67937 3/17/2018 98
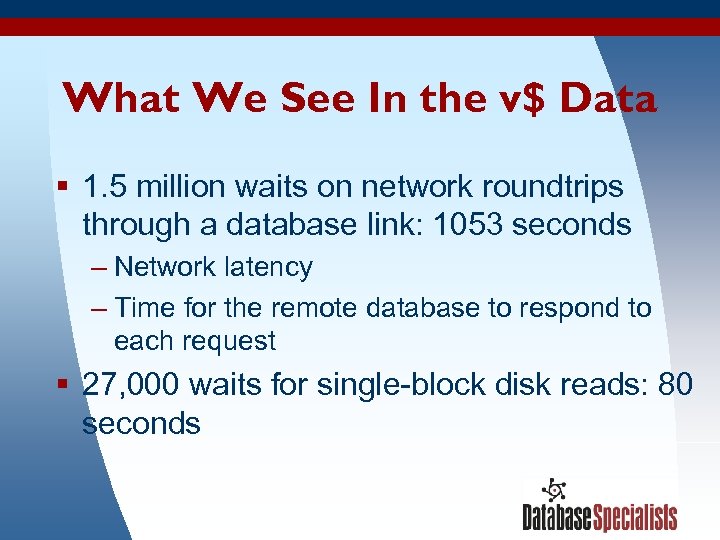
What We See In the v$ Data § 1. 5 million waits on network roundtrips through a database link: 1053 seconds – Network latency – Time for the remote database to respond to each request § 27, 000 waits for single-block disk reads: 80 seconds 3/17/2018 99
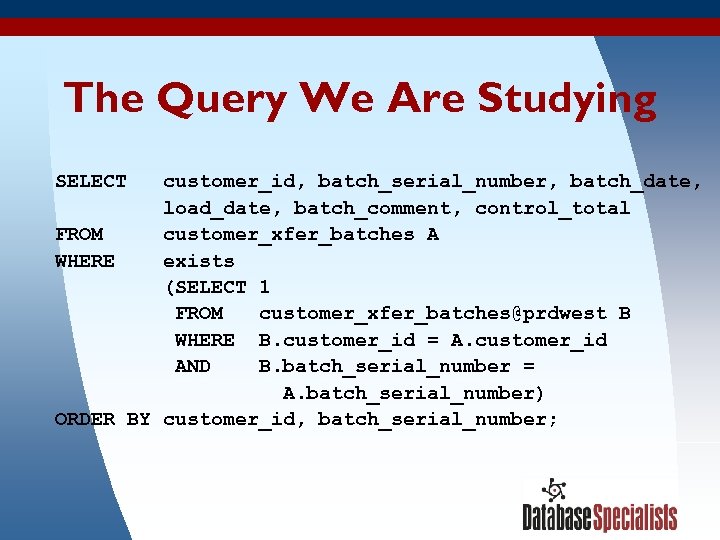
The Query We Are Studying SELECT customer_id, batch_serial_number, batch_date, load_date, batch_comment, control_total FROM customer_xfer_batches A WHERE exists (SELECT 1 FROM customer_xfer_batches@prdwest B WHERE B. customer_id = A. customer_id AND B. batch_serial_number = A. batch_serial_number) ORDER BY customer_id, batch_serial_number; 3/17/2018 100
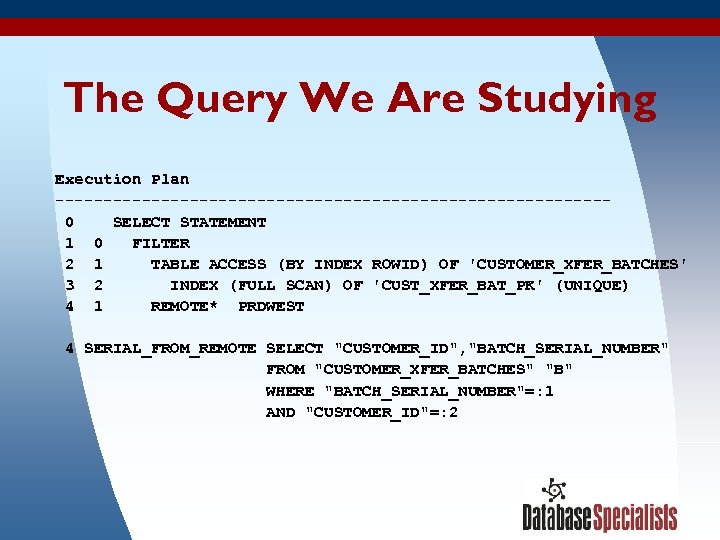
The Query We Are Studying Execution Plan ----------------------------- 0 SELECT STATEMENT 1 0 FILTER 2 1 TABLE ACCESS (BY INDEX ROWID) OF 'CUSTOMER_XFER_BATCHES' 3 2 INDEX (FULL SCAN) OF 'CUST_XFER_BAT_PK' (UNIQUE) 4 1 REMOTE* PRDWEST 4 SERIAL_FROM_REMOTE SELECT "CUSTOMER_ID", "BATCH_SERIAL_NUMBER" FROM "CUSTOMER_XFER_BATCHES" "B" WHERE "BATCH_SERIAL_NUMBER"=: 1 AND "CUSTOMER_ID"=: 2 3/17/2018 101
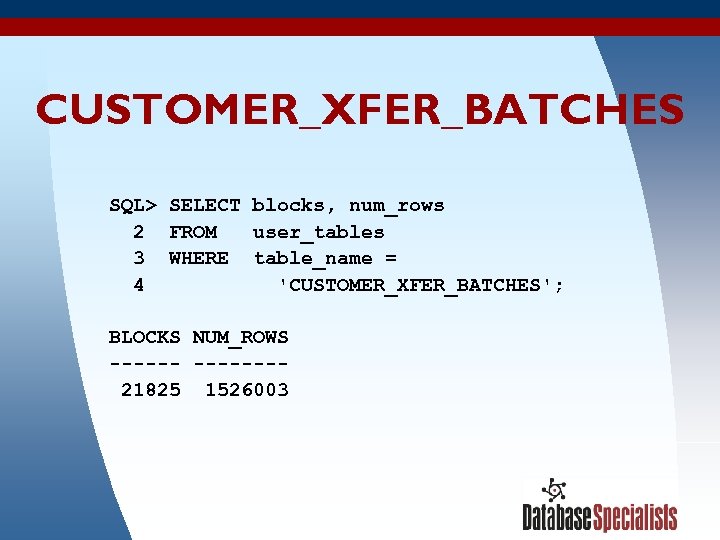
CUSTOMER_XFER_BATCHES SQL> SELECT blocks, num_rows 2 FROM user_tables 3 WHERE table_name = 4 'CUSTOMER_XFER_BATCHES'; BLOCKS NUM_ROWS ------- 21825 1526003 3/17/2018 102
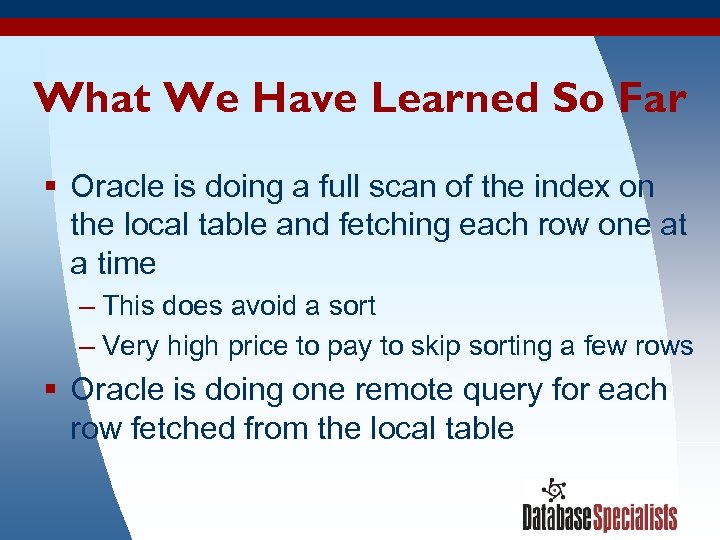
What We Have Learned So Far § Oracle is doing a full scan of the index on the local table and fetching each row one at a time – This does avoid a sort – Very high price to pay to skip sorting a few rows § Oracle is doing one remote query for each row fetched from the local table 3/17/2018 103
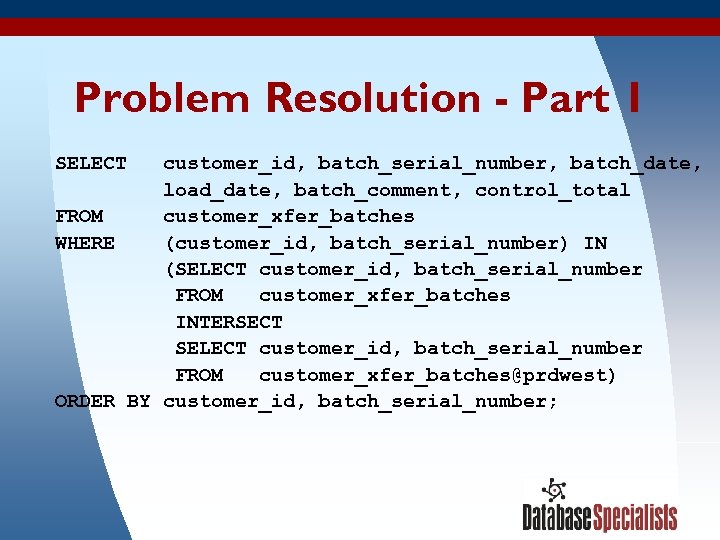
Problem Resolution - Part 1 SELECT customer_id, batch_serial_number, batch_date, load_date, batch_comment, control_total FROM customer_xfer_batches WHERE (customer_id, batch_serial_number) IN (SELECT customer_id, batch_serial_number FROM customer_xfer_batches INTERSECT SELECT customer_id, batch_serial_number FROM customer_xfer_batches@prdwest) ORDER BY customer_id, batch_serial_number; 3/17/2018 104
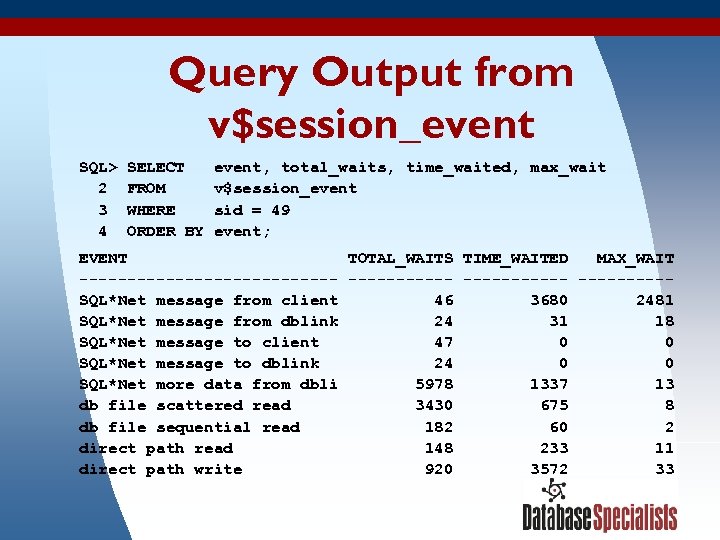
Query Output from v$session_event SQL> SELECT event, total_waits, time_waited, max_wait 2 FROM v$session_event 3 WHERE sid = 49 4 ORDER BY event; EVENT TOTAL_WAITS TIME_WAITED MAX_WAIT -------------- -----SQL*Net message from client 46 3680 2481 SQL*Net message from dblink 24 31 18 SQL*Net message to client 47 0 SQL*Net message to dblink 24 0 SQL*Net more data from dbli 5978 1337 13 db file scattered read 3430 675 8 db file sequential read 182 60 2 direct path read 148 233 11 direct path write 920 3572 33 3/17/2018 105
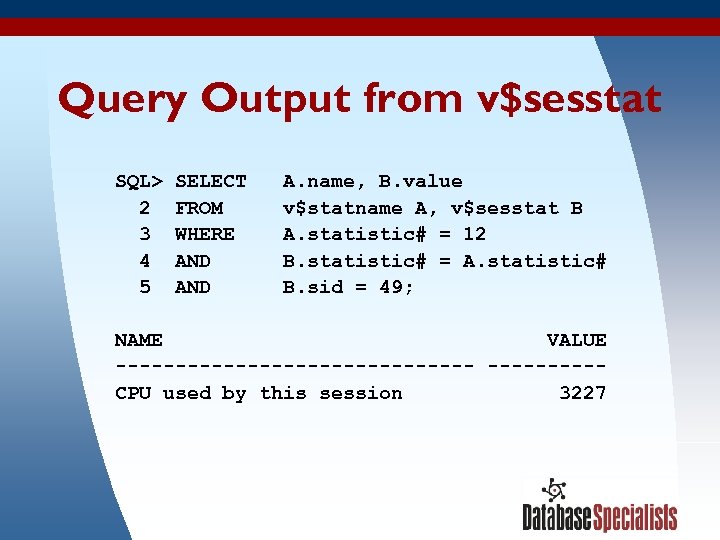
Query Output from v$sesstat SQL> SELECT A. name, B. value 2 FROM v$statname A, v$sesstat B 3 WHERE A. statistic# = 12 4 AND B. statistic# = A. statistic# 5 AND B. sid = 49; NAME VALUE --------------- CPU used by this session 3227 3/17/2018 106
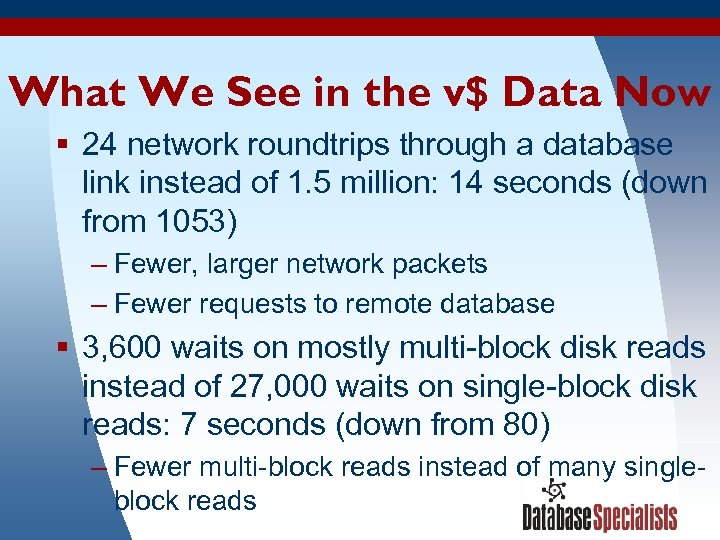
What We See in the v$ Data Now § 24 network roundtrips through a database link instead of 1. 5 million: 14 seconds (down from 1053) – Fewer, larger network packets – Fewer requests to remote database § 3, 600 waits on mostly multi-block disk reads instead of 27, 000 waits on single-block disk reads: 7 seconds (down from 80) – Fewer multi-block reads instead of many single 3/17/2018 107 block reads
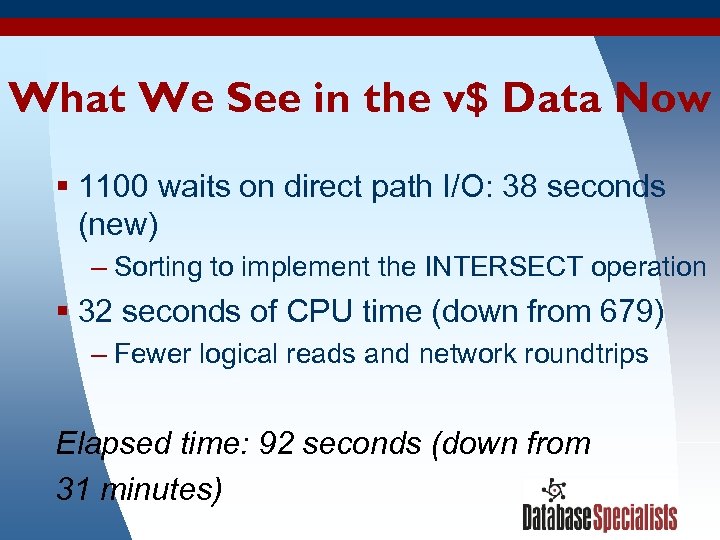
What We See in the v$ Data Now § 1100 waits on direct path I/O: 38 seconds (new) – Sorting to implement the INTERSECT operation § 32 seconds of CPU time (down from 679) – Fewer logical reads and network roundtrips Elapsed time: 92 seconds (down from 31 minutes) 3/17/2018 108
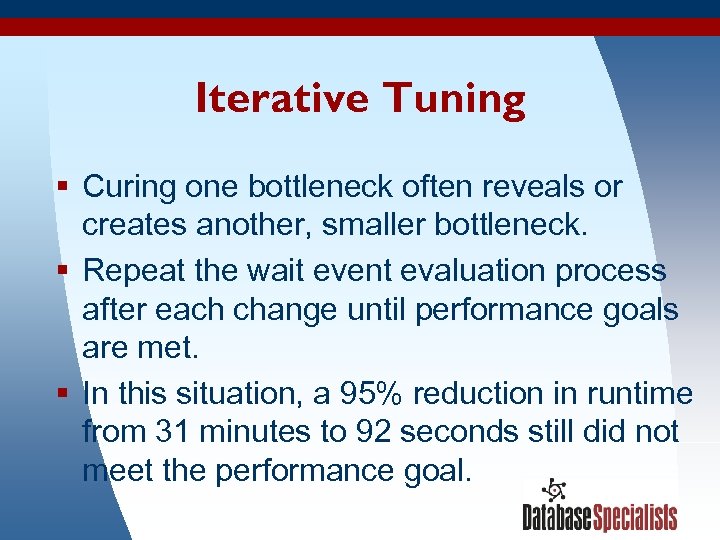
Iterative Tuning § Curing one bottleneck often reveals or creates another, smaller bottleneck. § Repeat the wait event evaluation process after each change until performance goals are met. § In this situation, a 95% reduction in runtime from 31 minutes to 92 seconds still did not meet the performance goal. 3/17/2018 109
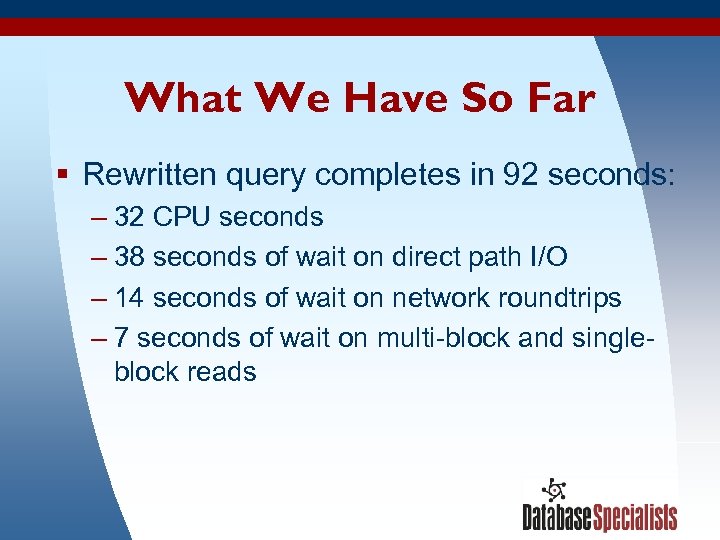
What We Have So Far § Rewritten query completes in 92 seconds: – 32 CPU seconds – 38 seconds of wait on direct path I/O – 14 seconds of wait on network roundtrips – 7 seconds of wait on multi-block and singleblock reads 3/17/2018 110
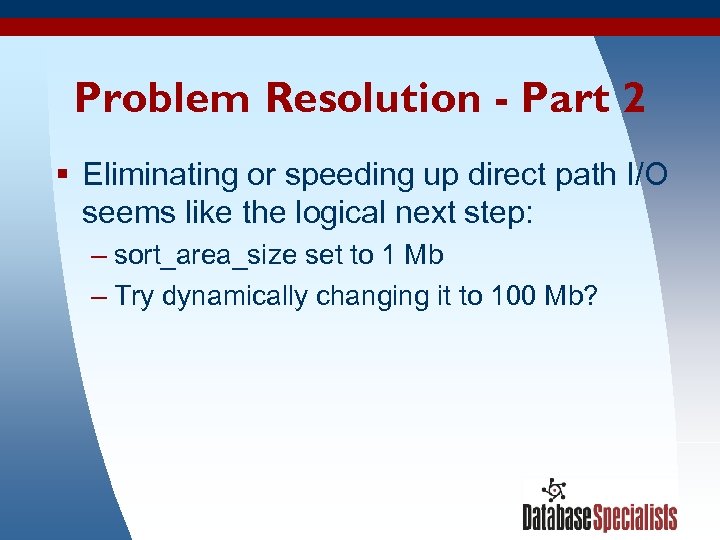
Problem Resolution - Part 2 § Eliminating or speeding up direct path I/O seems like the logical next step: – sort_area_size set to 1 Mb – Try dynamically changing it to 100 Mb? 3/17/2018 111
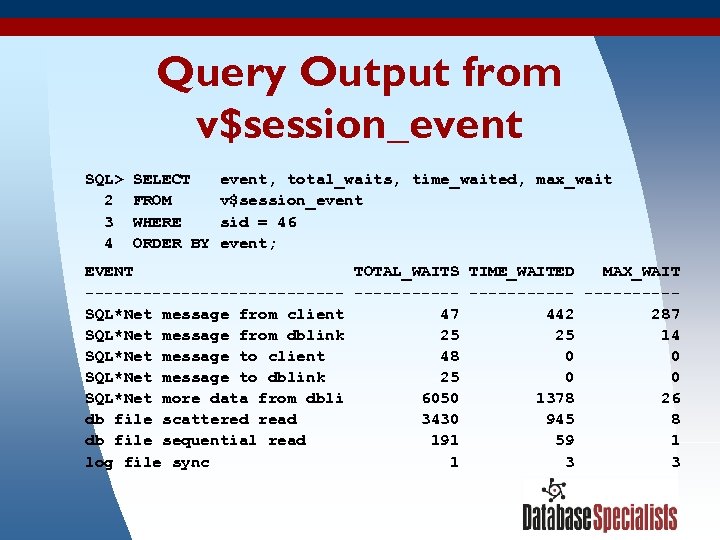
Query Output from v$session_event SQL> SELECT event, total_waits, time_waited, max_wait 2 FROM v$session_event 3 WHERE sid = 46 4 ORDER BY event; EVENT TOTAL_WAITS TIME_WAITED MAX_WAIT -------------- -----SQL*Net message from client 47 442 287 SQL*Net message from dblink 25 14 SQL*Net message to client 48 0 SQL*Net message to dblink 25 0 SQL*Net more data from dbli 6050 1378 26 db file scattered read 3430 945 8 db file sequential read 191 59 1 log file sync 1 3 3/17/2018 112
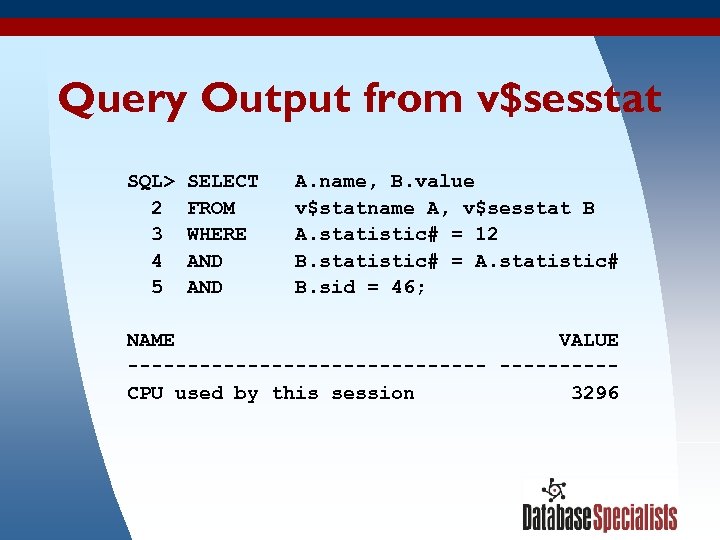
Query Output from v$sesstat SQL> SELECT A. name, B. value 2 FROM v$statname A, v$sesstat B 3 WHERE A. statistic# = 12 4 AND B. statistic# = A. statistic# 5 AND B. sid = 46; NAME VALUE --------------- CPU used by this session 3296 3/17/2018 113
What We See in the v$ Data Now § Waits on network roundtrips through a database link, multi-block reads, and singleblock reads unchanged § CPU time used unchanged § Direct path I/O waits eliminated completely – Entire sort now performed in memory Elapsed time: 55 seconds (down from 92) 3/17/2018 114
What We Learned from Wait Event Information § A query ran slowly due to excessive network roundtrips and single-block reads. § After these problems were corrected, 40% of the query execution time was devoted to sorting to disk. § Wait events showed us how Oracle was spending its time while executing the query, helping us improve the query’s performance in an iterative fashion. 3/17/2018 115
A Summary Of Wait Event Techniques § Using Statspack snapshots and reports to analyze wait events at the instance level § Polling v$session_wait to determine which buffers or latches have contention § Enabling wait event tracing in a session § Using Oracle 9 i TKPROF to tabulate waits at the statement level within one session 3/17/2018 116
A Summary Of Wait Event Techniques (continued) § Collecting wait event data for a session or the entire instance at two different times and computing the difference to find the wait events during a specific period of time § Ranking cumulative wait event data in order to see which wait events account for the most wait time § Isolating a statement and analyzing its wait events 3/17/2018 117

Send Us Your Wait Event Puzzles § We are always looking for interesting wait event situations to learn from! § If you are trying to diagnose a problem using the wait event interface, feel free to email us wait events data and a problem description. § We’ll do our best to look over what you send us and share our thoughts with you. 3/17/2018 118

The White Paper A companion white paper to this presentation is available for free download from our company’s website at: www. dbspecialists. com/presentations. html 3/17/2018 119

Resources from Database Specialists § The Specialist newsletter – www. dbspecialists. com/specialist. html § Database Rx® – dbrx. dbspecialists. com/guest • Provides secure, automated monitoring, alert notification, and analysis of your Oracle databases 3/17/2018 120
In Conclusion § The wait event interface gives you access to a detailed accounting of how Oracle processes spend their time. § Wait events touch all aspects of the Oracle database server. § The wait event interface will not always give you the answer to every performance problem, but it will just about always give you insights that guide you down the proper path to problem resolution. 3/17/2018 121

Contact Information Roger Schrag rschrag@dbspecialists. com Terry Sutton tsutton@dbspecialists. com 3/17/2018 Database Specialists, Inc. 388 Market Street, Suite 400 San Francisco, CA 94111 Tel: 415/344 -0500 Web: www. dbspecialists. com 122
ee9e5167a30dff400acffce138d852b8.ppt