f90613888a66cb5256c2b366bc246505.ppt
- Количество слайдов: 16
 Monitoring and Fault Tolerance Helge Meinhard / CERN-IT Open. Lab workshop 08 July 2003
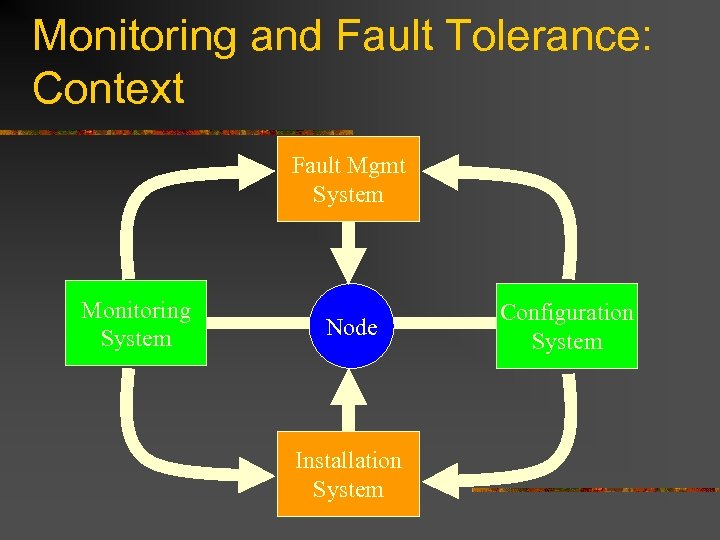 Monitoring and Fault Tolerance: Context Fault Mgmt System Monitoring System Node Installation System Configuration System
 History (1) n n In the 1990 s, “massive” deployments of Unix boxes required automated monitoring of system state Answer: SURE n n n Pure exception/alarm system No archiving of values, hence not useful for performance monitoring Not scalable to O(1000) nodes
 History (2) n n n PEM project at CERN (1999/2000) took fresh look at fabric mgmt, in particular monitoring PEM tool survey: Commercial tools found not flexible enough and too expensive; free solutions not appropriate Architecture, design and implementation from scratch
 History (3) n 2001 - 2003: European Data. Grid project with work package on Fabric Management n n Subtasks: configuration, installation, monitoring, fault tolerance, resource management, gridification Profited from PEM work, developed ideas further
 History (4) n n n In 2001, some doubts about ‘do-it-allourselves’ approach of EDG WP 4 Parallel to EDG WP 4, project launched to investigate whether commercial SCADA system could be used Architecture deliberately kept similar to WP 4
 Monitoring and FT architecture (1) n n Monitoring: Captures non-intrusively actual state of a system (supposed not to change its state) Fault Tolerance: Reads and correlates data from monitoring system, triggers corrective actions (state-changing)
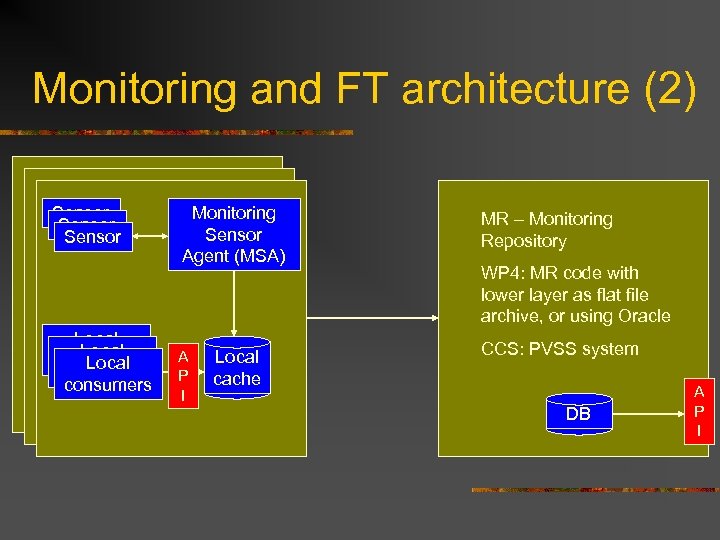 Monitoring and FT architecture (2) Sensor Local consumers Monitoring Sensor Agent (MSA) A P I Local cache MR – Monitoring Repository WP 4: MR code with lower layer as flat file archive, or using Oracle CCS: PVSS system DB A P I
 Monitoring and FT architecture (3) n n n MSA controls communication with Monitoring Repository, configures sensors, requests samples, listens to sensors Sensors send metrics on request or spontaneously to MSA Communication MSA – MR: UDP or TCP based
 Monitoring and FT architecture (4) n n n FT system subscribing to metrics from monitoring subsystem Rule-based correlation engine takes decisions on firing actuators Actuators controlled by Actuator Agent, all actions logged by monitoring system
 Deployment (1) n n End 2001: Put early versions of MSA and sensors on big clusters (~800 Linux machines), sending data (~100 metrics per machine, 1/min… 1/day) to a PVSSbased repository At the same time, ~300 machines started sending performance metrics into flat file WP 4 repository
 Deployment (2) n n Sensors more refined over time (metrics added according to operational needs) Both exception and performance oriented sensors now deployed in parallel (some 150 metrics per node) More special machines added, currently ~1500 machines being monitored Test in May 2003: some 500 metric changes per second into the repository (~150 changes/s after “smoothing”)
 Deployment (3) n Repository requirements: n n n Repository API implementation Oracle based fully functional alarm display for operators Currently using both an Oracle-MR based repository, and a PVSS based one Operators using PVSS based alarm screen as alternative to Sure display
 Deployment (4) n n n Interfaces: C API available, simple command line interface by end July, prototype Web access to time series of a metric available Fault tolerance: Just starting to look at WP 4 prototype Configuration of monitoring: ad-hoc, to be migrated to CDB
 Outlook n Near term: Production services for LCG-1 n n Add more machines (e. g. network), metrics Software and service monitoring Medium term (end 2003): Monitoring for Solaris and Windows, … 2004 or 2005: Review of chosen solution for monitoring and FT n n Some of 1999 arguments no longer valid Will look at commercial and freeware solutions
 Machine control n n High level: interplay of State Management System, Configuration Management, Monitoring, Fault Tolerance, … Low level: n n Past: CPU boxes didn’t have anything (5 rolling tables with monitors and keyboards per 500… 1000 machines), disk and tape servers with analog KVM switches Future: Have investigated various options, benefit/cost analysis. Will go to serial consoles on all machines, 1 head node per 50… 100 machines with serial multiplexers


