2e4284a719de99d24b851b091845a340.ppt
- Количество слайдов: 38


 Han Yang, Tianbai Wang, Honglu Liu, and Rui (Cindy) Deng April 12,")
Molycorp (MCP) Han Yang, Tianbai Wang, Honglu Liu, and Rui (Cindy) Deng April 12, 2012

Intro - What is rare earth? Rare earth elements consisted 17 chemical elements – fifteen lanthanides, plus scandium and yttrium Source: http: //ilookchina. net/tag/rare-earth-minerals/

Intro - What is rare earth Rare earths are moderately abundant in the earth’s crust, some even more abundant than copper, lead, and gold REEs are not concentrated enough to make them easily exploitable economically

Uses and applications Rare earths are critical inputs in many existing and emerging applications including: • Clean energy technologies Ø hybrid and electric vehicles and wind power turbines • High-tech uses Ø fiber optics, lasers and hard disk drives • Defense applications Ø guidance and control systems and global positioning systems • Advanced water treatment technology Ø industrial, military and outdoor recreation applications

Supply & Production China owns more than 50% of the rare earth reserves in the world and produce about 97% of rare earth in 2010. The total production in china is approximately 130, 000 tons in 2010 The US does not produce rare earth and 93% of rare earth is imported from China
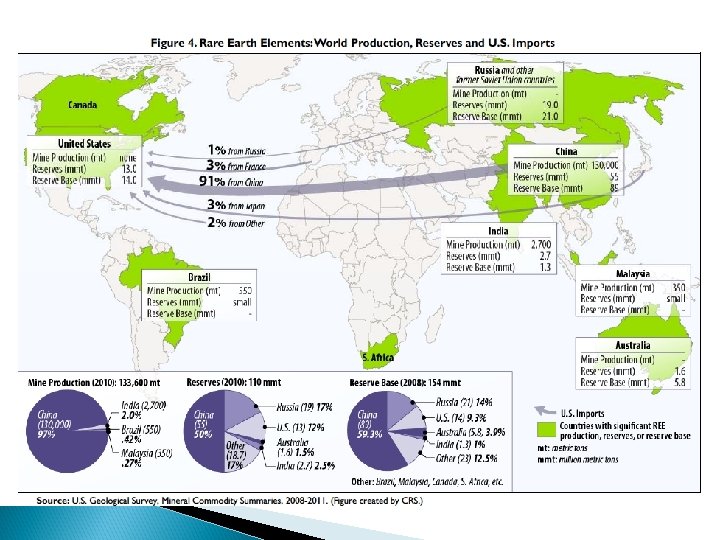

Export control in China has tightened its exported by reducing the export quota for both economic and environmental reasons The export quota has reduced from 60, 000 tons/ year in 2007 to 30, 000 tons/year in 2011 The export quota is expected to remain at current level Regulation increased to reduce the illegal exporting

China’s Role in Rare Earth Supply Source: Economists

Rare earth demand World demand for rare earth elements is estimated at 136, 000 tons per year World demand is projected to rise to 185, 000 tons annually by 2015 China’s output by 2015 is estimated between 130, 000 -140, 000 tons and China’s demand would rise to 111, 000 tons. Non-China annual output would need to be between 45, 000 to 70, 000 tons to meet global demand. There is potential shortfall.
 producer in the")
Company Overview Molycorp, Inc. is the only rare earth oxide (REO) producer in the Western hemisphere. It owns and operates the world’s largest, most fully developed rare earth mine and oxide manufacturing facility outside of China, located in Mountain Pass, California. It has been producing rare earth products for more than 59 years.
 is projected to steadily increase")
Company Overview Global demand for rare earth elements (REEs) is projected to steadily increase due to ØContinuing growth in existing applications ØIncreased innovation and development of new end uses

Company Overview • Ownership Holder Name RESOURCE CAPITAL FUNDS MOLIBDENOS Y METALES S A MORGAN STANLEY INVEST MGMT PEGASUS PARTNERS IV LP Total Amount held 13, 843, 863 12, 500, 000 8, 647, 566 7, 970, 073 42, 961, 502 % Outstanding 16. 5 14. 9 10. 3 9. 5 51. 2 Source: Bloomberg

Company Overview • Three operating facilities Molycorp Mountain Pass • in Mountain Pass, California Molycorp Tolleson Molycorp Sillamae • in Tolleson, Arizona • in Sillamae, Estonia

Company Overview Data Source: MCP Website
 Ø Modernizing and expanding the rare")
Company Overview • Project Phoenix (two expansion phases) Ø Modernizing and expanding the rare earth mine, mill, and rare earth oxide manufacturing facility at Mountain Pass Phase 1 • To produce at an annual rate of 19, 050 metric tons of rare earth oxides by the end of the third quarter of 2012. Phase 2 • To give an annual production capacity of 40, 000 metric tons of rare earth oxides per year by the end of 2012.

Company Overview Data Source: MCP Website

“Mine-to-Magnets” Strategy Vertical integration strategy Ensure MCP can produce high quality rare earth materials in all five stages of the rare earth value chain Data Source: MCP Website

“Mine-to-Magnets” Strategy Stage 1 Mining Stage 4 Alloy Manufacture • Molycorp Mountain Pass • Molycorp Tolleson Stage 2 Material Processing Stage 5 Magnet Manufacture • Molycorp Mountain Pass • Molycorp Sillamae Stage 3 Metal Making • Molycorp Sillamae • Molycorp Tolleson • Molycorp in joint venture with Daido Steel and Mitsubishi Corp. to manufacture Nd. Fe. B magnets

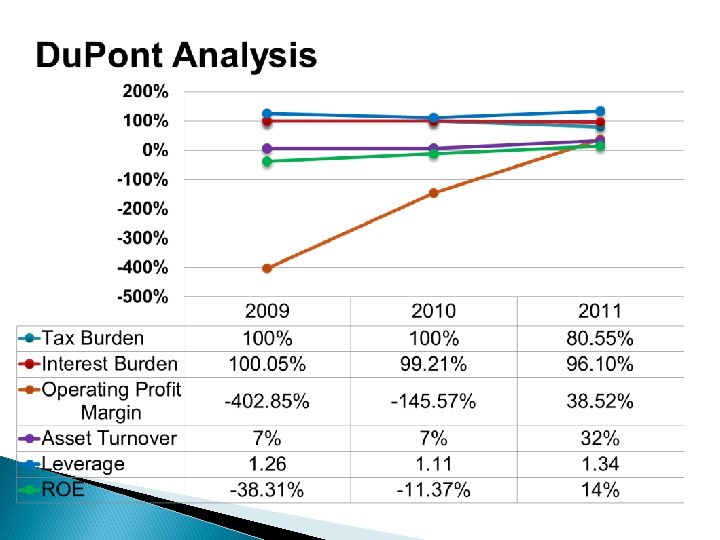
Financial Analysis 2009 2010 2011 ROA% -29. 27% -10. 59% 9. 43% ROE% -38. 31% -11. 37% 14. 00% Gross Margin% -207. 13% -6. 92% 55. 17% SG&A Margin% 178. 84% 135. 15% 16. 23% EBIT Margin% -402. 85% -145. 57% 38. 52% NI Margin% -403. 03% -144. 42% 29. 82% Profitability Margin Analysis

Financial Analysis 2009 Asset Turnover Total Asset Turnover Inventory Turnover A/R Turnover Liquidity Total Debt/Total Equity Cash Ratio Quick Ratio Current Ratio 2010 2011 0. 07 0. 32 0. 83 5. 81 1. 87 2. 14 3. 54 5. 61 0. 00% 0. 73 0. 86 1. 94 0. 64% 15. 28 16. 07 17. 06 0. 07% 2. 34 2. 74 3. 58

Financial Analysis Current P/E Ratio: 25. 00 Graham : g = 8. 25 Green. Blatt : EBIT/Tangible Assets = 25. 94% EBIT/EV PEG Ratio : 0. 79 = 6. 02%

Valuation: Methods Valuation P/E Multiple DCF Model

P/E Multiple: Comparable Companies Same Business Similar Business RIO US Domestic Molycorp BHP MLM International LYC AVL ARU
")
P/E Multiple: Comparable Companies International + Same Business Lynas Corporation Ltd. (Yahoo: LYC. AX) Avalon Rare Metal Inc. (Yahoo: AVL. TO) Arafura Resources Ltd. (Yahoo: ARU. AX)

P/E Multiple: Equivalent P/E Example: Lynas is an Australian Company. Based on 1 S&P 500: 16. 3 Equivalent P/E = Original P/E x US Market P/E AUS Market P/E Data Source: 1 Market Data Center, Wall Street Journal 2 Share Market Report, Reserve Bank of Australia Based on 2 S&P/AUX 200: 13. 4
")
P/E Multiple: Comparable Companies International + Same Business Lynas Coporation Ltd. (Yahoo: LYC. AX) Negative Avalon Rare Metal Inc. (Yahoo: AVL. TO) EPS Arafura Resources Ltd. (Yahoo: ARU. AX)
 BHP Billiton Ltd.")
P/E Multiple: Comparable Companies US Domestic + Similar Business P/E (ttm) BHP Billiton Ltd. (NYSE: BHP) 12. 54 Rio Tinto plc (NYSE: RIO) 17. 62 Martin Marietta Materials Inc. (NYSE: MLM) 48. 99 Average 26. 4 Molycorp EPS $ 1. 27 Valuation: Price Per Share Current Market Price (Apr 11, 2012) Data Source: Yahoo! Finance $ 33. 5 $ 31. 68

DCF Model: Framework Price Per Share Mkt. $ 30 DCF Model $ 31. 68 Discount Rate = 15. 6% 11. 6% WACC + 400 bp = 15. 6% Financial Projection $ 79. 16 X ROE $ 31. 68 Data Source: Yahoo! Finance $ 23. 15 52 week range
")
DCF Model: CAPEX Projection Historical and Projected CAPEX, 2008 -2022 (Dollar Amount in Millions) 800 Internal Financing 600 By the end of FY 2011: Cash & Cash Equiv. = $ 419 mil. Additional $ 213 mil. Needed. 400 20 08 20 09 20 10 20 11 20 12 20 13 20 14 20 15 20 16 20 17 20 18 20 19 20 20 20 21 20 22 0 Data Source: Annual Reports and Students Analysis
")
DCF Model: Revenue Projection Historical and Projected Revenue, 2008 -2022 (Dollar Amount in Millions) 2, 000 1, 500 1, 000 500 20 08 20 09 20 10 20 11 20 12 20 13 20 14 20 15 20 16 20 17 20 18 20 19 20 20 20 21 20 22 0 Data Source: Annual Reports and Students Analysis

Disclosure Han personally owns 110 shares of MCP. And he will not change the position in next 12 months.

DCF Model: Sensitivity Analysis Revenue = P X Q Production 2011 : 5, 000 mt (Real) By 2012 Q 3: 20, 000 mt (Capacity) By 2012 Year-End: 40, 000 mt (Capacity)

DCF Model: Sensitivity Analysis WACC & DCF Stock Price 60 Stock Price 50 40 30 20 10 0 11% 12% 13% 14% 15% 16% 17% 18% 19% 20% WACC

DCF Model: Sensitivity Analysis 1 st Yr Growth Rate & DCF Stock Price 35 30 25 20 25% 30% 35% 40% 45% 50% 55% 60% 65% 1 st Yr Growth Rate

DCF Model: Sensitivity Analysis 2 nd Yr Growth Rate & DCF Stock Price 40 35 30 25 20 70% 80% 90% 100%110%120%130%140%150% 2 nd Yr Growth Rate

DCF Model: Sensitivity Analysis Terminal g & DCF Stock Price 35 30 25 20 0% 1% 2% 3% Terminal Growth Rate 4%

Recommendation Buy 200 Shares At Market Price Cost = 200 x 30 = $ 6, 000 2% of Our Portfolio
2e4284a719de99d24b851b091845a340.ppt