

c92b73ed4ef844f125c8f28f64d78454.ppt
- Количество слайдов: 44
 MODULE - 14 MATHEMATICAL MODELLING
 Investigate the average rate of change of a function between two values of the independent variable, demonstrating an intuitive understanding of average rate of change over different intervals n (e. g. investigate water consumption by calculating the average rate of change over different time intervals and compare results with the graph of the relationship. ) (LO 2 AS 3, 7) n
 n n n Use mathematical models to investigate problems that arise in real-life contexts: making conjectures, demonstrating and explaining their validity; expressing and justifying mathematical generalizations of situations; using the various representations to interpolate and extrapolate; describing a situation by interpreting graphs, or drawing graphs from a description of a situation, with special focus on trends and features. (Examples should include issues related to health, social, economic, cultural, political and environmental matters) (LO 2 AS 6)
 n n n In this discussion, we will") DISCUSSION 1 (Gradient and Average Gradient) n n n In this discussion, we will focus on real world applications of gradient and average gradient. After you have read through theory and examples in this discussion, complete the task which follows. The task will focus on the following assessment standards: gradient and average gradient; describing a situation by interpreting graphs; drawing graphs from a description of a situation
DISCUSSION 1 (Gradient and Average Gradient) n n n In this discussion, we will focus on real world applications of gradient and average gradient. After you have read through theory and examples in this discussion, complete the task which follows. The task will focus on the following assessment standards: gradient and average gradient; describing a situation by interpreting graphs; drawing graphs from a description of a situation
 Gradient n n n As previously discussed in Analytical Geometry and Functions, gradient is defined as the rate of change of one variable in relation to another. In terms of the Cartesian Number Plane, it is considered to be the following ratio: change in y - values change in x — values A formula to calculate the gradient of a line between any two points A and B is given by the formula: We now focus on a real world example of where gradient is used.
 Example 1 n n n Speed is defined to be the rate of change of distance with respect to time. A formula for speed is given by: Speed =The variable distance changes with respect to the variable time, creating a rate of change referred to as speed. The graph which follows represents the distance traveled by a car from its starting point 0. The vertical axis represents the distance of the car away from the starting point in kilometers. The horizontal axis represents the time elapsed in hours.
 Using the graph, answer the questions which follow:
 Calculate the gradient of line segment OA O(0; 0) and A(5 ; 500)") (a) Calculate the gradient of line segment OA O(0; 0) and A(5 ; 500) gradient OA = (b) What is the speed of the car between O and A? The speed is the rate of change of distance with respect to time, i. e. the number of kilometers traveled in one hour. n It is clear from (a) that the car traveled at a constant speed of l 00 km/h between O and A. n In other words, the gradient of line AB gives the speed (in km/h) traveled by the car between 0 and A.
(a) Calculate the gradient of line segment OA O(0; 0) and A(5 ; 500) gradient OA = (b) What is the speed of the car between O and A? The speed is the rate of change of distance with respect to time, i. e. the number of kilometers traveled in one hour. n It is clear from (a) that the car traveled at a constant speed of l 00 km/h between O and A. n In other words, the gradient of line AB gives the speed (in km/h) traveled by the car between 0 and A.
 Calculate the speed of the car between A and B. Speed = gradient") (c) Calculate the speed of the car between A and B. Speed = gradient of line AB = Clearly, the car is not moving for 5 hours because the speed is zero between C and D.
(c) Calculate the speed of the car between A and B. Speed = gradient of line AB = Clearly, the car is not moving for 5 hours because the speed is zero between C and D.
 Calculate the speed of the car between B and C. Speed") n n (d) Calculate the speed of the car between B and C. Speed = gradient of line BC = Notice that the car is traveling at a constant speed of l 00 km/h between O and C. The car is also 1500 kilometers away from its starting point O. n (e) Calculate the speed of the car between C and D. What can you conclude? Speed = gradient of line CD =
n n (d) Calculate the speed of the car between B and C. Speed = gradient of line BC = Notice that the car is traveling at a constant speed of l 00 km/h between O and C. The car is also 1500 kilometers away from its starting point O. n (e) Calculate the speed of the car between C and D. What can you conclude? Speed = gradient of line CD =
 Calculate the speed of the car between D and E. What") n n (f) Calculate the speed of the car between D and E. What can you conclude? Speed = gradient of line DE = The car is now traveling at a faster speed than between O and C. (g) Calculate the speed of the car between E and F. What can you conclude? Speed = gradient of line EF = The car is now traveling at a speed of l 00 km/h in the opposite direction. This is indicated by the negative sign.
n n (f) Calculate the speed of the car between D and E. What can you conclude? Speed = gradient of line DE = The car is now traveling at a faster speed than between O and C. (g) Calculate the speed of the car between E and F. What can you conclude? Speed = gradient of line EF = The car is now traveling at a speed of l 00 km/h in the opposite direction. This is indicated by the negative sign.
 Average Gradient Example 2 n Consider the graph alongside which represents the movement of a car from O to D. n
 n n n n n The speed of the car from O to A is The speed of the car from A to B is The speed of the car from B to C is The speed of the car from C to D is So clearly the car's speed changes throughout the journey from O to D. We can now calculate the average speed of the car between O and D as follows: Draw a line from O to D and then calculate the gradient of this line. The gradient of line OD will represent the average speed of the car between O and D. This will be done on the diagram which follows:
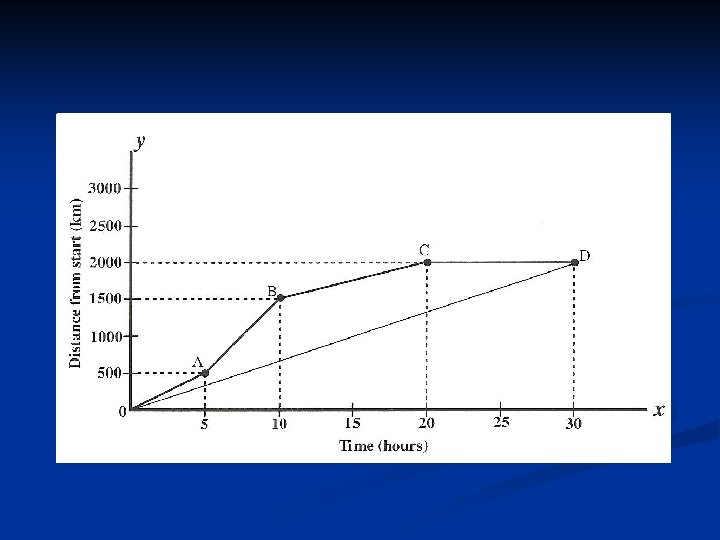
 Calculate the average speed of the car between 0 and") n n n (a) Calculate the average speed of the car between 0 and D. Average speed between 0 and D = gradient of line OD = (b) Calculate the average speed of the car between A and C. Draw line AC on the diagram above. Average speed between A and C = gradient of line AC = From this example, we can state the following: The average gradient of a function between any two points is defined to be the gradient of the line joining the two points.
n n n (a) Calculate the average speed of the car between 0 and D. Average speed between 0 and D = gradient of line OD = (b) Calculate the average speed of the car between A and C. Draw line AC on the diagram above. Average speed between A and C = gradient of line AC = From this example, we can state the following: The average gradient of a function between any two points is defined to be the gradient of the line joining the two points.
 TASK 1 Complete this task in the spaces provided n 1. The distance-time graph below represents Jake's journey from home to school.
 Determine the gradient of line AB. (b) How fast") n n n n (a) Determine the gradient of line AB. (b) How fast was Jake traveling during the first 10 minutes? (c) Describe what was happening between 08: 10 and 08: 20. (d) How far was Jake from home at 08: 18 ? (e) Estimate how far Jake was from home at 08: 30 ? (f) Estimate the time taken for Jake to reach 1400 meters from home. (g) How fast was Jake traveling during the last 20 minutes? (h) Calculate Jake's average speed from home to school.
n n n n (a) Determine the gradient of line AB. (b) How fast was Jake traveling during the first 10 minutes? (c) Describe what was happening between 08: 10 and 08: 20. (d) How far was Jake from home at 08: 18 ? (e) Estimate how far Jake was from home at 08: 30 ? (f) Estimate the time taken for Jake to reach 1400 meters from home. (g) How fast was Jake traveling during the last 20 minutes? (h) Calculate Jake's average speed from home to school.
 n n The municipality of Mathsdorp recorded the water consumption of the town at the end of each month (starting at the end of January to the end of June). The results were then represented their graphically
 (b) (c) (d) n (e) n (f) n (g) n (h) n") n (a) (b) (c) (d) n (e) n (f) n (g) n (h) n (i) n (J) n (k) n n n What was the water consumption at the end of January? What was the water consumption at the end of February? What was the water consumption at the end of March? At the end of which month was the water consumption the highest ? At the end of which month was the water consumption the lowest? Determine the rate of consumption from January to February. Describe the situation in words. Determine the rate of consumption from February to March. Describe the situation in words. Determine the rate of consumption from March to April. Describe the situation in words. Determine the rate of consumption from April to May. Describe the situation in words. Determine the rate of consumption from May to June. Describe the situation in words. Determine the average rate of consumption from the end of January to the end of April.
n (a) (b) (c) (d) n (e) n (f) n (g) n (h) n (i) n (J) n (k) n n n What was the water consumption at the end of January? What was the water consumption at the end of February? What was the water consumption at the end of March? At the end of which month was the water consumption the highest ? At the end of which month was the water consumption the lowest? Determine the rate of consumption from January to February. Describe the situation in words. Determine the rate of consumption from February to March. Describe the situation in words. Determine the rate of consumption from March to April. Describe the situation in words. Determine the rate of consumption from April to May. Describe the situation in words. Determine the rate of consumption from May to June. Describe the situation in words. Determine the average rate of consumption from the end of January to the end of April.
 n n n n Nathan and Francis are training for a triathlon. They both start at 08: 00 (at the same point). The triathlon involves swimming, cycling and then running. The training programme involves swimming for 1 km in a river and then resting for a while. After this, they are required to cycle in the same direction for 9 km on a road next to the river. They are then allowed to rest for a while. The final part of the programme involves running on the same road in the opposite direction for 10 km in order to get back to their starting point. The table below shows the times each took for the training session.
 Activity Swimming Nathan's time in minutes 25 Francis’s time in minutes 15 Rest 5 10 Cycling 15 20 Rest 10 5 Running 35 45
 Draw graphs illustrating each person's distance from the starting point with respect to") (a) Draw graphs illustrating each person's distance from the starting point with respect to time. (b) Calculate Nathan's speed for each activity. (c) Calculate Francis's speed for each activity. (d) At what times were Jonathan and Qiniso together (tied)? (e) Who was the winner? (f) Show that Nathan and Francis had the same average speed during the first 45 minutes
(a) Draw graphs illustrating each person's distance from the starting point with respect to time. (b) Calculate Nathan's speed for each activity. (c) Calculate Francis's speed for each activity. (d) At what times were Jonathan and Qiniso together (tied)? (e) Who was the winner? (f) Show that Nathan and Francis had the same average speed during the first 45 minutes
 n n In this discussion, we focus on the") DISCUSSION 2 (Interpolation and Extrapolation) n n In this discussion, we focus on the assessment standards which deal with the concepts of interpolation and extrapolation. Interpolation: Finding a value from a graph that lies inside the range of values used to construct the graph is called interpolation. Extrapolation: Finding a value from a graph that lies outside the range of values used to construct the graph is called extrapolation. The next task will serve to illustrate the difference between these two concepts.
DISCUSSION 2 (Interpolation and Extrapolation) n n In this discussion, we focus on the assessment standards which deal with the concepts of interpolation and extrapolation. Interpolation: Finding a value from a graph that lies inside the range of values used to construct the graph is called interpolation. Extrapolation: Finding a value from a graph that lies outside the range of values used to construct the graph is called extrapolation. The next task will serve to illustrate the difference between these two concepts.
 n n A hospital recorded") TASK 2 (Complete this task in the spaces provided) n n A hospital recorded the number of HIV infections reported at the end of 1996 and thereafter at the end of each two year period (from 1998 to 2006). The information obtained is represented graphically as follows:
TASK 2 (Complete this task in the spaces provided) n n A hospital recorded the number of HIV infections reported at the end of 1996 and thereafter at the end of each two year period (from 1998 to 2006). The information obtained is represented graphically as follows:
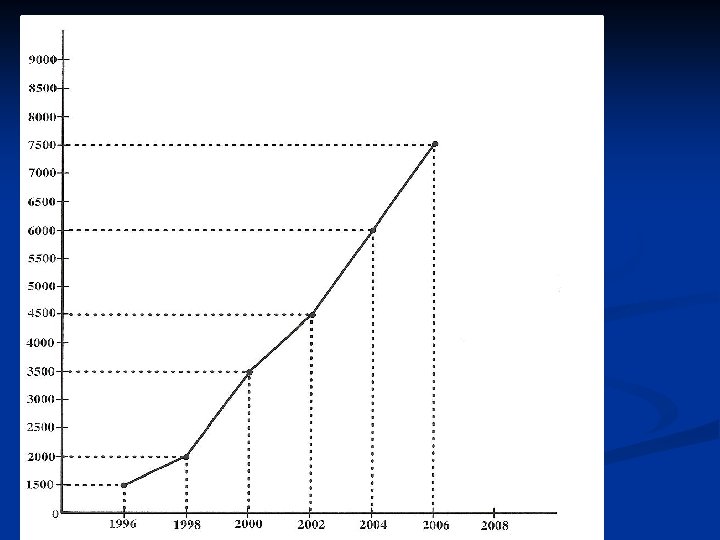
 Estimate graphically the number of infections at the end of") n n n (a) Estimate graphically the number of infections at the end of 2001: Because you have read off the number of infections based on information provided inside known values (from 1996 to 2006), you have estimated based on the method called ___________ (b) On the above diagram, extend the curve from 2006 to 2008 using the general trend of the graph. (c) Now estimate the number of HIV infections at the end of 2008: Because you have read off the number of infections based on information outside known values (after 2006), you have estimated based on the method called____________
n n n (a) Estimate graphically the number of infections at the end of 2001: Because you have read off the number of infections based on information provided inside known values (from 1996 to 2006), you have estimated based on the method called ___________ (b) On the above diagram, extend the curve from 2006 to 2008 using the general trend of the graph. (c) Now estimate the number of HIV infections at the end of 2008: Because you have read off the number of infections based on information outside known values (after 2006), you have estimated based on the method called____________
 DISCUSSION 3 Mathematical generalizations linked to graphs n n It is sometimes useful to determine the equations of the lines representing trends and features in real world situations. By doing this we are expressing and justifying mathematical generalizations of situations, which is one of the assessment standards. TASK 3 The graph below represents the rental cost of a car from two different car rental companies: Super Car Rentals and Quality Car Rentals.
 Determine the initial rental cost from each company. (b)") n n n n (a) Determine the initial rental cost from each company. (b) Determine graphically the number of kilometers at which the cost is the same for both companies. (c) If you had to travel 250 km, which company would be a better option and why? (d) If you had to travel 750 km, which company would be a better option and why? (e) Determine the equations of the lines which represent (the total rental cost from each company. (f) Verify that the equations do in fact determine the rental cost for each company by considering the cost for 100 km. (g) Now use these equations to calculate the cost of traveling 1000 km.
n n n n (a) Determine the initial rental cost from each company. (b) Determine graphically the number of kilometers at which the cost is the same for both companies. (c) If you had to travel 250 km, which company would be a better option and why? (d) If you had to travel 750 km, which company would be a better option and why? (e) Determine the equations of the lines which represent (the total rental cost from each company. (f) Verify that the equations do in fact determine the rental cost for each company by considering the cost for 100 km. (g) Now use these equations to calculate the cost of traveling 1000 km.
 n n n It is") DISCUSSION 4 (Scatter plots and lines of best fit) n n n It is often the case that information about a situation does not graphically form a perfect line or curve. In order to predict trends in these situations, it is useful to determine a line of best fit. The assessment standard in this discussion, and the task which follows, deals with the focus on special trends. Example Consider the following information obtained by a company which recorded the number of products sold per week.
DISCUSSION 4 (Scatter plots and lines of best fit) n n n It is often the case that information about a situation does not graphically form a perfect line or curve. In order to predict trends in these situations, it is useful to determine a line of best fit. The assessment standard in this discussion, and the task which follows, deals with the focus on special trends. Example Consider the following information obtained by a company which recorded the number of products sold per week.
 n n n It is clear from the above graph that the points do not lie on a perfect straight line. The information on the graph does seem to follow a linear trend. We can draw what is called a line of best fit which will help to predict future values. In order to do this, draw a line through some of the points with the aim of having the same number of points above the line as below the line. You can then determine the equation of this line of best fit in order to predict future trends (the number of potential products that could be sold). The line of best fit will now be drawn onto the graph. Refer to the diagram.
 n n n n A line can be drawn through four of the points with four above and four below. One of the points (see diagram) is way out compared to the others. This point is called an outlier. A line of best fit will not represent the data perfectly, but it will give you an idea of the trend. Different people will probably draw slightly different lines of best fit, but the trend should be the more or less the same in each case. The equation of this line of best fit can be obtained as follows: Select two points on this line, calculate the gradient and hence the equation. We can choose the points (2; 20) and (6; 60) Gradient = y-intercept of line is 0. '. The equation of the line of best fit is given by: y = 10 x where x represents the number of weeks and y the number of products sold per week You can now predict the number of products sold in 16 weeks by using the equation of the line of best fit: For x = 16 y = 10(16) = 160 products
 n n n TASK 4 A company records the number of products sold per week. (a) Draw a line of best fit on the diagram above. (b) Determine the equation of your line of best fit. (c) Predict how many products will be sold after 40 weeks.
 DISCUSSION 5 Mathematical modeling linked to algebra n In this discussion, we focus on solving typical word problems requiring the use of linear, quadratic and simultaneous equations. n Example 1 (Linear equations) n A curtain manufacturing company sold a client 12 meters of material. The cost of the material was R 8 per meter. Some of the material was not up to standard and was sold for R 7 per meter. The total cost of the material was R 92. How many meters of material was not up to standard? Let the length of the not so good material be equal to x. n n n
 Meters Not so good material Good material Cost X Price per meter 7 12 -x 8 8(12 -x) X 7 x + 8(12 - x) = 92 7 x + 96 - 8 x = 92 - x =-4 x=4 The length of not so good material is 4 meters.
 n The perimeter of a rectangular floor is 6 meters.") Example 2 (Simultaneous equations) n The perimeter of a rectangular floor is 6 meters. The length of the floor must be twice the length of its breadth. Determine the dimensions of the floor.
Example 2 (Simultaneous equations) n The perimeter of a rectangular floor is 6 meters. The length of the floor must be twice the length of its breadth. Determine the dimensions of the floor.
 x =") n n n n 2 x + 2 y = 6 perimeter) x = 2 y (equation involving the (equation relating length to breadth) Solve simultaneously: 2 x + 2 y = 6. . . . A x - 2 y = 0. . . . . B A+ B: 3 x = 6 x=2 2 – 2 y = 0 -2 y = -2 y=l Therefore the length must be 2 meters and the breadth must be 1 meter.
n n n n 2 x + 2 y = 6 perimeter) x = 2 y (equation involving the (equation relating length to breadth) Solve simultaneously: 2 x + 2 y = 6. . . . A x - 2 y = 0. . . . . B A+ B: 3 x = 6 x=2 2 – 2 y = 0 -2 y = -2 y=l Therefore the length must be 2 meters and the breadth must be 1 meter.
 n n n A rectangle has an area of 8") Example 3 (Quadratic equations) n n n A rectangle has an area of 8 meters. Its breadth is 2 meters less than its length. Find the dimensions of the rectangle.
Example 3 (Quadratic equations) n n n A rectangle has an area of 8 meters. Its breadth is 2 meters less than its length. Find the dimensions of the rectangle.
 = 8 (equation relating to area) n x 2 - 2") x(x - 2) = 8 (equation relating to area) n x 2 - 2 x = 8 n x 2 - 2 x – 8 = 0 n (x - 4)(x + 2) = 0 n x = 4 or x = - 2 n Since x - 2 because length cannot be negative, the solution is x = 4 n Therefore the length is 4 meters and the breadth is 2 meters. n
x(x - 2) = 8 (equation relating to area) n x 2 - 2 x = 8 n x 2 - 2 x – 8 = 0 n (x - 4)(x + 2) = 0 n x = 4 or x = - 2 n Since x - 2 because length cannot be negative, the solution is x = 4 n Therefore the length is 4 meters and the breadth is 2 meters. n
 Complete this assignment on a separate") TASK 5 n n n n n (ASSIGNMENT) Complete this assignment on a separate piece of paper and hand it in for marks. 1. There were 600 spectators at a tennis match. Of these 144 were children and there were twice as many men as women. Determine how many women were there. 2. Tickets to the DJ Kwa concert cost R 200 and R 300. A total of 250 tickets were sold. The total amount taken for the show was R 55 000. Determine how many of each ticket were sold. 3. The length of a rectangular field is 3 meters more than its breadth. The area of the field is 70 m. Calculate the length of the field.
TASK 5 n n n n n (ASSIGNMENT) Complete this assignment on a separate piece of paper and hand it in for marks. 1. There were 600 spectators at a tennis match. Of these 144 were children and there were twice as many men as women. Determine how many women were there. 2. Tickets to the DJ Kwa concert cost R 200 and R 300. A total of 250 tickets were sold. The total amount taken for the show was R 55 000. Determine how many of each ticket were sold. 3. The length of a rectangular field is 3 meters more than its breadth. The area of the field is 70 m. Calculate the length of the field.
 n n 4. The area of a room in a house has the following measurements as indicated on the diagram alongside. If the total area of the room is 43 m Calculate the value of x.
 5. A stadium is in the form of a rectangle with the length 2 meters longer than the breadth. n A new rectangular stadium is planned that will be 2 meters longer than the original length and with a breadth 1 meter shorter than that of the original breadth. n (a) Determine the difference in perimeter of the two stadiums. n (b) If both stadiums are to have the same area, determine the dimensions of the original stadium. n
 DISCUSSION 6 Conjectures relating to real world situations n The task which follows focuses on the assessment standard dealing with making conjectures, demonstrating and explaining their validity.
 Complete this investigation on a separate piece of") TASK 6 n n n (INVESTIGATION) Complete this investigation on a separate piece of paper and hand it in for marks. A tiling company has been tasked to tile the floor of a new shopping mall using the following materials and creating the design which follows. Square marble slabs Heavy duty rods on the outer edges Light rods to cover the gaps between the rods Decorative pebbles placed at each inner vertex.
TASK 6 n n n (INVESTIGATION) Complete this investigation on a separate piece of paper and hand it in for marks. A tiling company has been tasked to tile the floor of a new shopping mall using the following materials and creating the design which follows. Square marble slabs Heavy duty rods on the outer edges Light rods to cover the gaps between the rods Decorative pebbles placed at each inner vertex.
 Draw a picture of a 2 - by - 2 design") n n a) Draw a picture of a 2 - by - 2 design and then write down the number of pebbles, slabs, heavy rods and light rods. (b) Do the same with a 4 - by - 4 design. (c) Work out mathematical conjectures (rules) to help the company find the number of pebbles, slabs, heavy rods and light rods in any n - by - n design without having to draw the design. Make use of variables and formulate mathematical expressions. (d) Use your findings to write down the number of pebbles, slabs, heavy rods and light rods in a 100 – by – l 00 design.
n n a) Draw a picture of a 2 - by - 2 design and then write down the number of pebbles, slabs, heavy rods and light rods. (b) Do the same with a 4 - by - 4 design. (c) Work out mathematical conjectures (rules) to help the company find the number of pebbles, slabs, heavy rods and light rods in any n - by - n design without having to draw the design. Make use of variables and formulate mathematical expressions. (d) Use your findings to write down the number of pebbles, slabs, heavy rods and light rods in a 100 – by – l 00 design.