23994b68c3e079e38cc8555855743464.ppt
- Количество слайдов: 77
Module 11: Troubleshooting a Network Load Balancing Cluster
Overview n Using Status Tools and Utilities n Troubleshooting Problems n Using Network Tools and Utilities
n When troubleshooting a Network Load Balancing cluster you will find that configuration errors, automated responses to failures, and changes to the network infrastructure can change the status of a cluster. For example, if a single host within a cluster fails to come online, the cluster will not converge. To troubleshoot a Network Load Balancing cluster, you can use the various tools that are available to analyze the problem without visiting the management console on the failed cluster member. n Error handling in the Network Load Balancing cluster is designed to minimize the possibility of disrupting the cluster’s service to client requests, while allowing a cluster’s parameters and member hosts to dynamically change as required. For example, you can add hosts to the cluster, remove them for maintenance, add port rules, and modify rule parameters, all without interrupting Cluster service.
n The cluster administrator must decide how to monitor changes in the cluster status and how to investigate failures in both the configuration and operation of the cluster. n After completing this module, you will be able to: l Describe the status tools that are available to monitor and analyze a Network Load Balancing cluster. l Identify troubleshooting issues that occur within the Network Load Balancing cluster. l Describe the networking tools that are used to detect and troubleshoot network problems.
u Using Status Tools and Utilities n The Performance Tool n Network Monitor n Event Viewer
n While the operation of a Network Load Balancing cluster is automatic after you have properly configured it, you can be required to investigate failures and set performance baselines when troubleshooting. You use these baselines to test against, and interactively monitor, current cluster performance. n You can use various tools and utilities in Microsoft® Windows® 2000 to provide status information on the operation of a Network Load Balancing cluster. The status tools and utilities provide information on the cluster operation, individual hosts within the cluster, and network conditions for client connections made to the cluster. There are two types of status information about cluster operation, direct or inferred.
u. Direct Status Information n There are tools and utilities that provide direct status information on the operation of a Network Load Balancing cluster; you can collect this data from the following three sources: l The events written to the event log by the Network Load Balancing driver. l Interactive information derived by running Wlbs. exe. l Interactive information derived from the Windows Management Instrumentation (WMI) provider for Network Load Balancing.
u. Inferred Status Information n There are tools that you can use to collect only inferred status information on the operation of the Network Load Balancing cluster. These tools and utilities provide information, which you must then interpret to determine the operational status of the cluster. The tools and utilities that provide this data are: l The Performance tool, which includes the System Monitor tool and Performance Logs and Alerts. l The Network Monitor tool. l The Ping. exe and Pathping. exe utilities. l The Arp. exe utility. l The Netstat. exe utility.
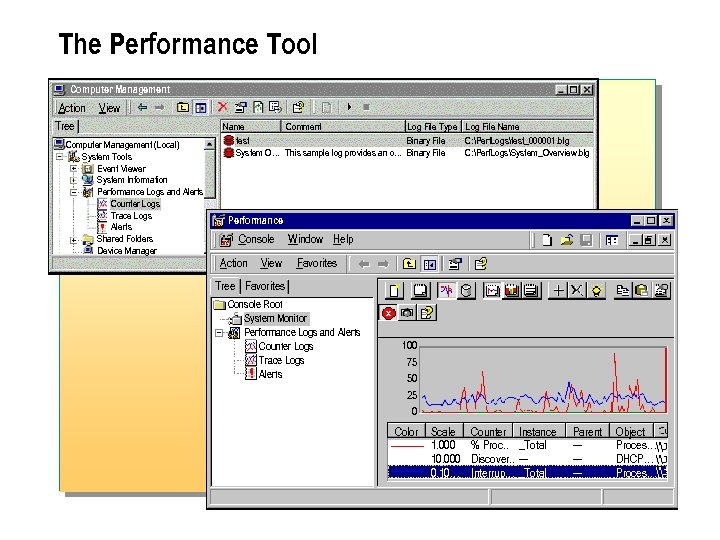
The Performance Tool Computer Management Action View Tree Computer Management (Local) System Tools Event Viewer System Information Performance Logs and Alerts Counter Logs Trace Logs Alerts Shared Folders Device Manager Name Comment Log File Type Log File Name test Binary File C: Perf. Logstest_000001. blg System O… This sample log provides an o… Binary File C: Perf. LogsSystem_Overview. blg Performance Console Action View Window Help Favorites Tree Favorites Console Root System Monitor Performance Logs and Alerts Counter Logs Trace Logs Alerts 100 75 50 25 0 Color Scale 1. 000 10. 000 0. 10… Counter % Proc. . Discover. . Interrup… Instance _Total --_Total Parent ------- Object Proces… DHCP… Proces…
n Microsoft Windows 2000 provides the Performance tool, which contains the System Monitor and Performance Logs and Alerts. You can use these tools or utilities to display and collect performance information for the Network Load Balancing cluster. Monitoring system performance is an important part of maintaining and administering your cluster.
n You can use performance data to: l Understand your workload and the corresponding effect on your cluster or individual cluster hosts. l Observe changes and trends in workloads and resource usage so that youcan plan for future upgrades to the cluster or decide whether you should implement scale up or scale out strategies. l Test configuration changes or other tuning efforts by monitoring the results. l Diagnose problems and target components or processes for optimization.
n System Monitor and Performance Logs and Alerts provide detailed data about the resources that are used by specific components of the operating system and by server programs that have been designed to collect performance data. The components of this tool are: l Graphs that provide a display for performance-monitoring data. l Logs that provide recording capabilities for the data. l Alerts that send notification to users by means of the Messenger service when a counter value reaches, rises above, or falls below a defined threshold.
u. Performance Objects and Counters n Performance objects and counters supply data from system components in your computer. As a component performs work on your system, it updates the performance data. The data is described as a performance object and is typically named for the component generating the data. For example, the Processor object is a collection of performance data about processors on your system. n Note: There are no specific performance objects and counters for the Network Load Balancing driver. Because the driver is installed in the Transmission Control Protocol/Internet Protocol (TCP/IP) stack you can monitor the IP data below and above the driver.
n In monitoring your system, you can use many performance objects, for example, in a Network Load Balanced Web site you can monitor the Internet Information Services (IIS) and Hypertext Transfer Protocol (HTTP) performance objects to assess the performance of the Web site. Because Network Load Balancing works only with IP traffic, the objects you will use most frequently to monitor the Network Load Balancing drivers are: l l TCP l n IP User Datagram Protocol (UDP) Note: To monitor TCP/IP statistics on computers running Windows 2000, install the Simple Network Management Protocol (SNMP) service. Performance Logs and Alerts access these TCP/IP statistics.
u. Performance Data Collection Strategies n The System Monitor tool allows you to capture real-time monitoring and display of performance data. With the Performance Logs and Alerts tool you can acquire performance data to designated file and alerts on any counter. The tools permit access to local and remote computers. n You can generate performance monitor log files on individual servers, or you can obtain the data from multiple servers by a single instance of Performance Monitor, writing the data to a centralized log. To ensure the smallest file sizes, always record data by using the binary format.
You can collect data in the following ways: n Centralized, when the number of counters is low, or the collection interval is long, or both. n Distributed, when the number of counters is high, or the collection interval is short, or both.
n When collecting performance data you must decide whether you will collect data locally or from a central location. It is recommended that the collection of data be centralized but not collected by using the Network Load Balancing cluster IP address. If you collect data by using the cluster IP address, the in-band collection impacts throughput to the cluster.
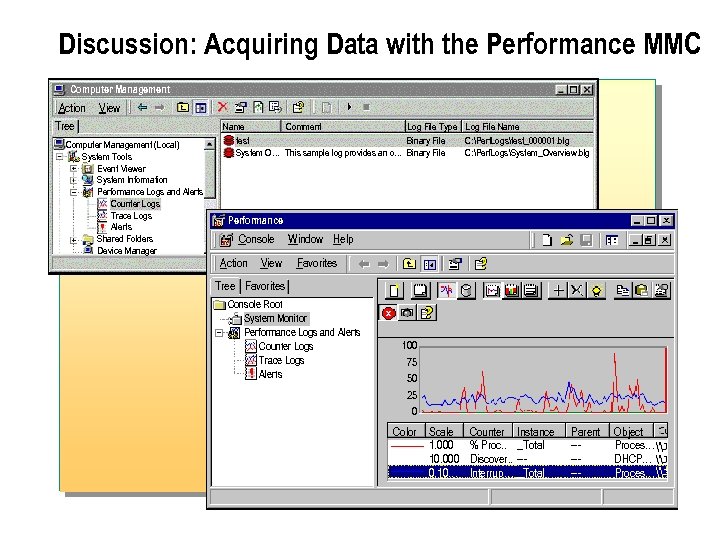
Discussion: Acquiring Data with the Performance MMC Computer Management Action View Tree Computer Management (Local) System Tools Event Viewer System Information Performance Logs and Alerts Counter Logs Trace Logs Alerts Shared Folders Device Manager Name Comment Log File Type Log File Name test Binary File C: Perf. Logstest_000001. blg System O… This sample log provides an o… Binary File C: Perf. LogsSystem_Overview. blg Performance Console Action View Window Help Favorites Tree Favorites Console Root System Monitor Performance Logs and Alerts Counter Logs Trace Logs Alerts 100 75 50 25 0 Color Scale 1. 000 10. 000 0. 10… Counter % Proc. . Discover. . Interrup… Instance _Total --_Total Parent ------- Object Proces… DHCP… Proces…
n To monitor servers, you must acquire status information for analysis, or set alerts to give instant notification on the monitored services. You can view data from Performance Logs and Alerts in real-time, or save it to disk files for later analysis.
u. Setting up a Monitoring Configuration n Configure Performance Logs and Alerts to report data for the recommended counters at regular intervals, such as every 10 to 15 minutes. Retain logs over extended periods of time, store data in a database, and query the data to report on and analyze the data as needed for overall performance assessment, trend analysis, and capacity planning.
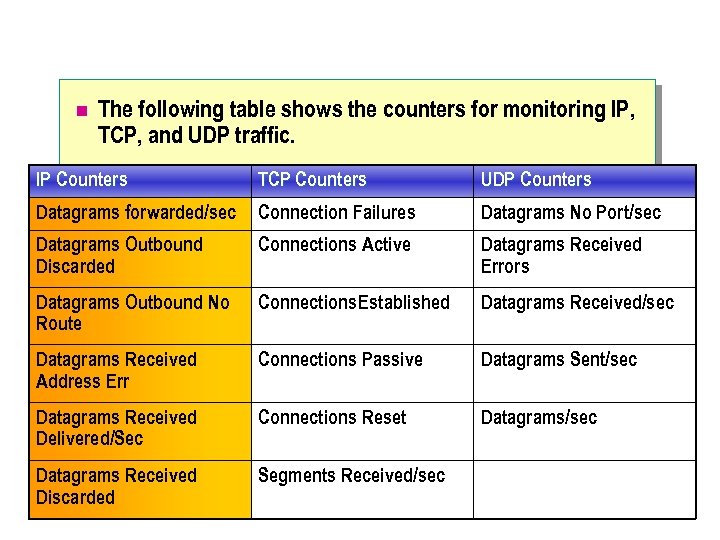
n The following table shows the counters for monitoring IP, TCP, and UDP traffic. IP Counters TCP Counters UDP Counters Datagrams forwarded/sec Connection Failures Datagrams No Port/sec Datagrams Outbound Discarded Connections Active Datagrams Received Errors Datagrams Outbound No Route Connections Established Datagrams Received/sec Datagrams Received Address Err Connections Passive Datagrams Sent/sec Datagrams Received Delivered/Sec Connections Reset Datagrams/sec Datagrams Received Discarded Segments Received/sec
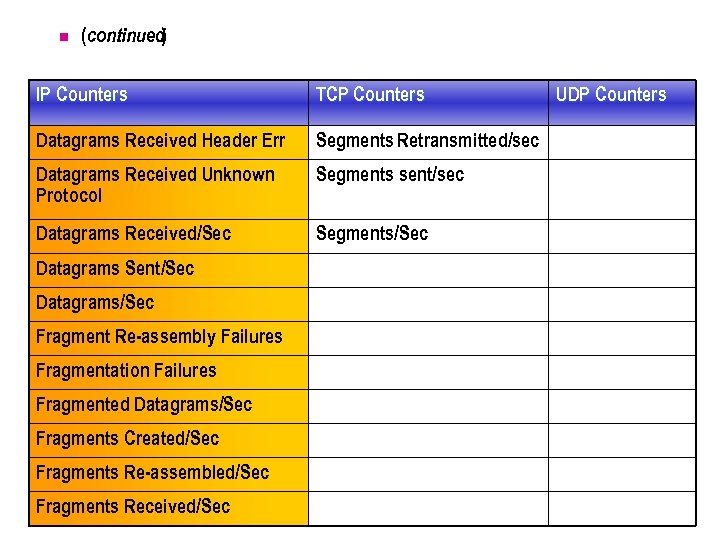
n (continued) IP Counters TCP Counters Datagrams Received Header Err Segments Retransmitted/sec Datagrams Received Unknown Protocol Segments sent/sec Datagrams Received/Sec Segments/Sec Datagrams Sent/Sec Datagrams/Sec Fragment Re-assembly Failures Fragmentation Failures Fragmented Datagrams/Sec Fragments Created/Sec Fragments Re-assembled/Sec Fragments Received/Sec UDP Counters

n To complete the discussion, read through the table and then answer the first question. Be prepared to discuss the object classes and counters that are available, and their relevance as failure indicators.
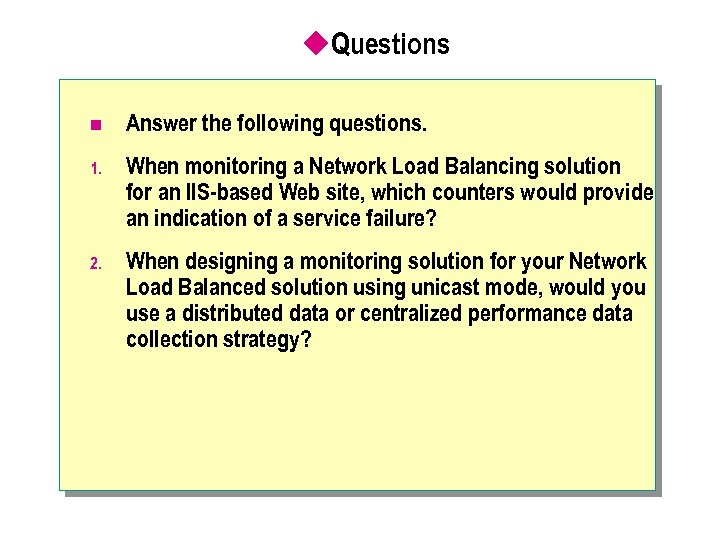
u. Questions n Answer the following questions. 1. When monitoring a Network Load Balancing solution for an IIS-based Web site, which counters would provide an indication of a service failure? 2. When designing a monitoring solution for your Network Load Balanced solution using unicast mode, would you use a distributed data or centralized performance data collection strategy?
Network Monitor n Network Monitor Components n Capturing Network Data n Network Monitor Security
n You can use the Network Monitor tool to capture and display the packets that a computer sends or receives on a local area network (LAN). You can also use Network Monitor to detect and troubleshoot networking problems that the local host might experience. For example, as a network administrator, you can use Network Monitor to diagnose hardware and software problems when a host cannot communicate with other host members in the Network Load Balancing cluster.
u. Network Monitor Components n Network Monitor is composed of an administrative tool called Network Monitor and a network protocol called the Network Monitor driver. You must install both of these components to capture, display, and analyze network packets. n By default, Network Monitor does not provide a parser to display heartbeat and remote control data between cluster members. You must install the Windows Load Balancing Service (WLBS) network monitor parsers (Wlbs_hb. dll and Wlbs_rc. dll) in the NetmonParsers directory. The parsers for WLBS traffic are available in the Windows 2000 Server Resource Kit. n Note: To monitor all of the traffic on a network you must use the version of Network Monitor provided with Microsoft Systems Management Server.
u. Capturing Network Data n The process by which Network Monitor copies packets is referred to as capturing. You can capture all of the network traffic to and from the local network card, or you can set a capture filter and capture a subset of packets. You can also specify a set of conditions that trigger an event in a Network Monitor capture filter. By using triggers, Network Monitor can respond to events on your network. For example, you can start an executable file when Network Monitor has a trigger, which detects a particular set of conditions on the network, such as a large number of TCP connection Resets on a cluster. After you have captured data, you can view it. Network Monitor does much of the data analysis for you by translating the raw capture data into its logical frame structure.
n To minimize the amount of data that is being captured, you can use a capture filter to define the required capture traffic. n Note: It is not recommended to run the Network Monitor on a host within the cluster, as the Network Monitor driver will place the network adapter into promiscuous mode.
u. Network Monitor Security n When running the Network Monitor, you can help protect your network from unauthorized use of Network Monitor installations; Network Monitor provides the capability to detect other installations of Network Monitor that are running on the local segment of your network. n Important: Running Network Monitor at high usage times can decrease system performance. Plan on running Network Monitor when the system is at low usage or for short periods of time. To avoid capturing too much information, capture only as many statistics as you need for evaluation. Smaller amounts of data allow you to make a reasonably quick diagnosis of the problem.
n When Network Monitor detects other installations that are running on the network, it displays the following information about them: l The name of the computer that is running the Network Monitor installation. l The name of the user logged on at the computer. l The state of Network Monitor on the remote computer (running, capturing, or transmitting). l The adapter address of the remote computer. l The version number of Network Monitor running on the remote computer.
n Note: In some scenarios, your network architecture might prevent one installation of the Network Monitor tool from detecting another. For example, if a router that does not forward multicast packets separates another installation of Network Monitor from your installation of the tool, Network Monitor will not detect the previous installation.
Event Viewer n Event Viewer Overview l n Event Viewer Events Using Event Logs to Troubleshoot Problems
n The Network Load Balancing driver writes events to the event log recording status changes and errors for cluster operations. For example, adding a host to the cluster with inconsistent port rules results in an error being written to the event log. The system components and applications that are installed on a computer can write information to the event log, which records status changes, errors, or operating information.
u. Event Viewer Overview n You can use Event Viewer to view and manage the event logs, gather information from the logs about hardware and software problems, and monitor Windows 2000 security events. Events are recorded in three categories of logs; the application log, system log, and security log. The Network Load Balancing driver writes to the system log.
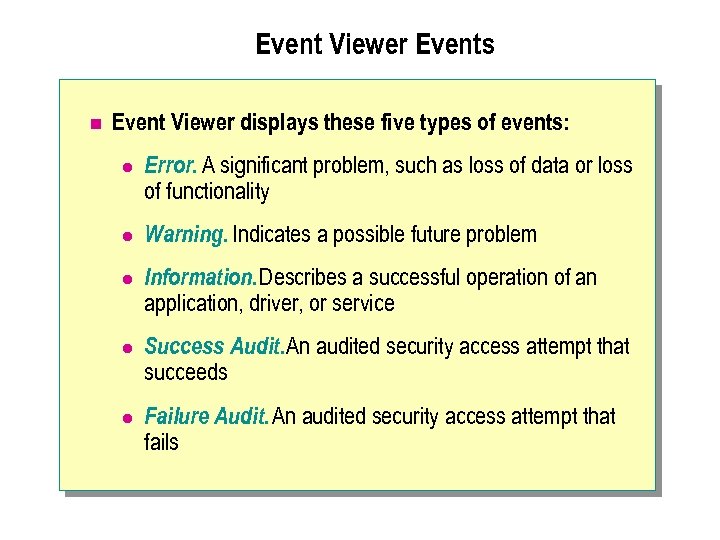
Event Viewer Events n Event Viewer displays these five types of events: l Error. A significant problem, such as loss of data or loss of functionality l Warning. Indicates a possible future problem l Information. Describes a successful operation of an application, driver, or service l Success Audit. An audited security access attempt that succeeds l Failure Audit. An audited security access attempt that fails
u. Using Event Logs to Troubleshoot Problems n It is important to establish a baseline for your current configuration by using the System Monitor and Performance Logs and Alerts to understand the accumulated events as your system operates. In this way you can filter the accumulated events to show only events that indicate some abnormality in operation. You can save the event logs for your system in log format to provide a reference or baseline for normal operation.
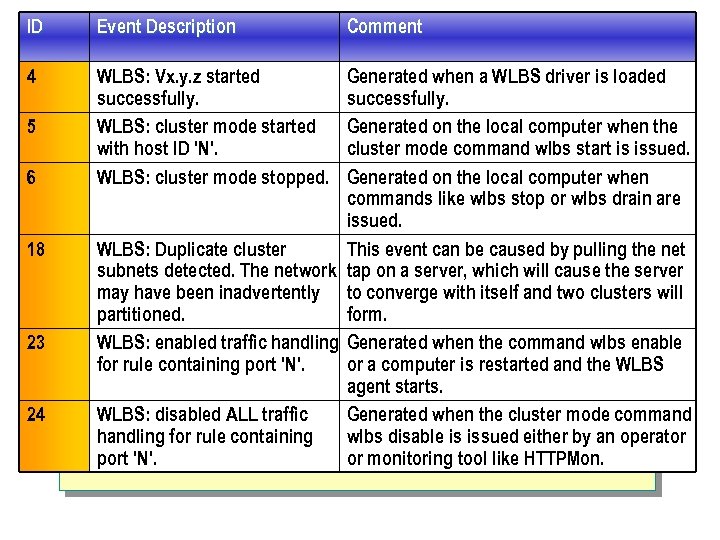
ID Event Description 4 WLBS: Vx. y. z started successfully. WLBS: cluster mode started with host ID 'N'. WLBS: cluster mode stopped. 5 6 18 23 24 Comment Generated when a WLBS driver is loaded successfully. Generated on the local computer when the cluster mode command wlbs start is issued. Generated on the local computer when commands like wlbs stop or wlbs drain are issued. WLBS: Duplicate cluster This event can be caused by pulling the net subnets detected. The network tap on a server, which will cause the server may have been inadvertently to converge with itself and two clusters will partitioned. form. WLBS: enabled traffic handling Generated when the command wlbs enable for rule containing port 'N'. or a computer is restarted and the WLBS agent starts. WLBS: disabled ALL traffic Generated when the cluster mode command handling for rule containing wlbs disable is issued either by an operator port 'N'. or monitoring tool like HTTPMon.
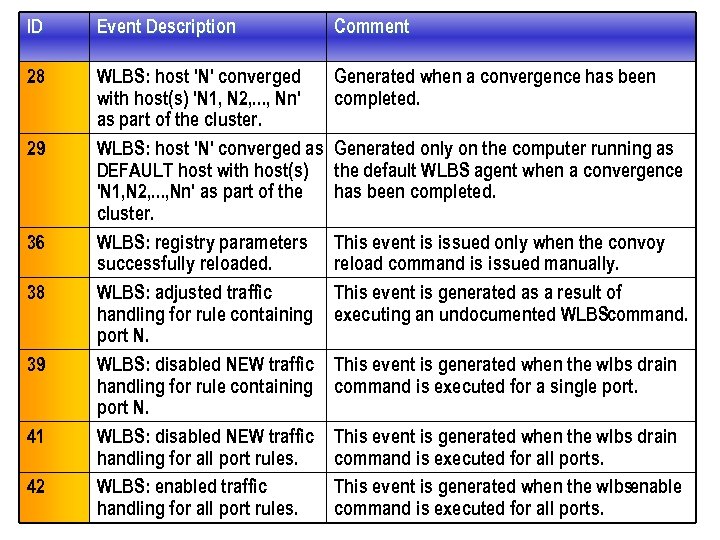
ID Event Description Comment 28 WLBS: host 'N' converged with host(s) 'N 1, N 2, . . . , Nn' as part of the cluster. WLBS: host 'N' converged as DEFAULT host with host(s) 'N 1, N 2, . . . , Nn' as part of the cluster. WLBS: registry parameters successfully reloaded. WLBS: adjusted traffic handling for rule containing port N. WLBS: disabled NEW traffic handling for all port rules. WLBS: enabled traffic handling for all port rules. Generated when a convergence has been completed. 29 36 38 39 41 42 Generated only on the computer running as the default WLBS agent when a convergence has been completed. This event is issued only when the convoy reload command is issued manually. This event is generated as a result of executing an undocumented WLBScommand. This event is generated when the wlbs drain command is executed for a single port. This event is generated when the wlbs drain command is executed for all ports. This event is generated when the wlbsenable command is executed for all ports.
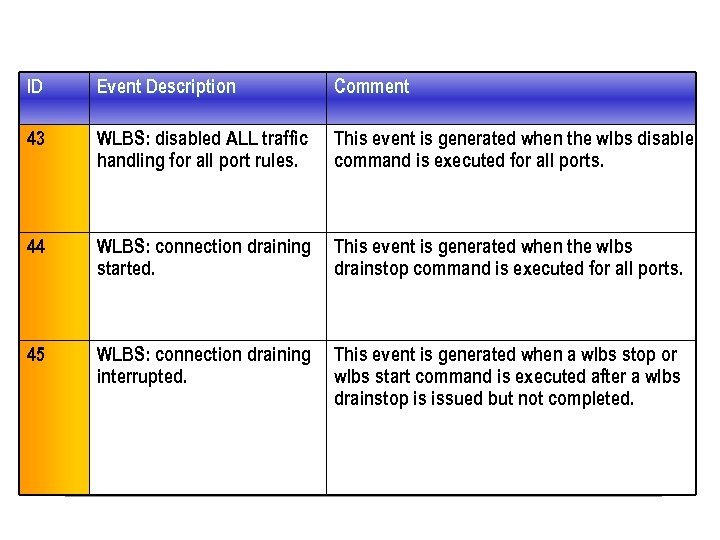
ID Event Description Comment 43 WLBS: disabled ALL traffic handling for all port rules. This event is generated when the wlbs disable command is executed for all ports. 44 WLBS: connection draining started. This event is generated when the wlbs drainstop command is executed for all ports. 45 WLBS: connection draining interrupted. This event is generated when a wlbs stop or wlbs start command is executed after a wlbs drainstop is issued but not completed.
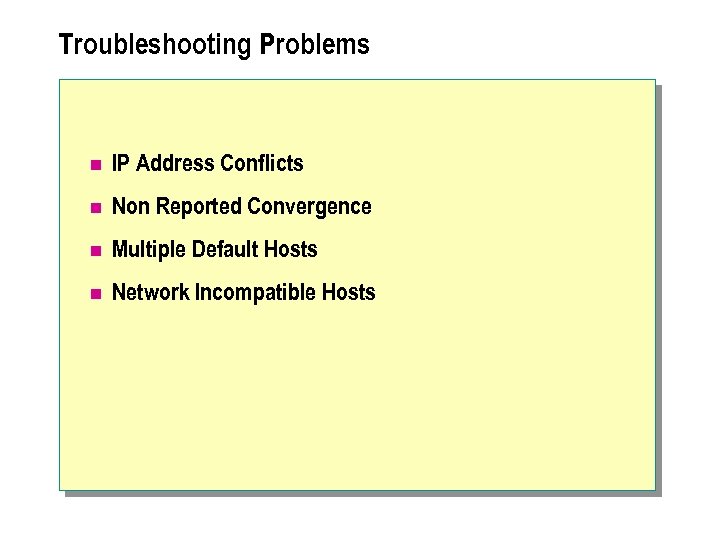
Troubleshooting Problems n IP Address Conflicts n Non Reported Convergence n Multiple Default Hosts n Network Incompatible Hosts
n You may encounter problems when installing and initially using Network Load Balancing. Testing your network and all network adapters for properation before installing Network Load Balancing can help to reduce common configuration problems. n Be sure to follow all of the installation steps and check that the clusterparameters and port rules are identically set for all of the cluster hosts. Ifproblems occur, always check the event log for messages from the Network Load Balancing driver.
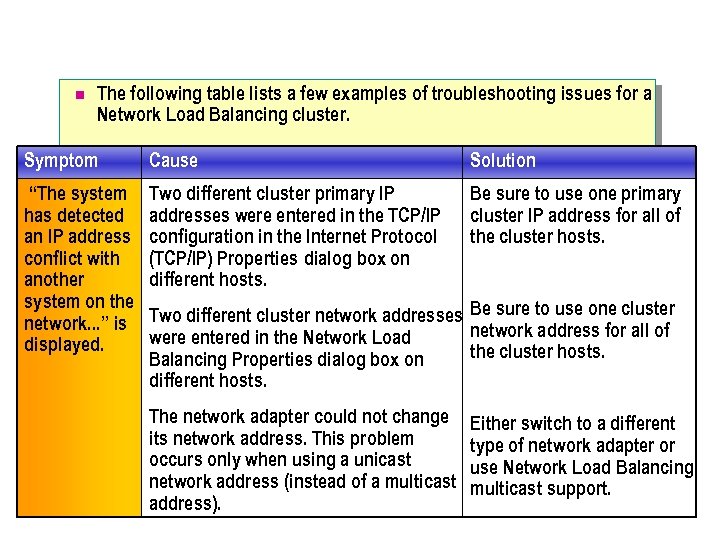
n The following table lists a few examples of troubleshooting issues for a Network Load Balancing cluster. Symptom Cause Solution “The system has detected an IP address conflict with another system on the network. . . ” is displayed. Two different cluster primary IP addresses were entered in the TCP/IP configuration in the Internet Protocol (TCP/IP) Properties dialog box on different hosts. Be sure to use one primary cluster IP address for all of the cluster hosts. Two different cluster network addresses Be sure to use one cluster network address for all of were entered in the Network Load the cluster hosts. Balancing Properties dialog box on different hosts. The network adapter could not change its network address. This problem occurs only when using a unicast network address (instead of a multicast address). Either switch to a different type of network adapter or use Network Load Balancing multicast support.
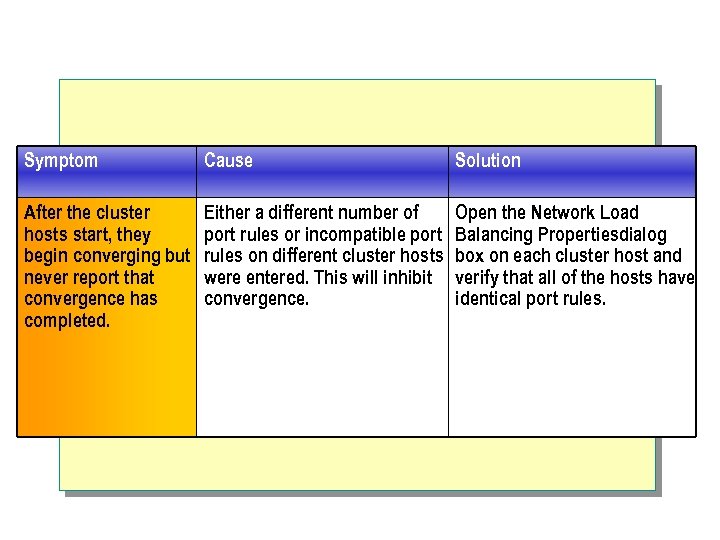
Symptom Cause Solution After the cluster hosts start, they begin converging but never report that convergence has completed. Either a different number of port rules or incompatible port rules on different cluster hosts were entered. This will inhibit convergence. Open the Network Load Balancing Propertiesdialog box on each cluster host and verify that all of the hosts have identical port rules.
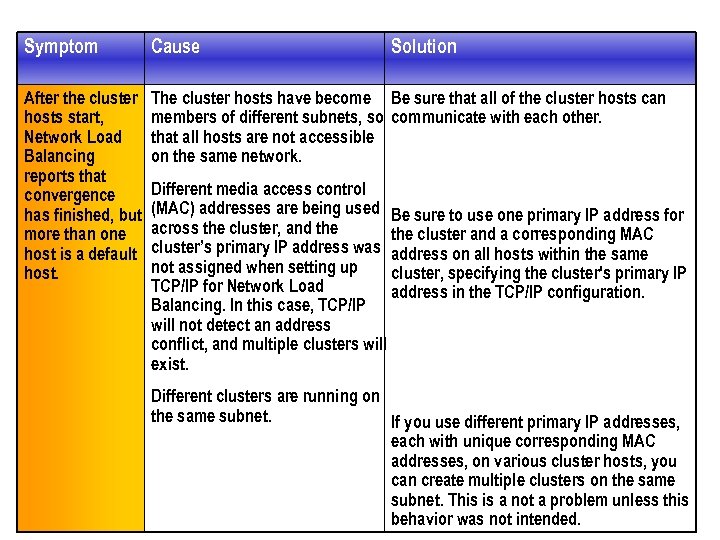
Symptom Cause Solution After the cluster hosts start, Network Load Balancing reports that convergence has finished, but more than one host is a default host. The cluster hosts have become Be sure that all of the cluster hosts can members of different subnets, so communicate with each other. that all hosts are not accessible on the same network. Different media access control (MAC) addresses are being used Be sure to use one primary IP address for across the cluster, and the cluster and a corresponding MAC cluster’s primary IP address was address on all hosts within the same not assigned when setting up cluster, specifying the cluster's primary IP TCP/IP for Network Load address in the TCP/IP configuration. Balancing. In this case, TCP/IP will not detect an address conflict, and multiple clusters will exist. Different clusters are running on the same subnet. If you use different primary IP addresses, each with unique corresponding MAC addresses, on various cluster hosts, you can create multiple clusters on the same subnet. This is a not a problem unless this behavior was not intended.
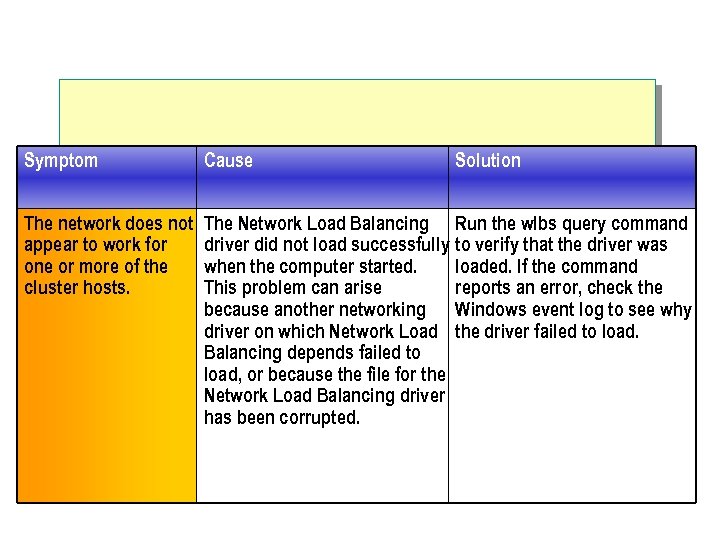
Symptom Cause Solution The network does not appear to work for one or more of the cluster hosts. The Network Load Balancing Run the wlbs query command driver did not load successfully to verify that the driver was when the computer started. loaded. If the command This problem can arise reports an error, check the because another networking Windows event log to see why driver on which Network Load the driver failed to load. Balancing depends failed to load, or because the file for the Network Load Balancing driver has been corrupted.
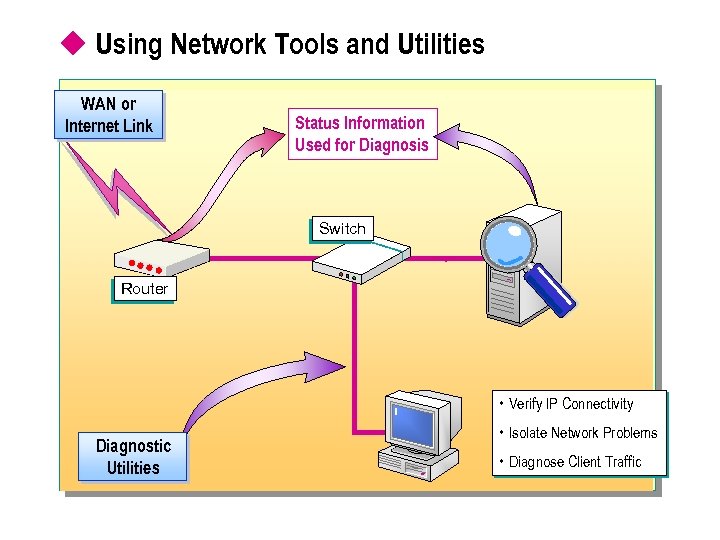
u Using Network Tools and Utilities WAN or Internet Link Status Information Used for Diagnosis Switch Router • Verify IP Connectivity Diagnostic Utilities • Isolate Network Problems • Diagnose Client Traffic
n As the system administrator, it is important that you are aware of the network tools that you use to confirm the status of your Network Load Balancing cluster. You can use these tools and utilities to verify IP-level connectivity, or isolate problems with the network hardware and incompatible network configurations. n Using network tools and utilities, you can send IP packets to each router over a period of time and then compute results that are based on the returned packets. By analyzing this collected data of packets that are sent and returned to a designated router or link, you can determine which routers or links might be causing network problems.
n You use some of these tools and utilities to diagnose client traffic, display information on the Domain Name System (DNS) servers, display protocol statistics, or modify the IP physical address.
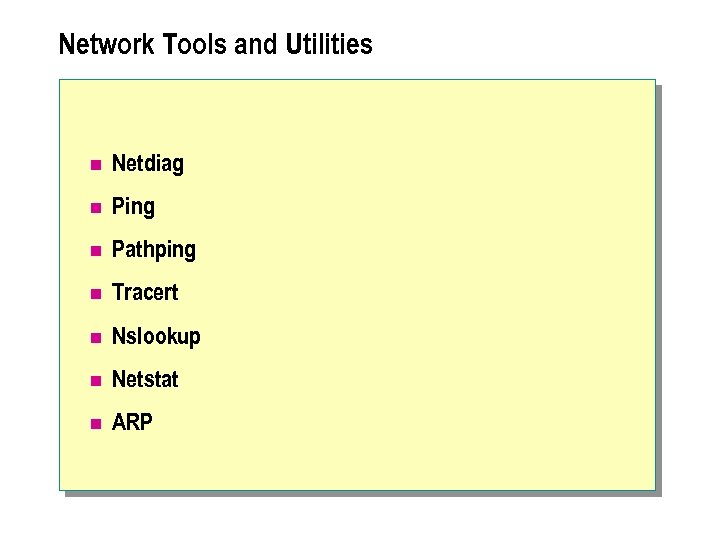
Network Tools and Utilities n Netdiag n Ping n Pathping n Tracert n Nslookup n Netstat n ARP
n You can use command line network tools and utilities to test the status of both the services and the network infrastructure of your Network Load Balancing cluster. You can use the information collected by these tools and utilities to analyze service, network operation, and variations in performance. You can use the tools and utilities interactively, or you can store their output in files for later analysis.
n You can use the following tools and utilities interactively to provide status information about the Network Load Balancing cluster:
n Netdiag. A utility that performs a series of tests to isolate networking and connectivity problems; it is also used to determine the functional state of your network client. Netdiag performs extensive testing of the computer on which it is run, including checking the availability of WINS and DNS. You install Netdiag with the support tools, which are available in the SupportTools directory of your Windows 2000 compact disc.
n Ping. A utility used to troubleshoot IP-level connectivity. Ping allows you to specify the size of packets to use (the default is 32 bytes), how many to send, whether to record the route used, what Time to Live (TTL) value to use, and whether to set the don't fragment flag. Ping provides a minimum average and maximum roundtrip time (RTT), which is useful to analyze where routing delays occur.
n Pathping. A route-tracing tool that combines the features of Ping and Tracert with additional unique information. Over a period of time, Pathping sends packets to each router on the path to a final destination, and then computes results that are based on the packets that are returned from each hop. Pathping shows the degree of packet loss at any given router or link, so that you can pinpoint which routers or links might be causing network problems.
n Tracert. A route-tracing utility that displays a list of router interfaces from the routers along the path between a source host and a destination. Tracert uses the IP TTL field in Internet Control Message Protocol (ICMP) Echo Requests and ICMP Time Exceeded messages to determine the path from a source to a destination through an IP internetwork.
n Nslookup. A utility that is used for troubleshooting DNS problems, such as host name resolution failure. Nslookup displays a command prompt and shows the host name and IP address of the local DNS server. You can then perform interactive queries to test DNS name resolution.
n Netstat. A utility that is used to display protocol statistics and current TCP/IP connections. You can display the connection status and throughput statistics for TCP/IP interfaces in the computer.
n ARP. A utility that is used to display and modify the IP-tophysical address translation tables in hosts and routers that the address resolution protocol uses.

Demonstration: Examining Network Properties
n You can examine the network properties by analyzing the flow of traffic on the network. You will use Network Monitor to examine data captured from a network.
n The following demonstration shows a capture from a client (10. 10. 100) where multiple instances of Internet Explorer are started, configured to a default Web site (10. 10. 3) that is served by a 2 -host cluster in unicast mode. 1. Start Network Monitor by clicking on Start – Programs – Administrative Tools – Network Analysis Tools – Network Monitor. 2. Click File, and then Open; in the Open dialog box select NLB_2 HOSTS_UNICAST. CAP and then click Open. 3. The capture shows the traffic between a client (IP is 10. 10. 100) and a 2 -host Network Load Balancing cluster (cluster IP is 10. 10. 3, and the dedicated IP addresses are 10. 10. 4 and 10. 10. 5). 4. Examine the first few frames, which are heartbeat communications between the cluster hosts. n Note: Network Monitor requires additional configuration to display the contents of the Network Load Balancing heartbeat packets. The Windows 2000 Server Resource Kit supplies the required dlls and installation information.
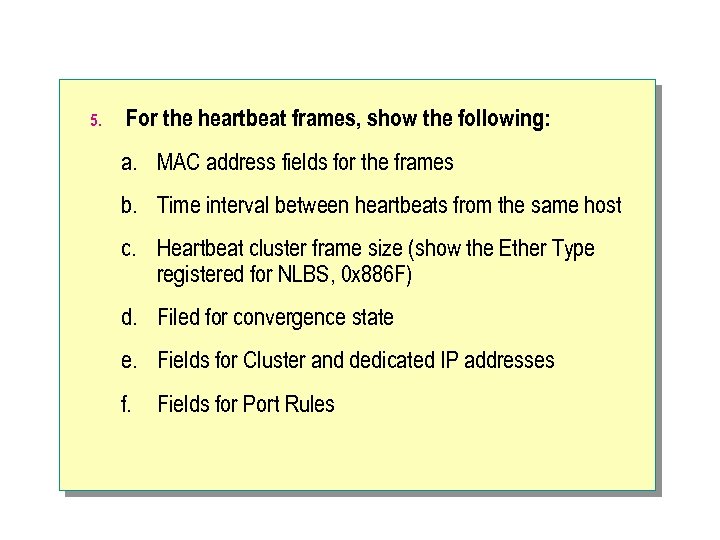
5. For the heartbeat frames, show the following: a. MAC address fields for the frames b. Time interval between heartbeats from the same host c. Heartbeat cluster frame size (show the Ether Type registered for NLBS, 0 x 886 F) d. Filed for convergence state e. Fields for Cluster and dedicated IP addresses f. Fields for Port Rules
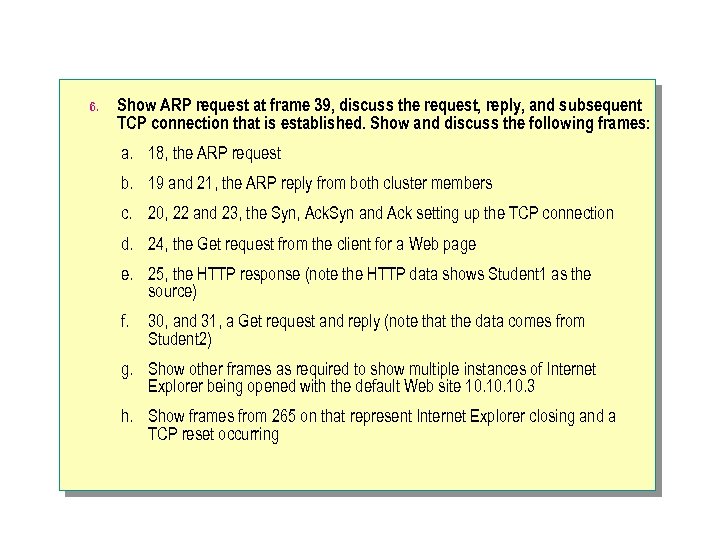
6. Show ARP request at frame 39, discuss the request, reply, and subsequent TCP connection that is established. Show and discuss the following frames: a. 18, the ARP request b. 19 and 21, the ARP reply from both cluster members c. 20, 22 and 23, the Syn, Ack. Syn and Ack setting up the TCP connection d. 24, the Get request from the client for a Web page e. 25, the HTTP response (note the HTTP data shows Student 1 as the source) f. 30, and 31, a Get request and reply (note that the data comes from Student 2) g. Show other frames as required to show multiple instances of Internet Explorer being opened with the default Web site 10. 10. 3 h. Show frames from 265 on that represent Internet Explorer closing and a TCP reset occurring
Lab A: Network Load Balancing Cluster Troubleshooting
Objectives n After completing this lab, you will be able to: l Install Network Monitor (Net. Mon). l Use Net. Mon to view cluster traffic between clients and cluster hosts.
Exercise 1: Installing Network Monitor n You will work individually and together in pairs to analyze cluster host operations.
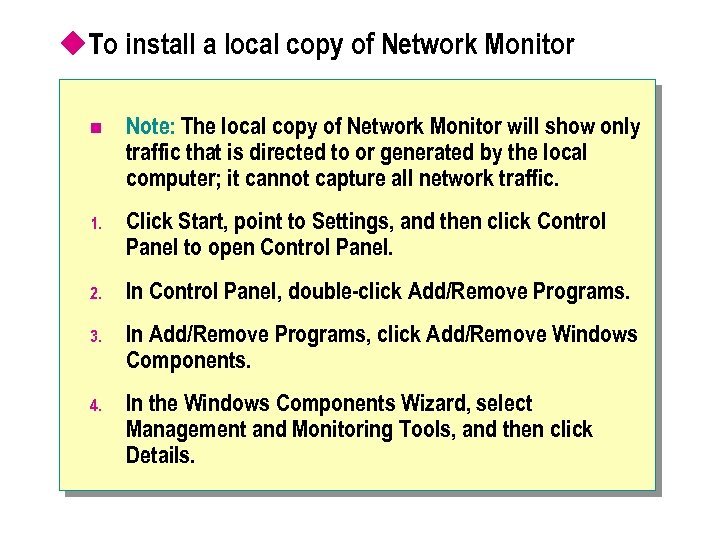
u. To install a local copy of Network Monitor n Note: The local copy of Network Monitor will show only traffic that is directed to or generated by the local computer; it cannot capture all network traffic. 1. Click Start, point to Settings, and then click Control Panel to open Control Panel. 2. In Control Panel, double-click Add/Remove Programs. 3. In Add/Remove Programs, click Add/Remove Windows Components. 4. In the Windows Components Wizard, select Management and Monitoring Tools, and then click Details.
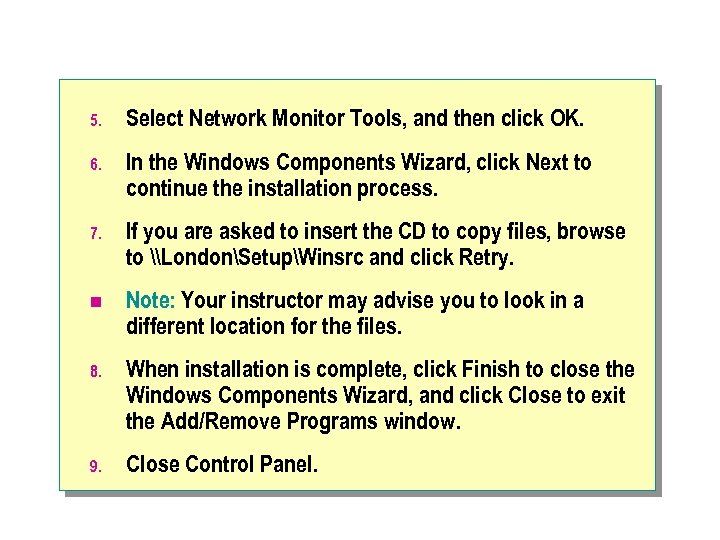
5. Select Network Monitor Tools, and then click OK. 6. In the Windows Components Wizard, click Next to continue the installation process. 7. If you are asked to insert the CD to copy files, browse to \LondonSetupWinsrc and click Retry. n Note: Your instructor may advise you to look in a different location for the files. 8. When installation is complete, click Finish to close the Windows Components Wizard, and click Close to exit the Add/Remove Programs window. 9. Close Control Panel.
Exercise 2: Using Network Monitor n All students complete this procedure and will work with a partner. You will collect information on Network Load Balancing traffic by using the Network Monitor tool. The following procedure records, examines, and analyzes traffic on the 2 -host cluster. n Note: It is important that you configure the student cluster members to use Multicast at the beginning of this exercise. If you do not configure the cluster to use Multicast, alter the configuration before starting.
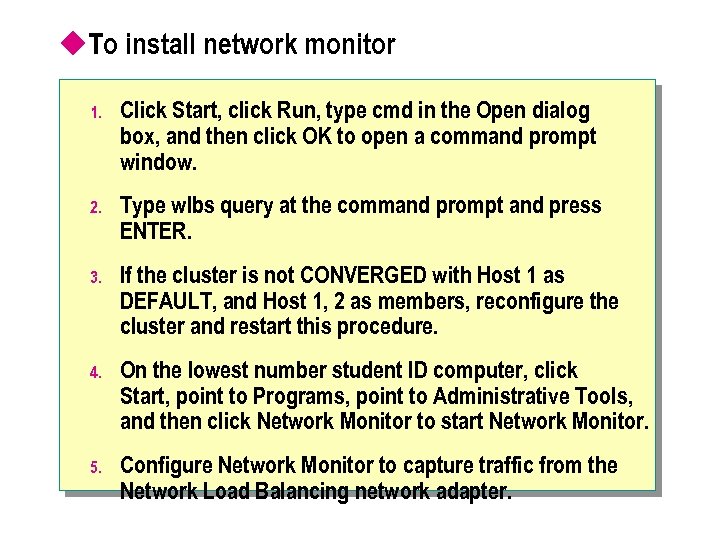
u. To install network monitor 1. Click Start, click Run, type cmd in the Open dialog box, and then click OK to open a command prompt window. 2. Type wlbs query at the command prompt and press ENTER. 3. If the cluster is not CONVERGED with Host 1 as DEFAULT, and Host 1, 2 as members, reconfigure the cluster and restart this procedure. 4. On the lowest number student ID computer, click Start, point to Programs, point to Administrative Tools, and then click Network Monitor to start Network Monitor. 5. Configure Network Monitor to capture traffic from the Network Load Balancing network adapter.
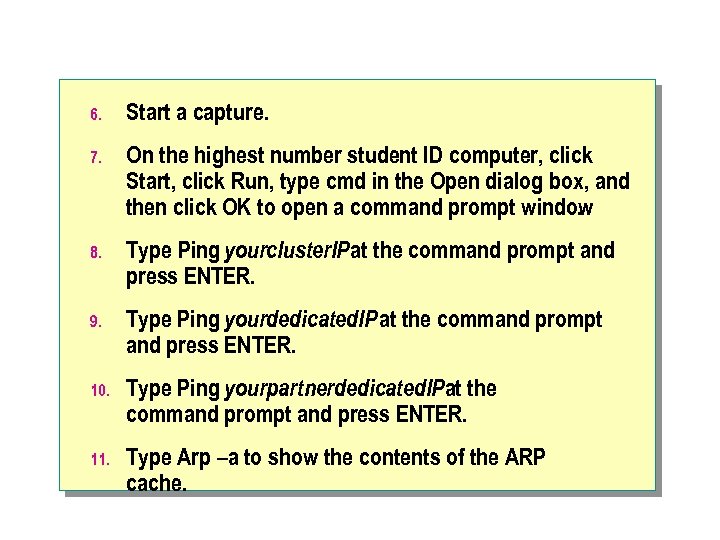
6. Start a capture. 7. On the highest number student ID computer, click Start, click Run, type cmd in the Open dialog box, and then click OK to open a command prompt window. 8. Type Ping yourcluster. IP at the command prompt and press ENTER. 9. Type Ping yourdedicated. IP at the command prompt and press ENTER. 10. Type Ping yourpartnerdedicated. IPat the command prompt and press ENTER. 11. Type Arp –a to show the contents of the ARP cache.
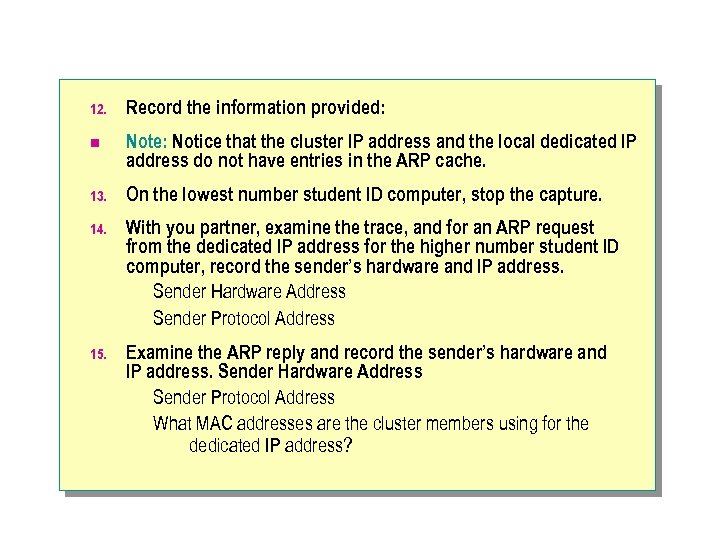
12. Record the information provided: n Note: Notice that the cluster IP address and the local dedicated IP address do not have entries in the ARP cache. 13. On the lowest number student ID computer, stop the capture. 14. With you partner, examine the trace, and for an ARP request from the dedicated IP address for the higher number student ID computer, record the sender’s hardware and IP address. Sender Hardware Address Sender Protocol Address 15. Examine the ARP reply and record the sender’s hardware and IP address. Sender Hardware Address Sender Protocol Address What MAC addresses are the cluster members using for the dedicated IP address?
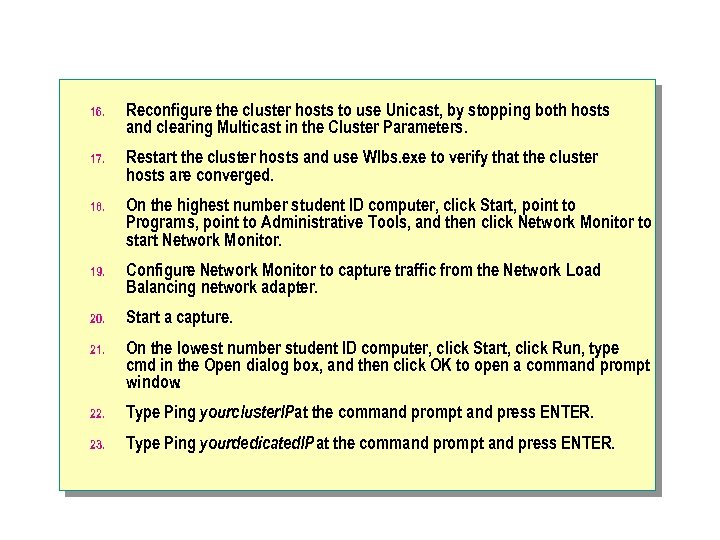
16. Reconfigure the cluster hosts to use Unicast, by stopping both hosts and clearing Multicast in the Cluster Parameters. 17. Restart the cluster hosts and use Wlbs. exe to verify that the cluster hosts are converged. 18. On the highest number student ID computer, click Start, point to Programs, point to Administrative Tools, and then click Network Monitor to start Network Monitor. 19. Configure Network Monitor to capture traffic from the Network Load Balancing network adapter. 20. Start a capture. 21. On the lowest number student ID computer, click Start, click Run, type cmd in the Open dialog box, and then click OK to open a command prompt window. 22. Type Ping yourcluster. IP at the command prompt and press ENTER. 23. Type Ping yourdedicated. IP at the command prompt and press ENTER.
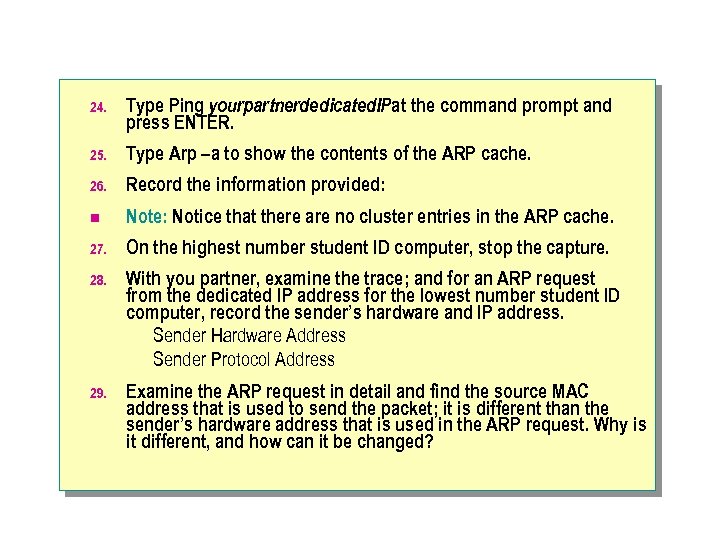
24. Type Ping yourpartnerdedicated. IPat the command prompt and press ENTER. 25. Type Arp –a to show the contents of the ARP cache. 26. Record the information provided: n Note: Notice that there are no cluster entries in the ARP cache. 27. On the highest number student ID computer, stop the capture. 28. With you partner, examine the trace; and for an ARP request from the dedicated IP address for the lowest number student ID computer, record the sender’s hardware and IP address. Sender Hardware Address Sender Protocol Address 29. Examine the ARP request in detail and find the source MAC address that is used to send the packet; it is different than the sender’s hardware address that is used in the ARP request. Why is it different, and how can it be changed?
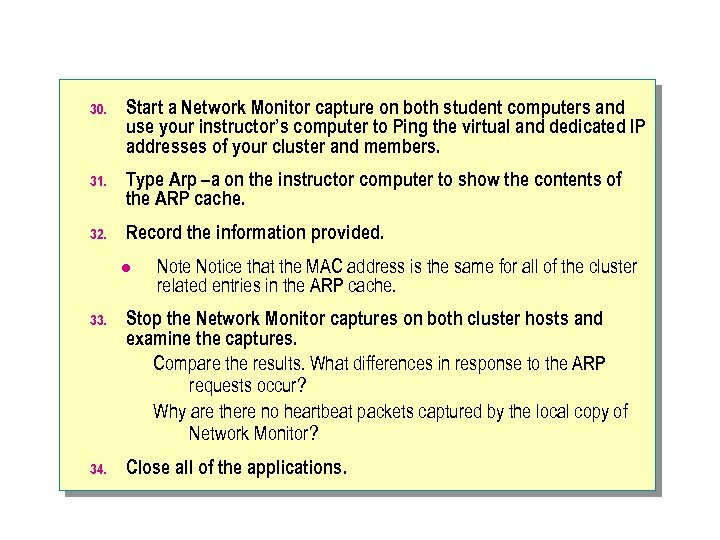
30. Start a Network Monitor capture on both student computers and use your instructor’s computer to Ping the virtual and dedicated IP addresses of your cluster and members. 31. Type Arp –a on the instructor computer to show the contents of the ARP cache. 32. Record the information provided. l Note Notice that the MAC address is the same for all of the cluster related entries in the ARP cache. 33. Stop the Network Monitor captures on both cluster hosts and examine the captures. Compare the results. What differences in response to the ARP requests occur? Why are there no heartbeat packets captured by the local copy of Network Monitor? 34. Close all of the applications.
Review n Using Status Tools and Utilities n Troubleshooting Problems n Using Network Tools and Utilities
23994b68c3e079e38cc8555855743464.ppt